SEO
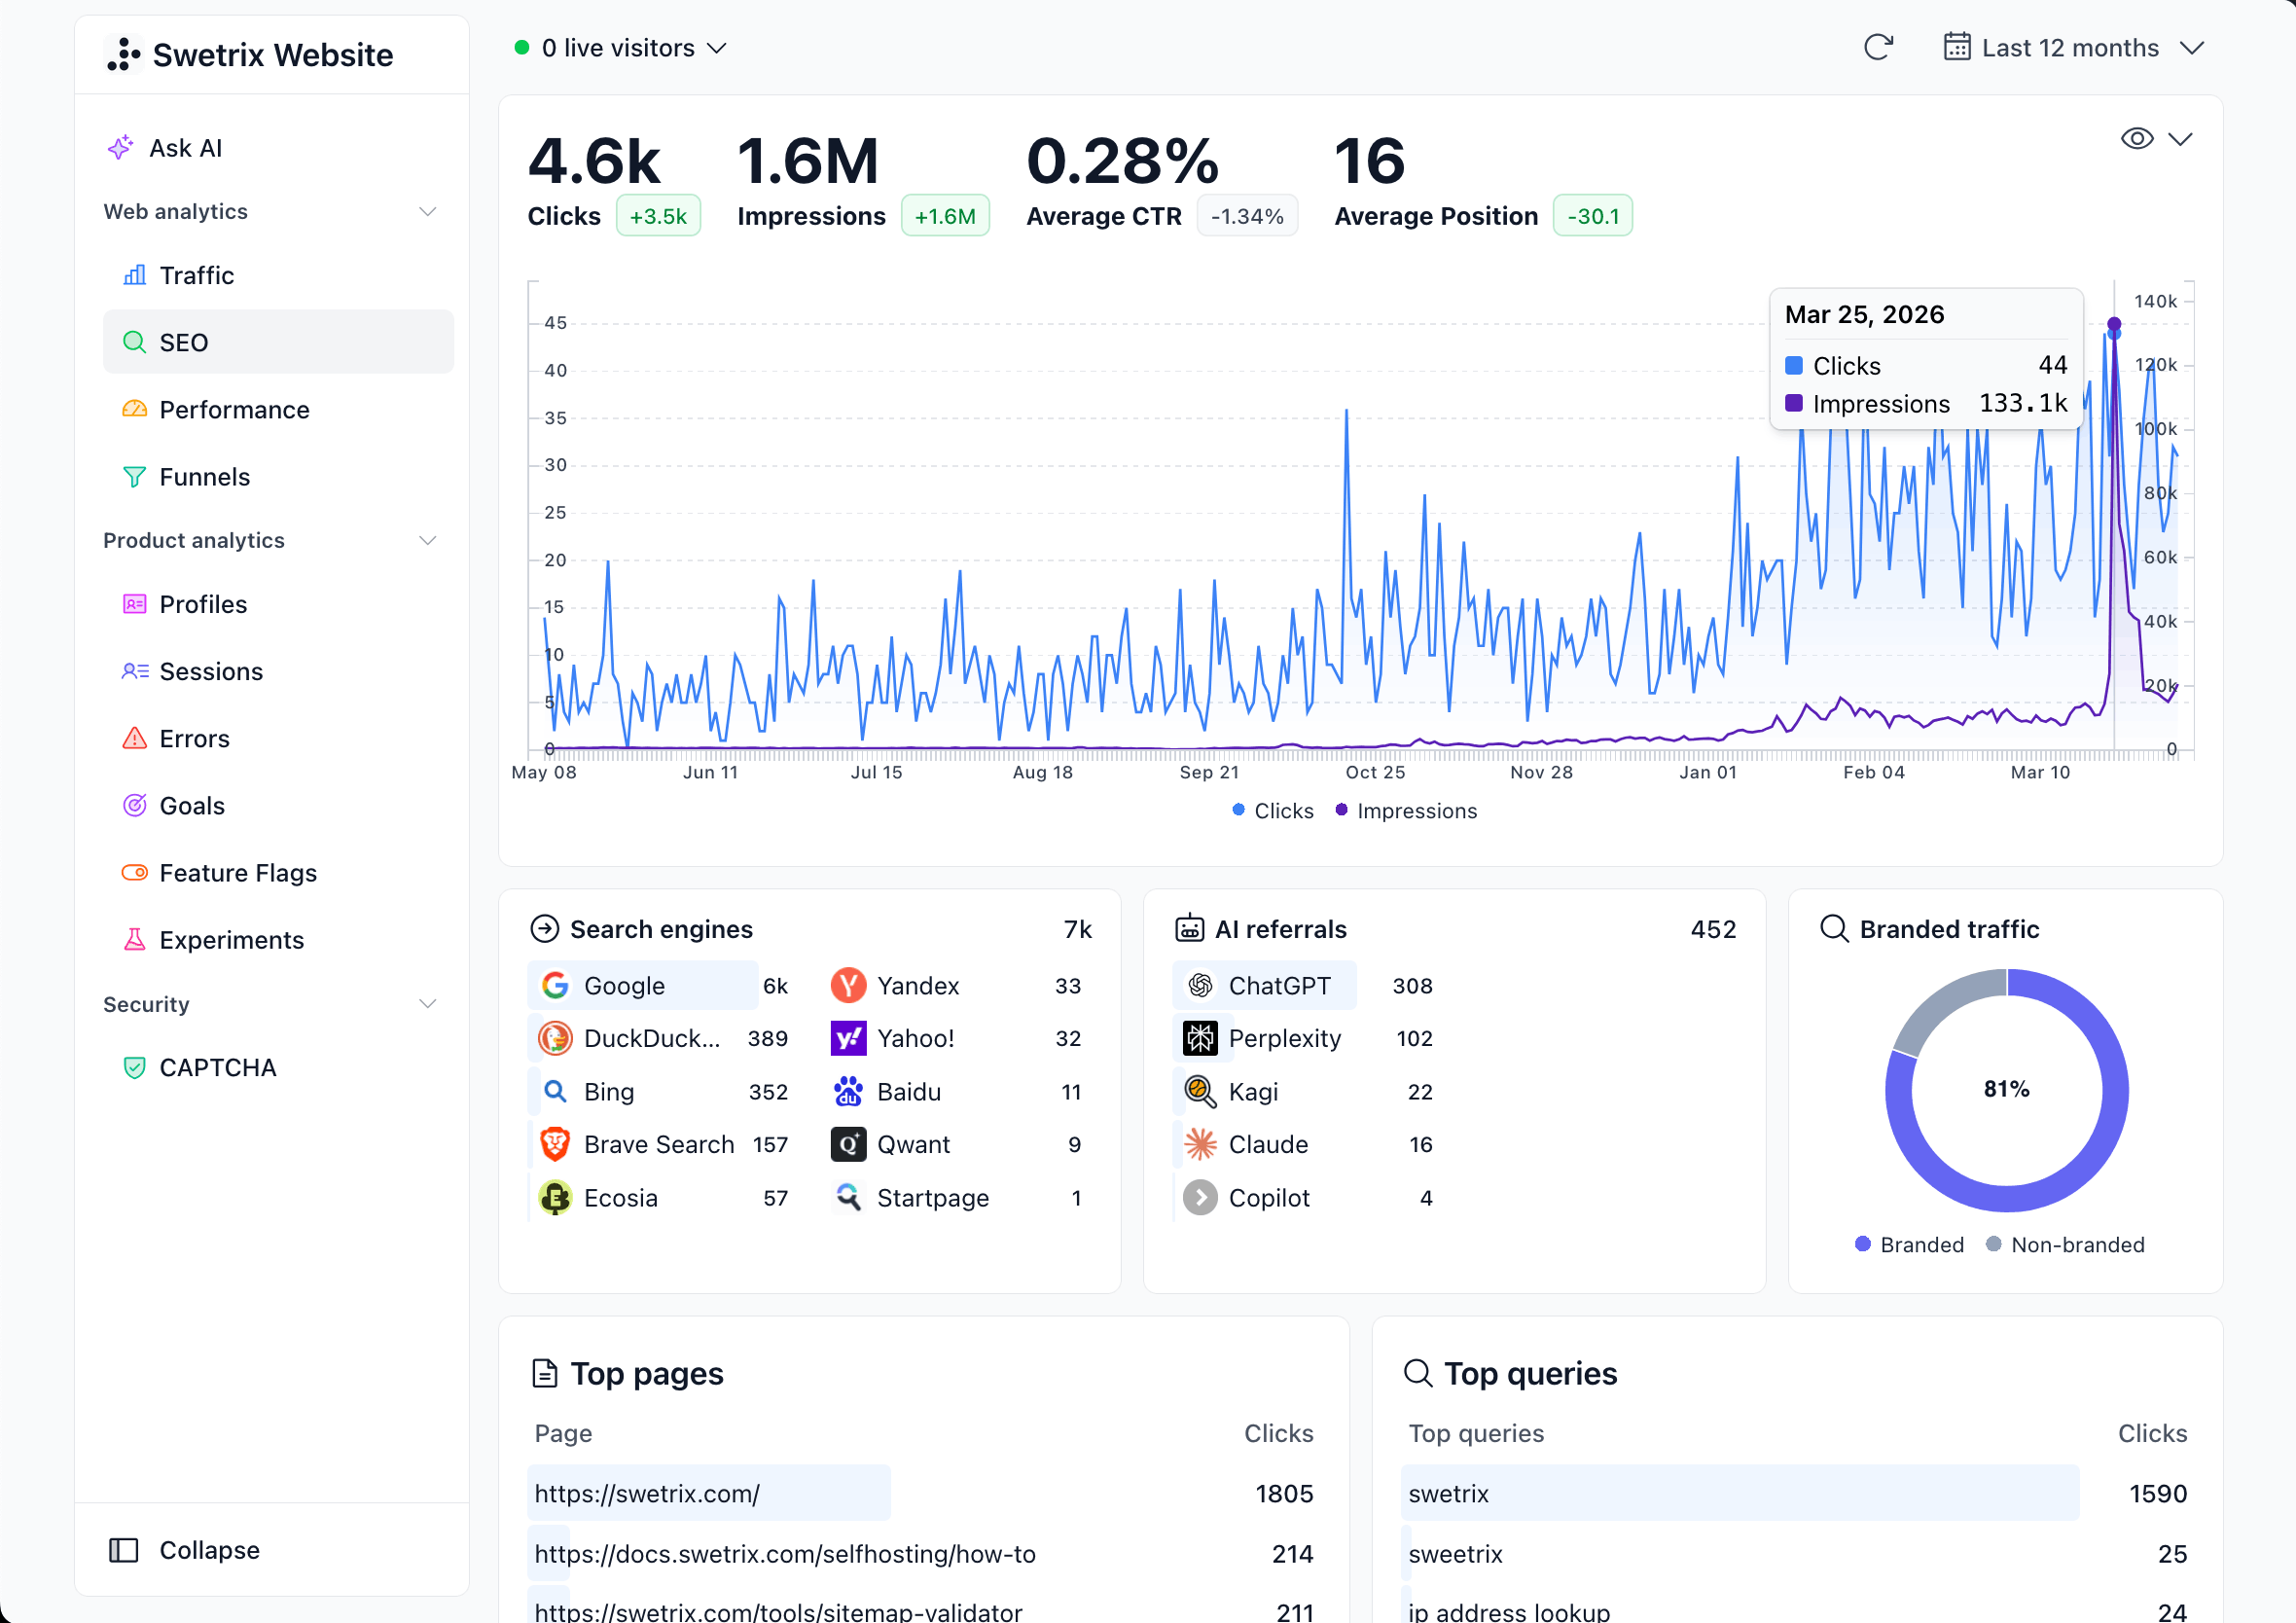
The SEO dashboard gives you a complete view of your website's search engine performance, powered by your Google Search Console integration. It combines GSC data with your referral analytics to show search queries, top pages, ranking positions, branded traffic, and optimisation opportunities — all in one place.
The SEO tab requires a connected Google Search Console account. If you haven't set this up yet, see how to connect Google Search Console.
Performance Overview
At the top of the SEO dashboard, four metric cards summarise your search performance for the selected period:
- Clicks — Total clicks from Google Search results to your site.
- Impressions — How many times your pages appeared in search results.
- Average CTR — The percentage of impressions that resulted in a click.
- Average Position — Your average ranking across all queries.
Each metric shows a comparison badge against the previous period, so you can quickly spot trends.
Trend Chart
Below the metrics, an area chart visualises your search performance over time. You can toggle which metrics are displayed using the visibility dropdown (eye icon):
- Clicks and Impressions (shown by default)
- Average Position
- Average CTR
When multiple metric types are shown together, the chart uses dual Y-axes for readability.
You can also enable Compare to previous period from the date selector to overlay the previous period on the trend chart and update the metric comparison badges.
Search Engines & AI Referrals
Two compact panels show your top traffic sources from search:
- Search Engines — A breakdown of search engine referrals (Google, Bing, DuckDuckGo, etc.) based on your Swetrix analytics data.
- AI Referrals — Traffic from AI-powered tools and assistants (ChatGPT, Perplexity, etc.) that link to your site.
These panels show the top 10 sources with percentage bars and visitor counts.
Branded Traffic
The branded traffic donut chart classifies your search queries into:
- Branded — Queries that contain your brand name or configured brand keywords (e.g., searching for "swetrix analytics").
- Non-branded — Generic queries where users found your site without searching for your brand (e.g., "privacy-friendly analytics").
This helps you understand how much of your search traffic depends on brand awareness versus organic discovery.
Configuring Brand Keywords
Swetrix automatically detects brand keywords from your project name and website URL. To customise them:
- Go to Settings > General.
- Find the Brand keywords field.
- Enter comma-separated keywords (e.g.,
swetrix, swetrix analytics).
Position Analytics
Two panels help you understand how your organic visibility is distributed across ranking positions:
- Impressions by Position — A bar chart that groups impressions by average position buckets: 1–3, 4–10, 11–20, and 21+. This shows whether most impressions come from high-ranking keywords or from queries that still have room to climb.
- Organic Positions — A cumulative chart showing how many ranking queries you have in each position range over time: 1–3, 4–10, 11–20, 21–50, and 51+. Use it to spot whether your keyword footprint is moving into stronger positions or drifting down.
Top Pages & Top Queries
Two detailed panels let you drill into your search data:
Top Pages
Shows which pages on your site receive the most clicks from search. Each page includes:
| Column | Description |
|---|---|
| Page | The URL path that appeared in search results |
| Clicks | Number of clicks from search |
| Impressions | Number of times the page appeared |
| CTR | Click-through rate for the page |
| Position | Average ranking position |
Top Queries
Shows the search terms users type into Google to find your site. Each query includes the same metrics as Top Pages (clicks, impressions, CTR, position).
Both panels support expanding to see the full list and can be sorted by any column.
SEO Quadrant
The SEO Quadrant is a scatter plot that visualises all your search queries by position (X-axis) and CTR (Y-axis). Bubble size reflects the number of impressions.
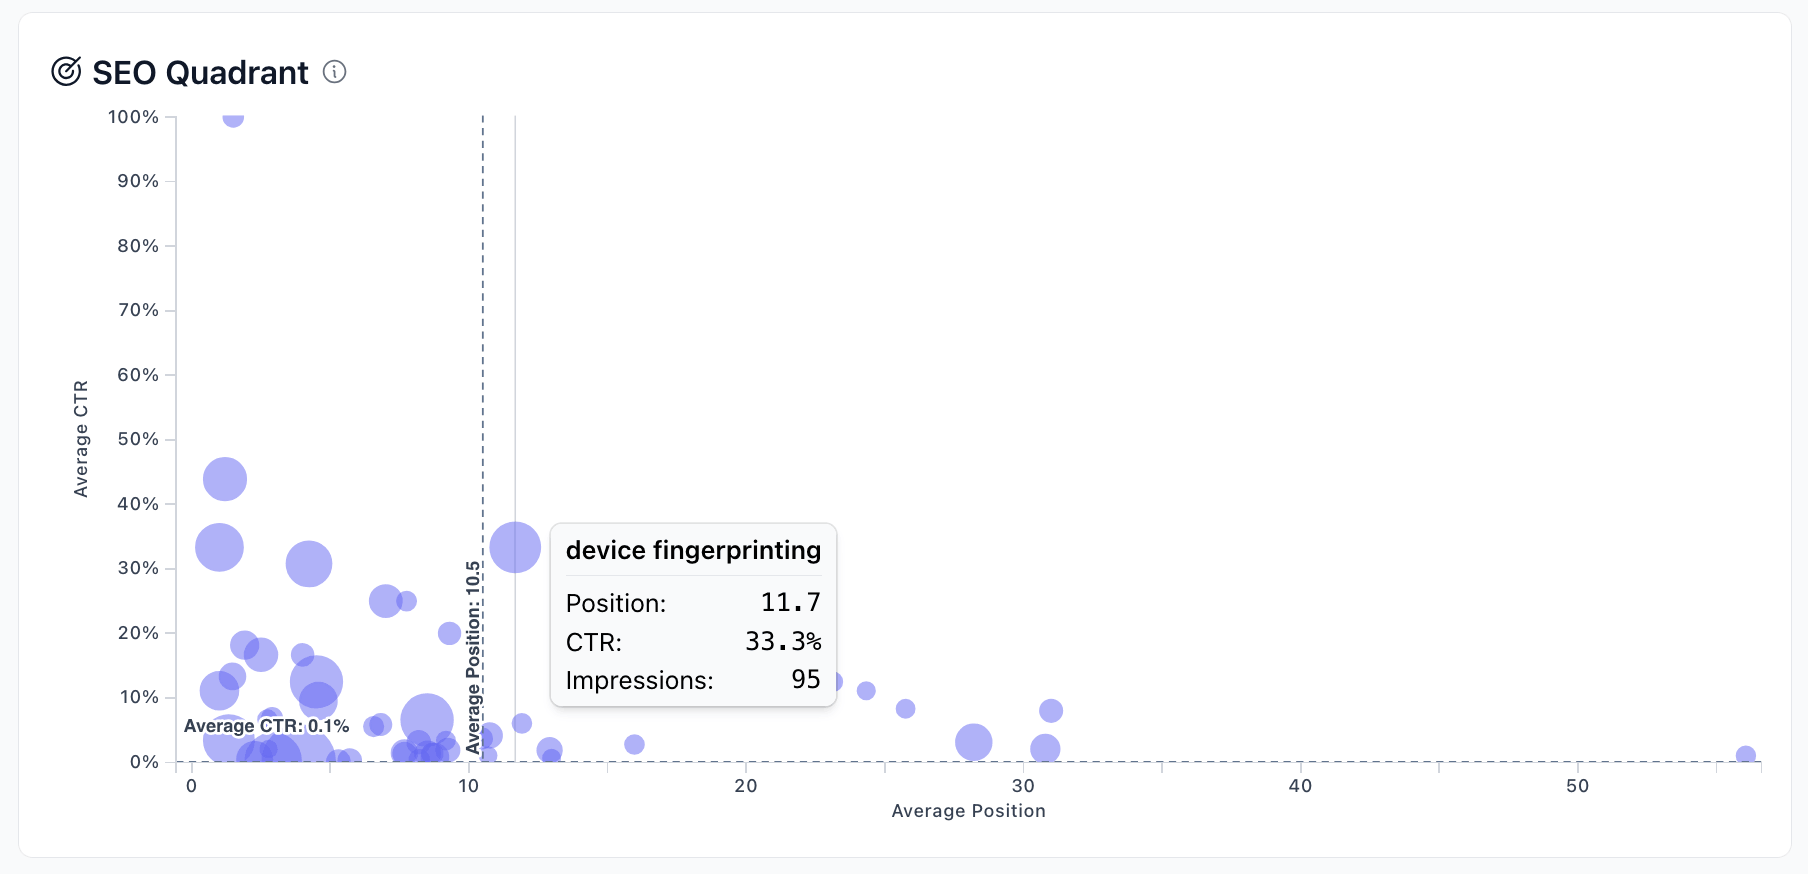
The chart is divided into four areas by your average position and average CTR lines:
| Quadrant | Meaning | Action |
|---|---|---|
| Top-left | High rank + high CTR | Your best performers — protect and maintain these |
| Bottom-left | High rank + low CTR | Improve your title tags and meta descriptions |
| Top-right | Low rank + high CTR | Boost these to page 1 for potentially big gains |
| Bottom-right | Low rank + low CTR | Lowest priority — improve content or reconsider targeting |
Hover over any bubble to see the exact query, position, CTR, and impression count.
Location & Devices
Two additional panels break down your search performance by:
- Location — Which countries your search clicks come from.
- Devices — Performance split by Desktop, Mobile, and Tablet.
Each includes the full set of GSC metrics (clicks, impressions, CTR, position).
Filters & Time Ranges
The SEO dashboard shares the same time range selector and filter system as the rest of your project dashboard. Note that some short periods (like "Today" or "Last hour") are not available for SEO data, as Google Search Console data has a processing delay of 1–2 days.
Help us improve Swetrix
Was this page helpful to you?