

Goals
Create Swetrix goals from pageviews or custom events and measure how often visitors complete the actions that matter to your website.
Goals allow you to track specific actions that visitors perform on your website. They help you measure how well your site fulfils your target objectives.
Overview
A Goal in Swetrix represents a desired outcome, such as a visitor signing up for a newsletter, downloading a file, or reaching a "Thank You" page after a purchase. By defining goals, you can see conversion rates and trends for these critical actions directly in your dashboard.
Swetrix supports simple goals and multi-condition goals:
- Simple Pageview: Triggered when a visitor visits a specific page URL.
- Simple Custom Event: Triggered when a specific custom event is sent from your website.
- Multi-condition: Triggered when a session matches several pageview, custom event, campaign, referrer, device, browser, country, or metadata conditions.
Sending custom events
Pageview goals work out of the box, but to track a custom event goal you first need to send that event from your website using the track() function of our tracking script.
For example, to track clicks on a signup button:
<button onclick="swetrix.track({ ev: 'Signup click' })">Sign up</button>Or, if you use the npm package:
import { track } from "swetrix";

track({ ev: "Signup click" });
The event name can be anything you like (up to 256 characters, spaces are fine) — just make sure it does not contain any personally identifiable information. Once the event is sent, it will show up in the Custom events panel of your traffic dashboard, and you can reference it by name when creating a goal.
You can also attach extra context to an event via the meta parameter (e.g. { location: 'footer' }) and filter on it later with the goal's metadata filters. See the tracking script reference for all available options, or the Events API if you want to send events from a backend without the tracking script.
Creating a Goal
To create a new goal:
- Navigate to the Goals tab in your project dashboard.
- Click the Add Goal button.
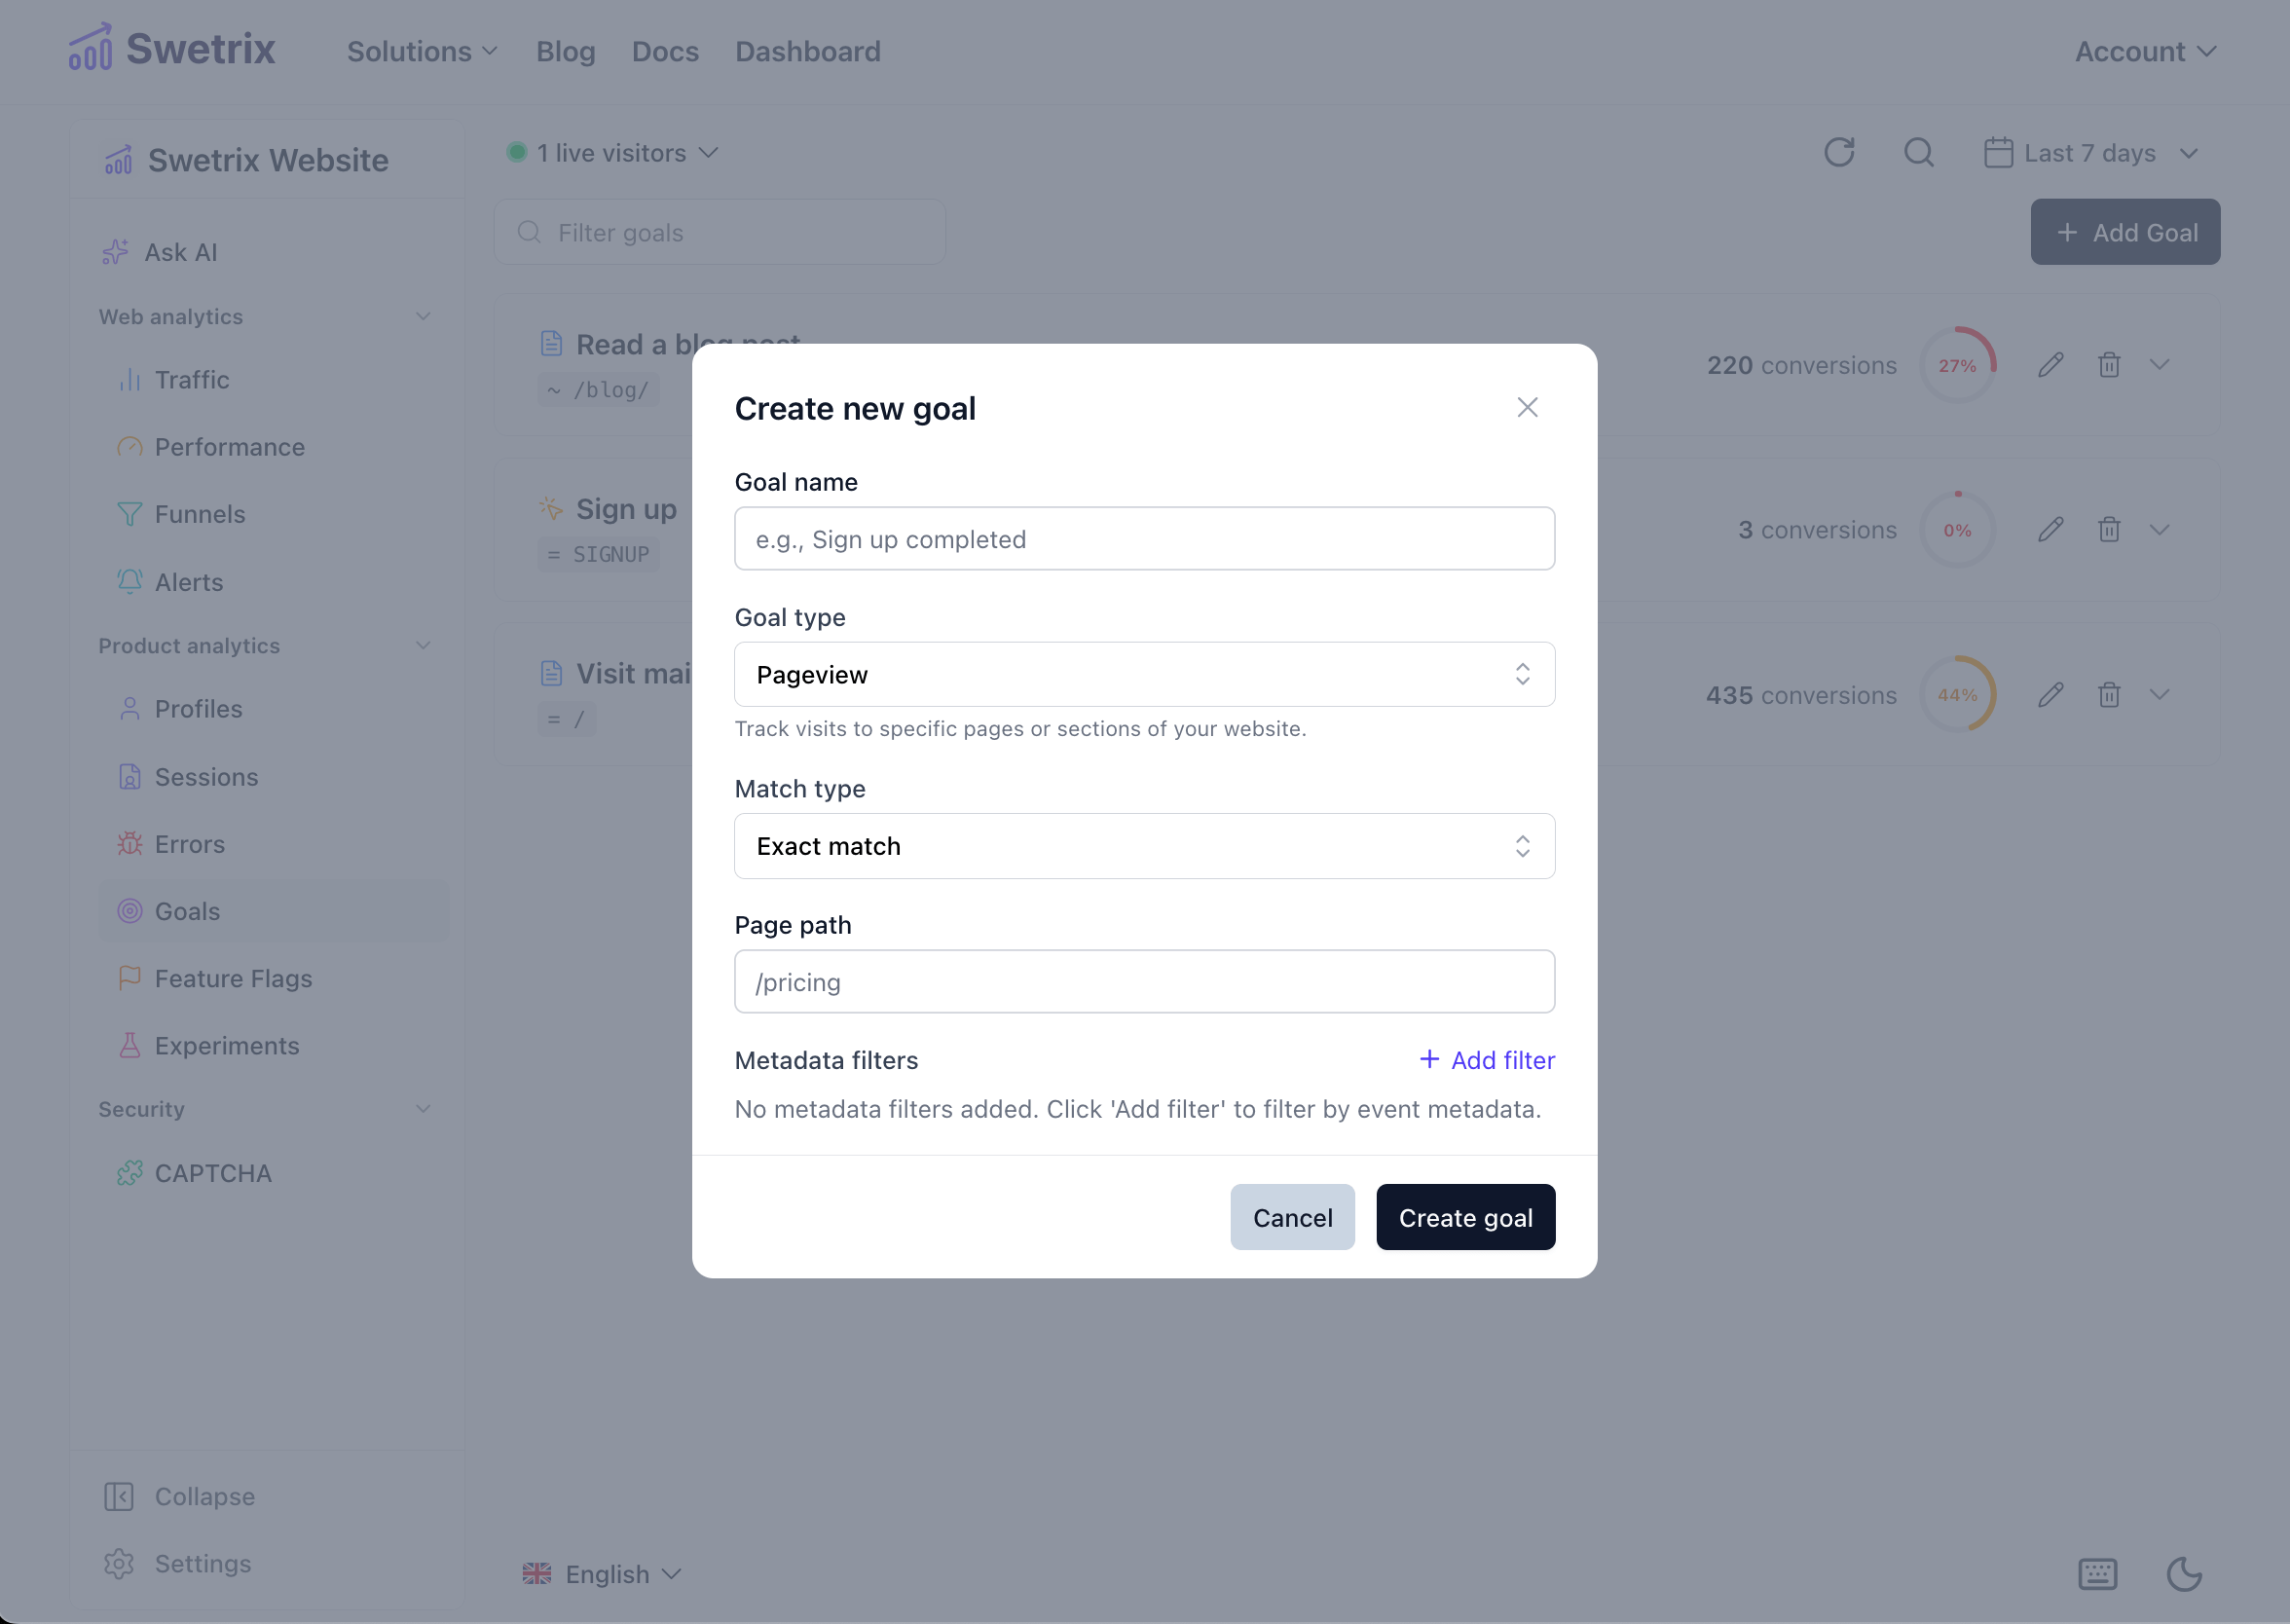
- Fill in the goal details in the modal window.
Goal Settings
| Setting | Description |
|---|---|
| Name | A friendly name for your goal (e.g., "Newsletter Signup"). |
| Type | Choose Pageview to track page visits or Custom Event to track specific interactions. |
| Match Type | Exact match: The value must match exactly. Contains: The value must contain the specified string. |
| Value | For Pageview: The path of the page (e.g., /pricing or /thank-you).For Custom Event: The name of the event (e.g., signup_completed). |
| Metadata Filters | (Optional) Add specific conditions based on event metadata. For example, track only signups where plan equals pro. You can add multiple key-value pairs. |
Multi-condition Goals
Use a multi-condition goal when one URL or event name is not enough to define the conversion. Conditions can be matched with AND or OR logic. For example, you can count sessions where a visitor viewed /pricing, arrived from a specific campaign, and then fired a signup_completed event.
The condition editor uses the same selectors as dashboard filters, so common values such as pages, browsers, devices, countries, sources, campaigns, and UTM fields can be selected from existing analytics values or typed manually.
Managing Goals
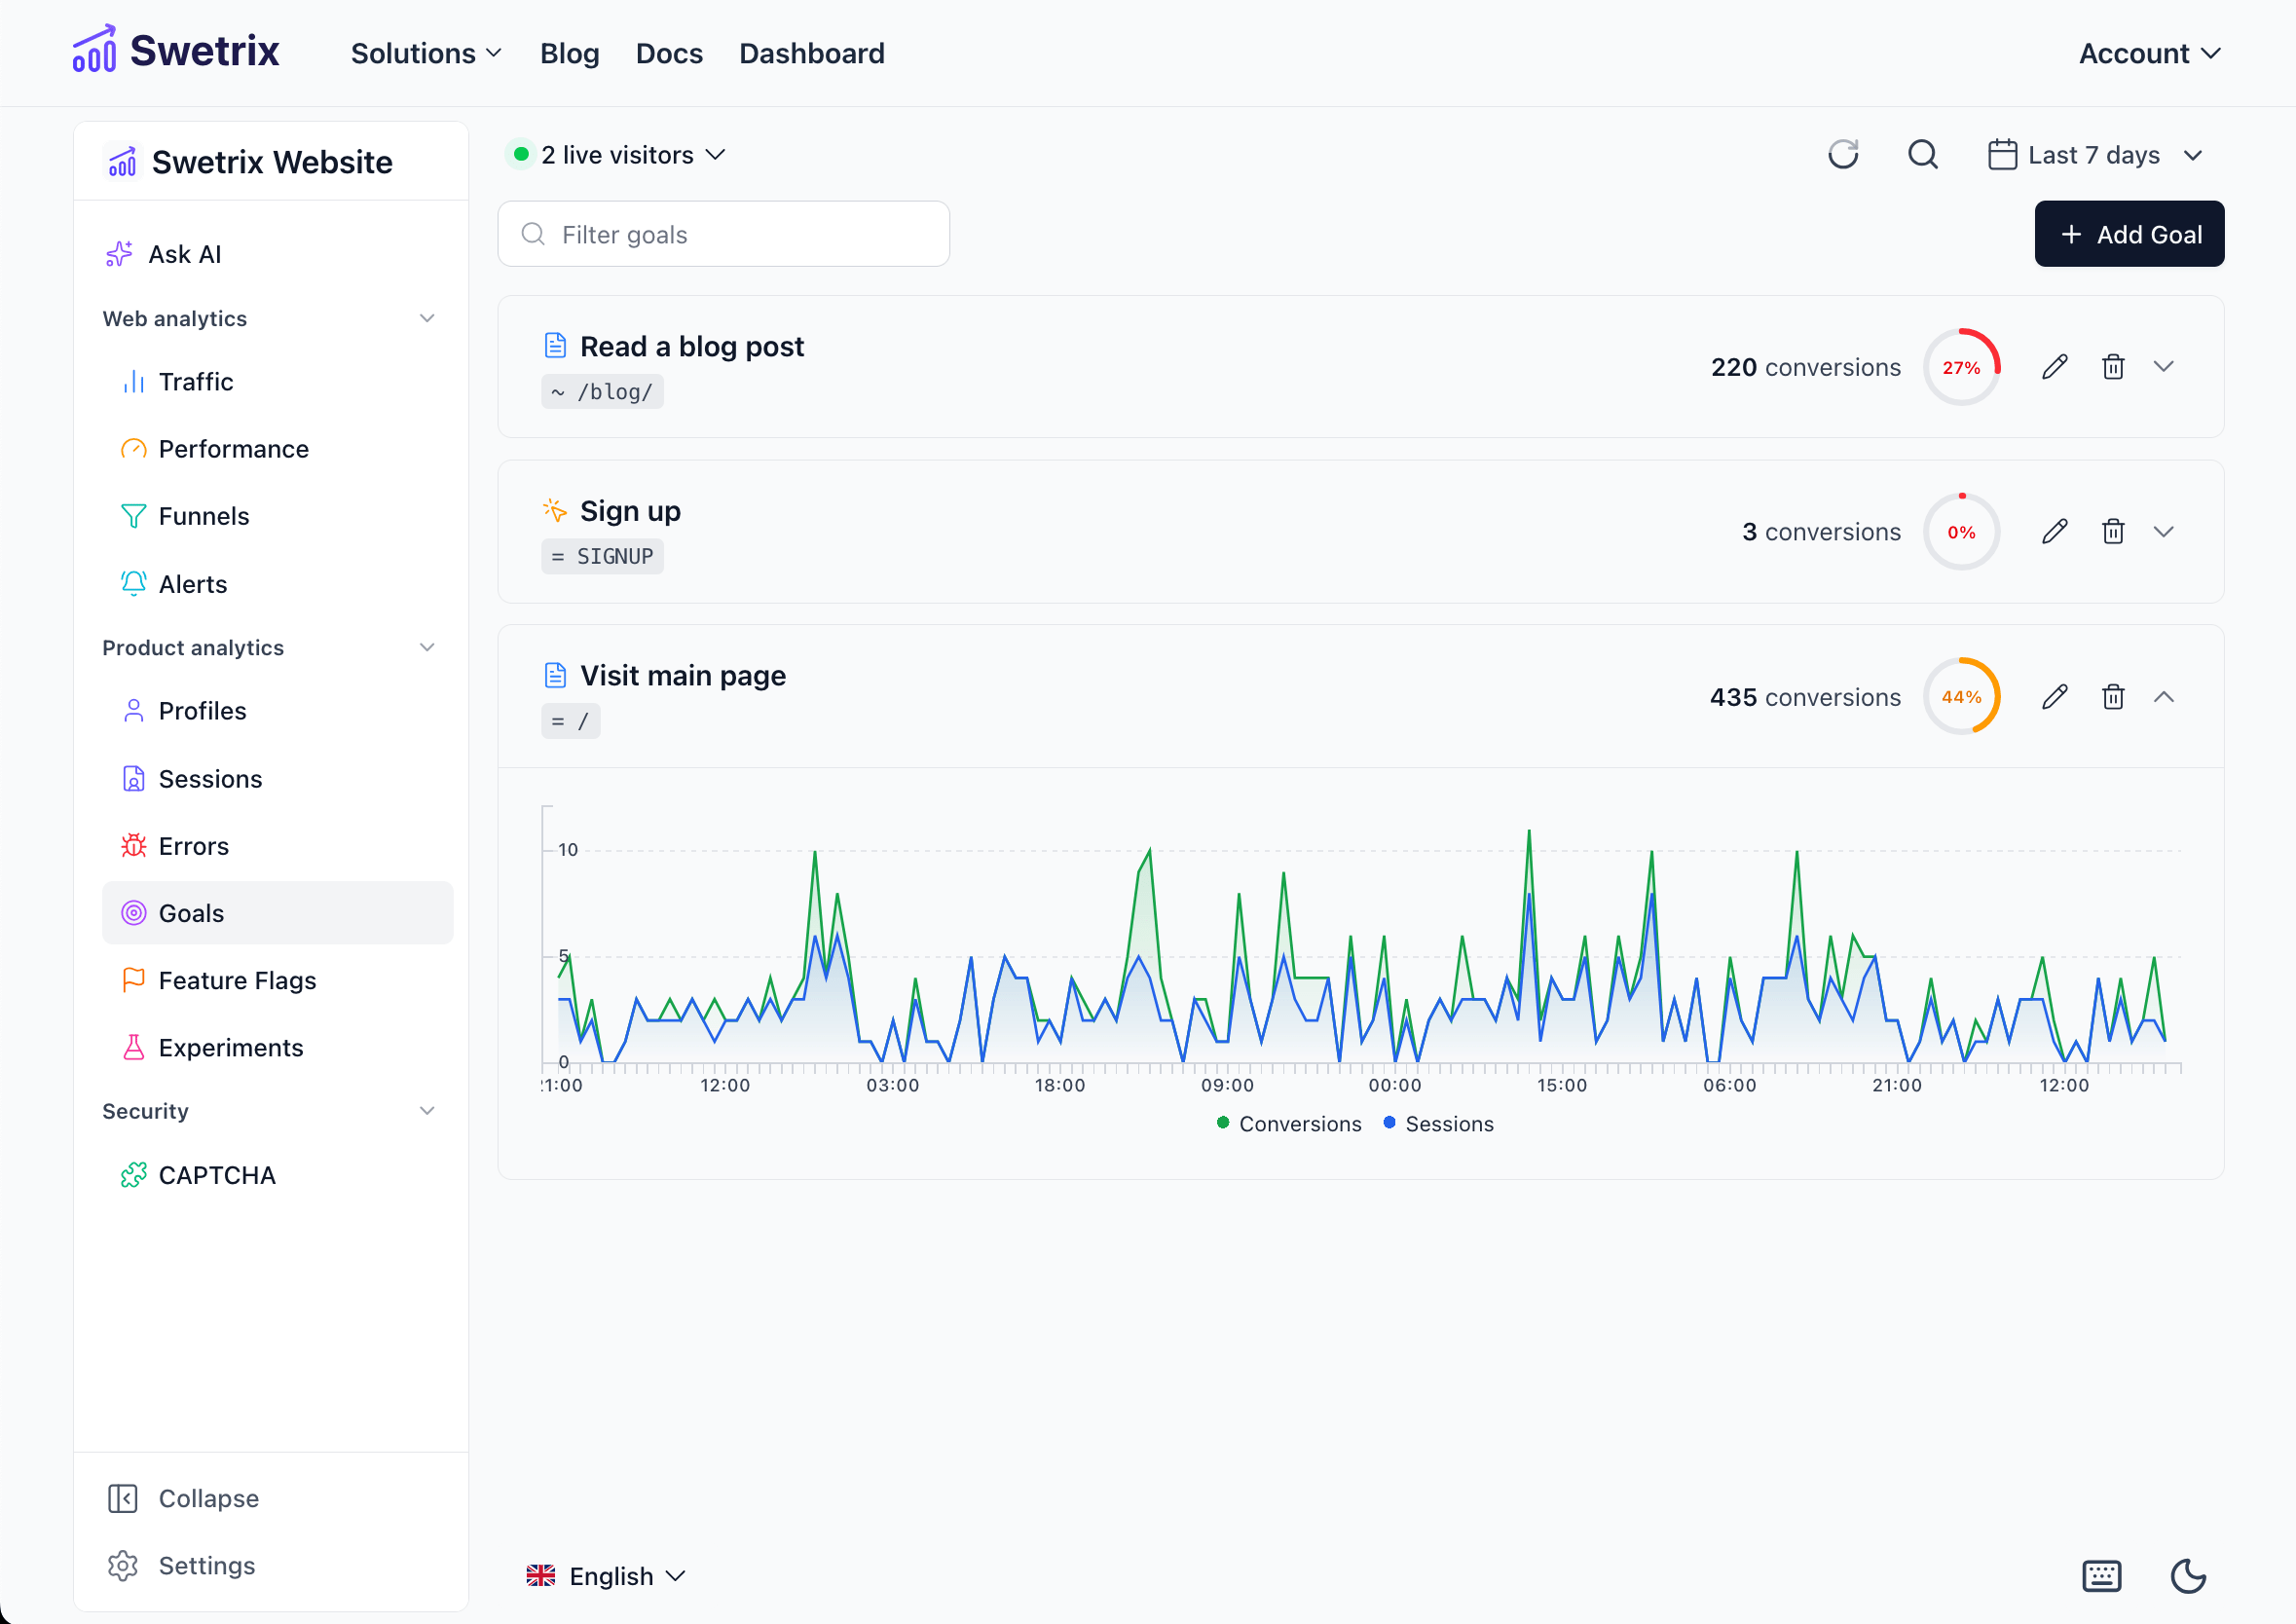
Once created, your goals will appear in a list on the Goals tab.
- Search: Use the search bar to filter goals by name.
- Edit: Click the pencil icon to modify a goal's settings.
- Delete: Click the trash icon to remove a goal.
Analyzing Goal Data
Each goal in the list displays a quick summary of its performance for the selected time period.
Summary Cards
- Conversions: The total number of times the goal was completed.
- Conversion Rate: The percentage of unique sessions that completed the goal. Calculated as:
(Unique Visitors who completed goal / Total Unique Visitors) * 100.
Detailed Chart
Click on any goal in the list to expand it and view a detailed performance chart.
The expanded view also shows time-to-convert metrics where enough data exists, including median conversion time from the session start and from the first page.
The chart visualises two metrics over time:
- Conversions (Green): The volume of goal completions.
- Sessions (Blue): The number of unique sessions that contributed to these conversions.
This visualisation helps you identify trends, such as which days or times generate the most conversions.
You can click on any data point on a goal chart to open the sessions that matched that goal during the selected timeframe. This lets you inspect the visitors and session journeys behind a conversion spike or drop.
Help us improve Swetrix
Was this page helpful to you?