Data Import
Import historical analytics data from third-party platforms into Swetrix
Data Import
Swetrix allows you to import historical analytics data from other platforms so you can switch without losing your history. Imported data appears alongside your live-tracked data in dashboards, charts, and reports. It's tagged internally so it can be identified and, if needed, removed later without affecting your live-tracked data.
Import Instructions
Select your analytics provider below to see the step-by-step import guide.
Unlike file-based imports, GA4 import works by connecting your Google account directly. Swetrix uses the GA4 Data API to pull your historical analytics data automatically.
GA4 imports use aggregated data from Google's API. Some dimensions like language and browser/OS versions are not available due to API limitations. Data is imported with hourly precision.
Connect Your Google Account
- Go to your project's Settings page in Swetrix
- Click the Import data tab
- Click the Google Analytics 4 provider card
- Click Connect Google Account
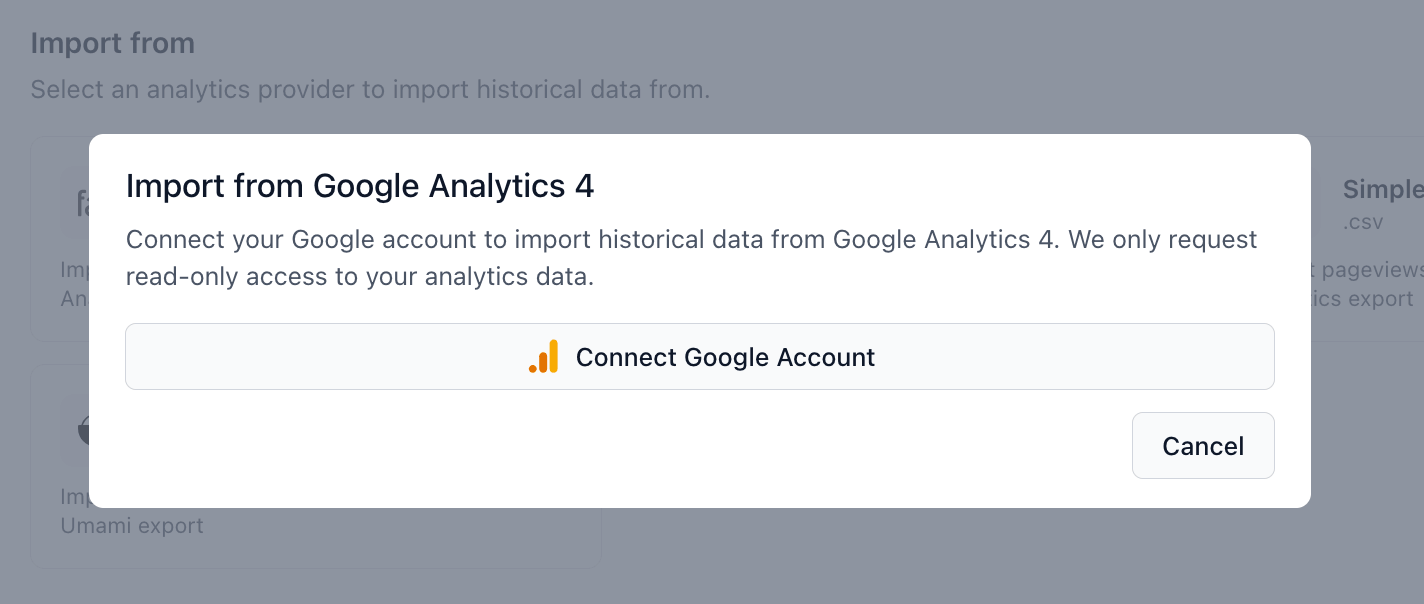
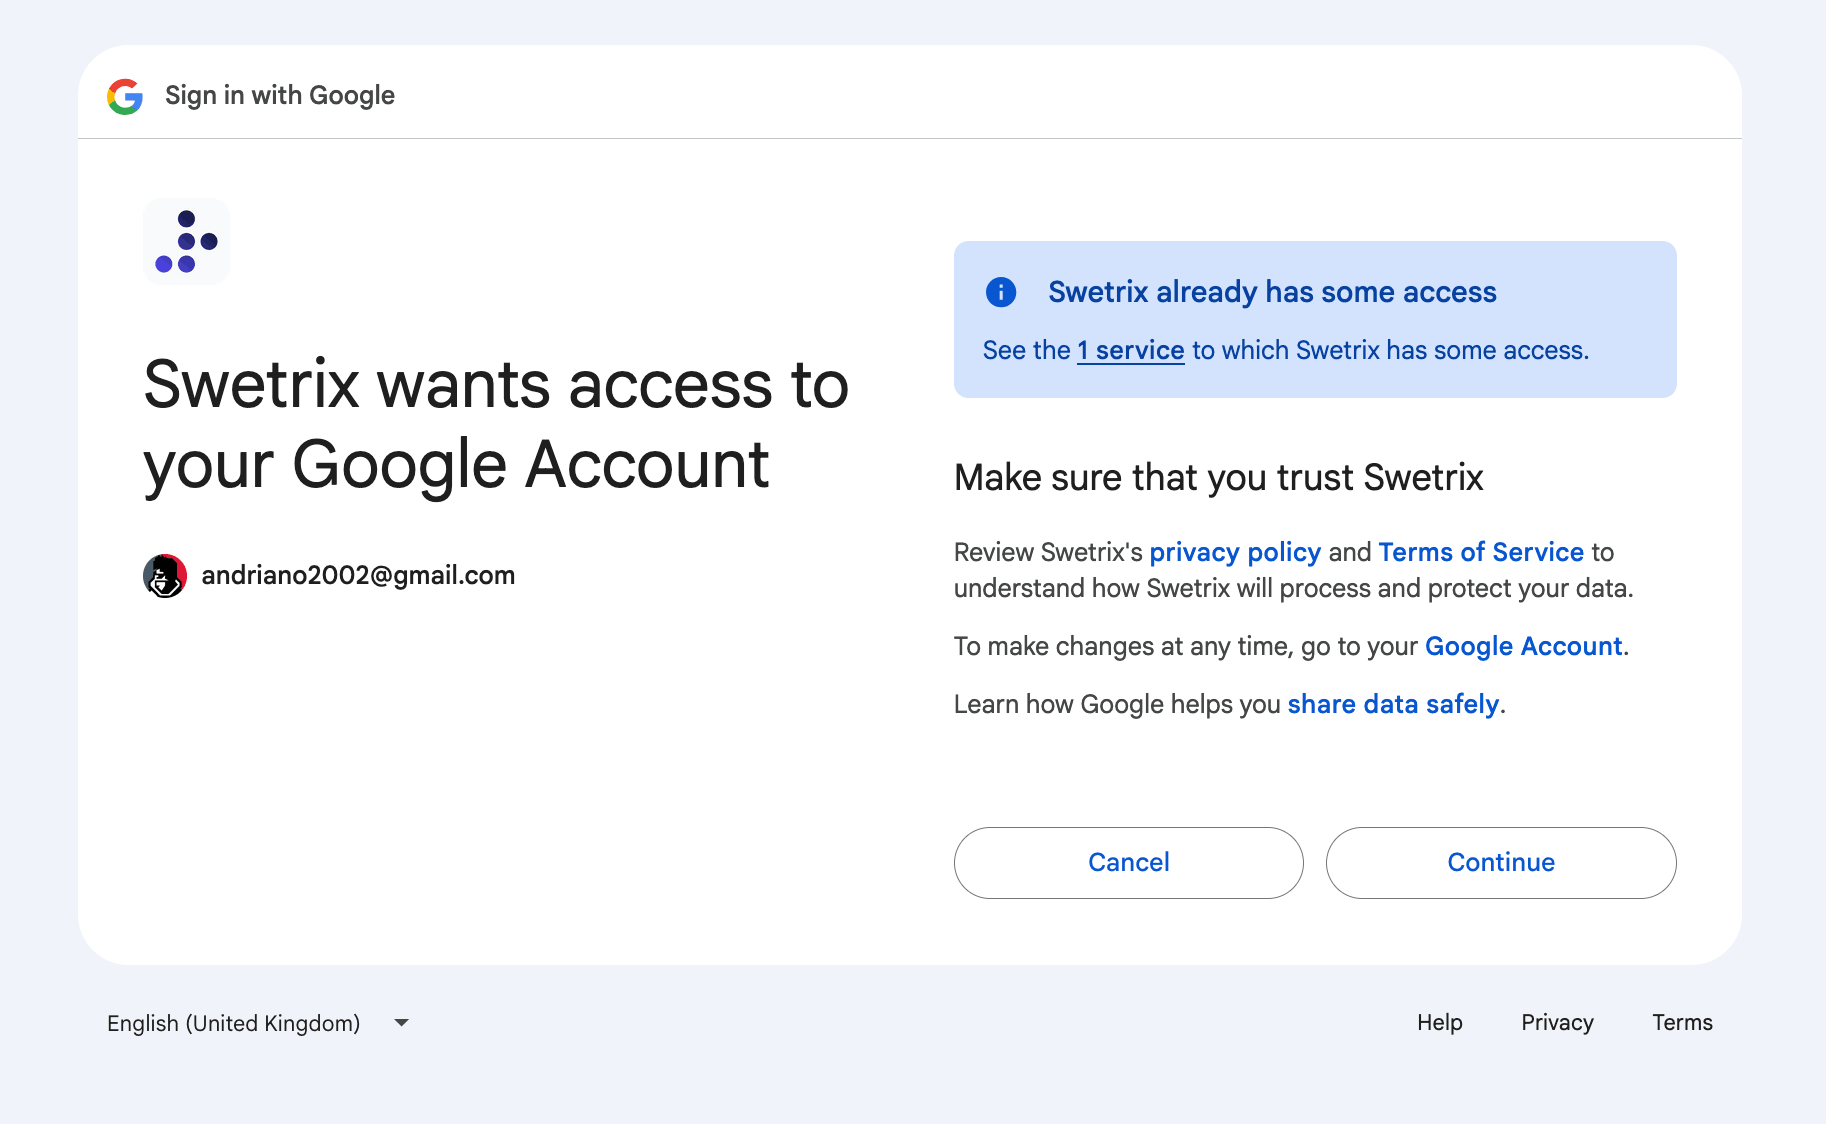
- You'll be redirected to Google's sign-in page. Sign in and grant Swetrix read-only access to your analytics data
Select a GA4 Property
After connecting, you'll be redirected back to Swetrix. A dropdown will show all GA4 properties accessible from your Google account.
- Select the GA4 property you want to import data from
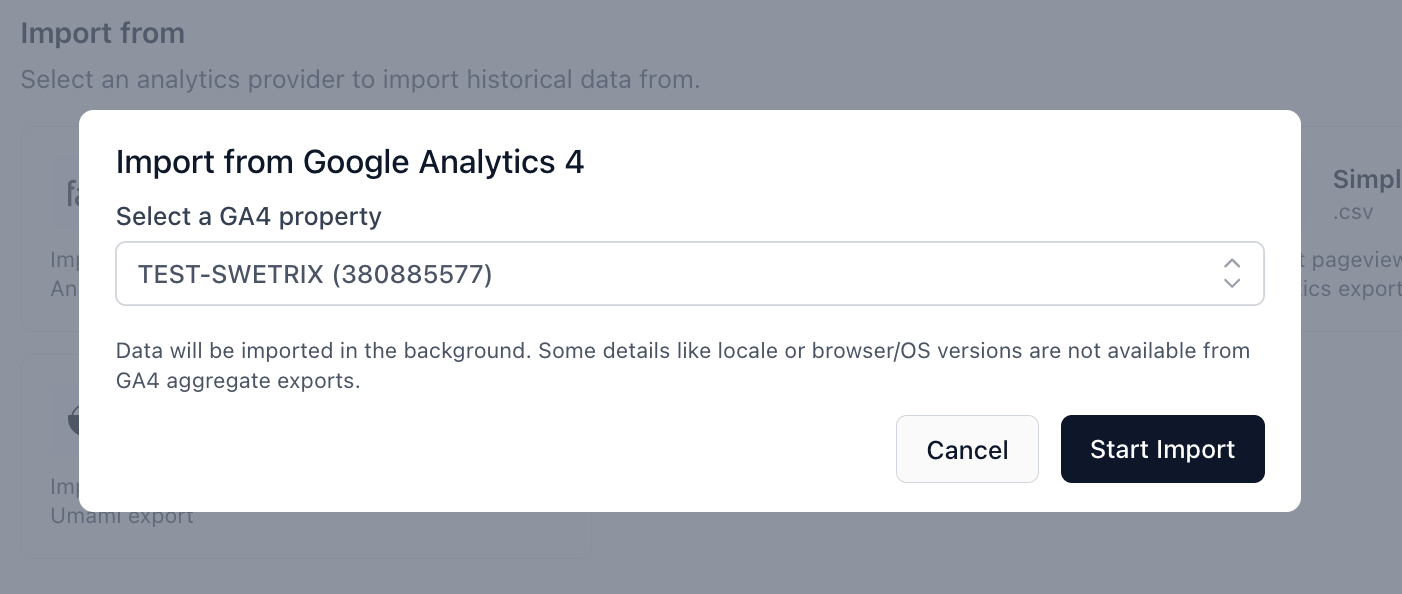
- Click Start Import
Monitor Progress
After starting the import, it will appear in the Import history table below the provider cards. You can see:
- Status — Pending, Processing, Completed, or Failed
- Date range — The time span of the imported data
- Rows — How many analytics events were imported
The import fetches data from the GA4 API in monthly chunks. For properties with a lot of historical data, this may take several minutes. The page auto-refreshes while an import is processing.
What data is imported?
The following dimensions are imported for pageviews:
- Date and hour
- Hostname and page path
- Device category (desktop, mobile, tablet)
- Browser and operating system
- Country, region, and city
- Traffic source, medium, campaign, term, and content (UTM parameters)
Source and UTM data is enriched from a separate report and matched by page and hour. For pages with traffic from multiple sources in the same hour, the most common source is used.
For custom events, we import all non-standard GA4 events (excluding built-in events like page_view, session_start, first_visit, etc.) with device, browser, OS, country, and page dimensions.
What's not imported?
- Language / locale is not included (GA4 API dimension limit)
- Browser and OS versions are not available from GA4 aggregate reports
- Session duration cannot be reconstructed from aggregated data
- Unique visitors may differ from GA4 numbers due to day-level aggregation
Export Your Data from Umami
- Log in to your Umami instance
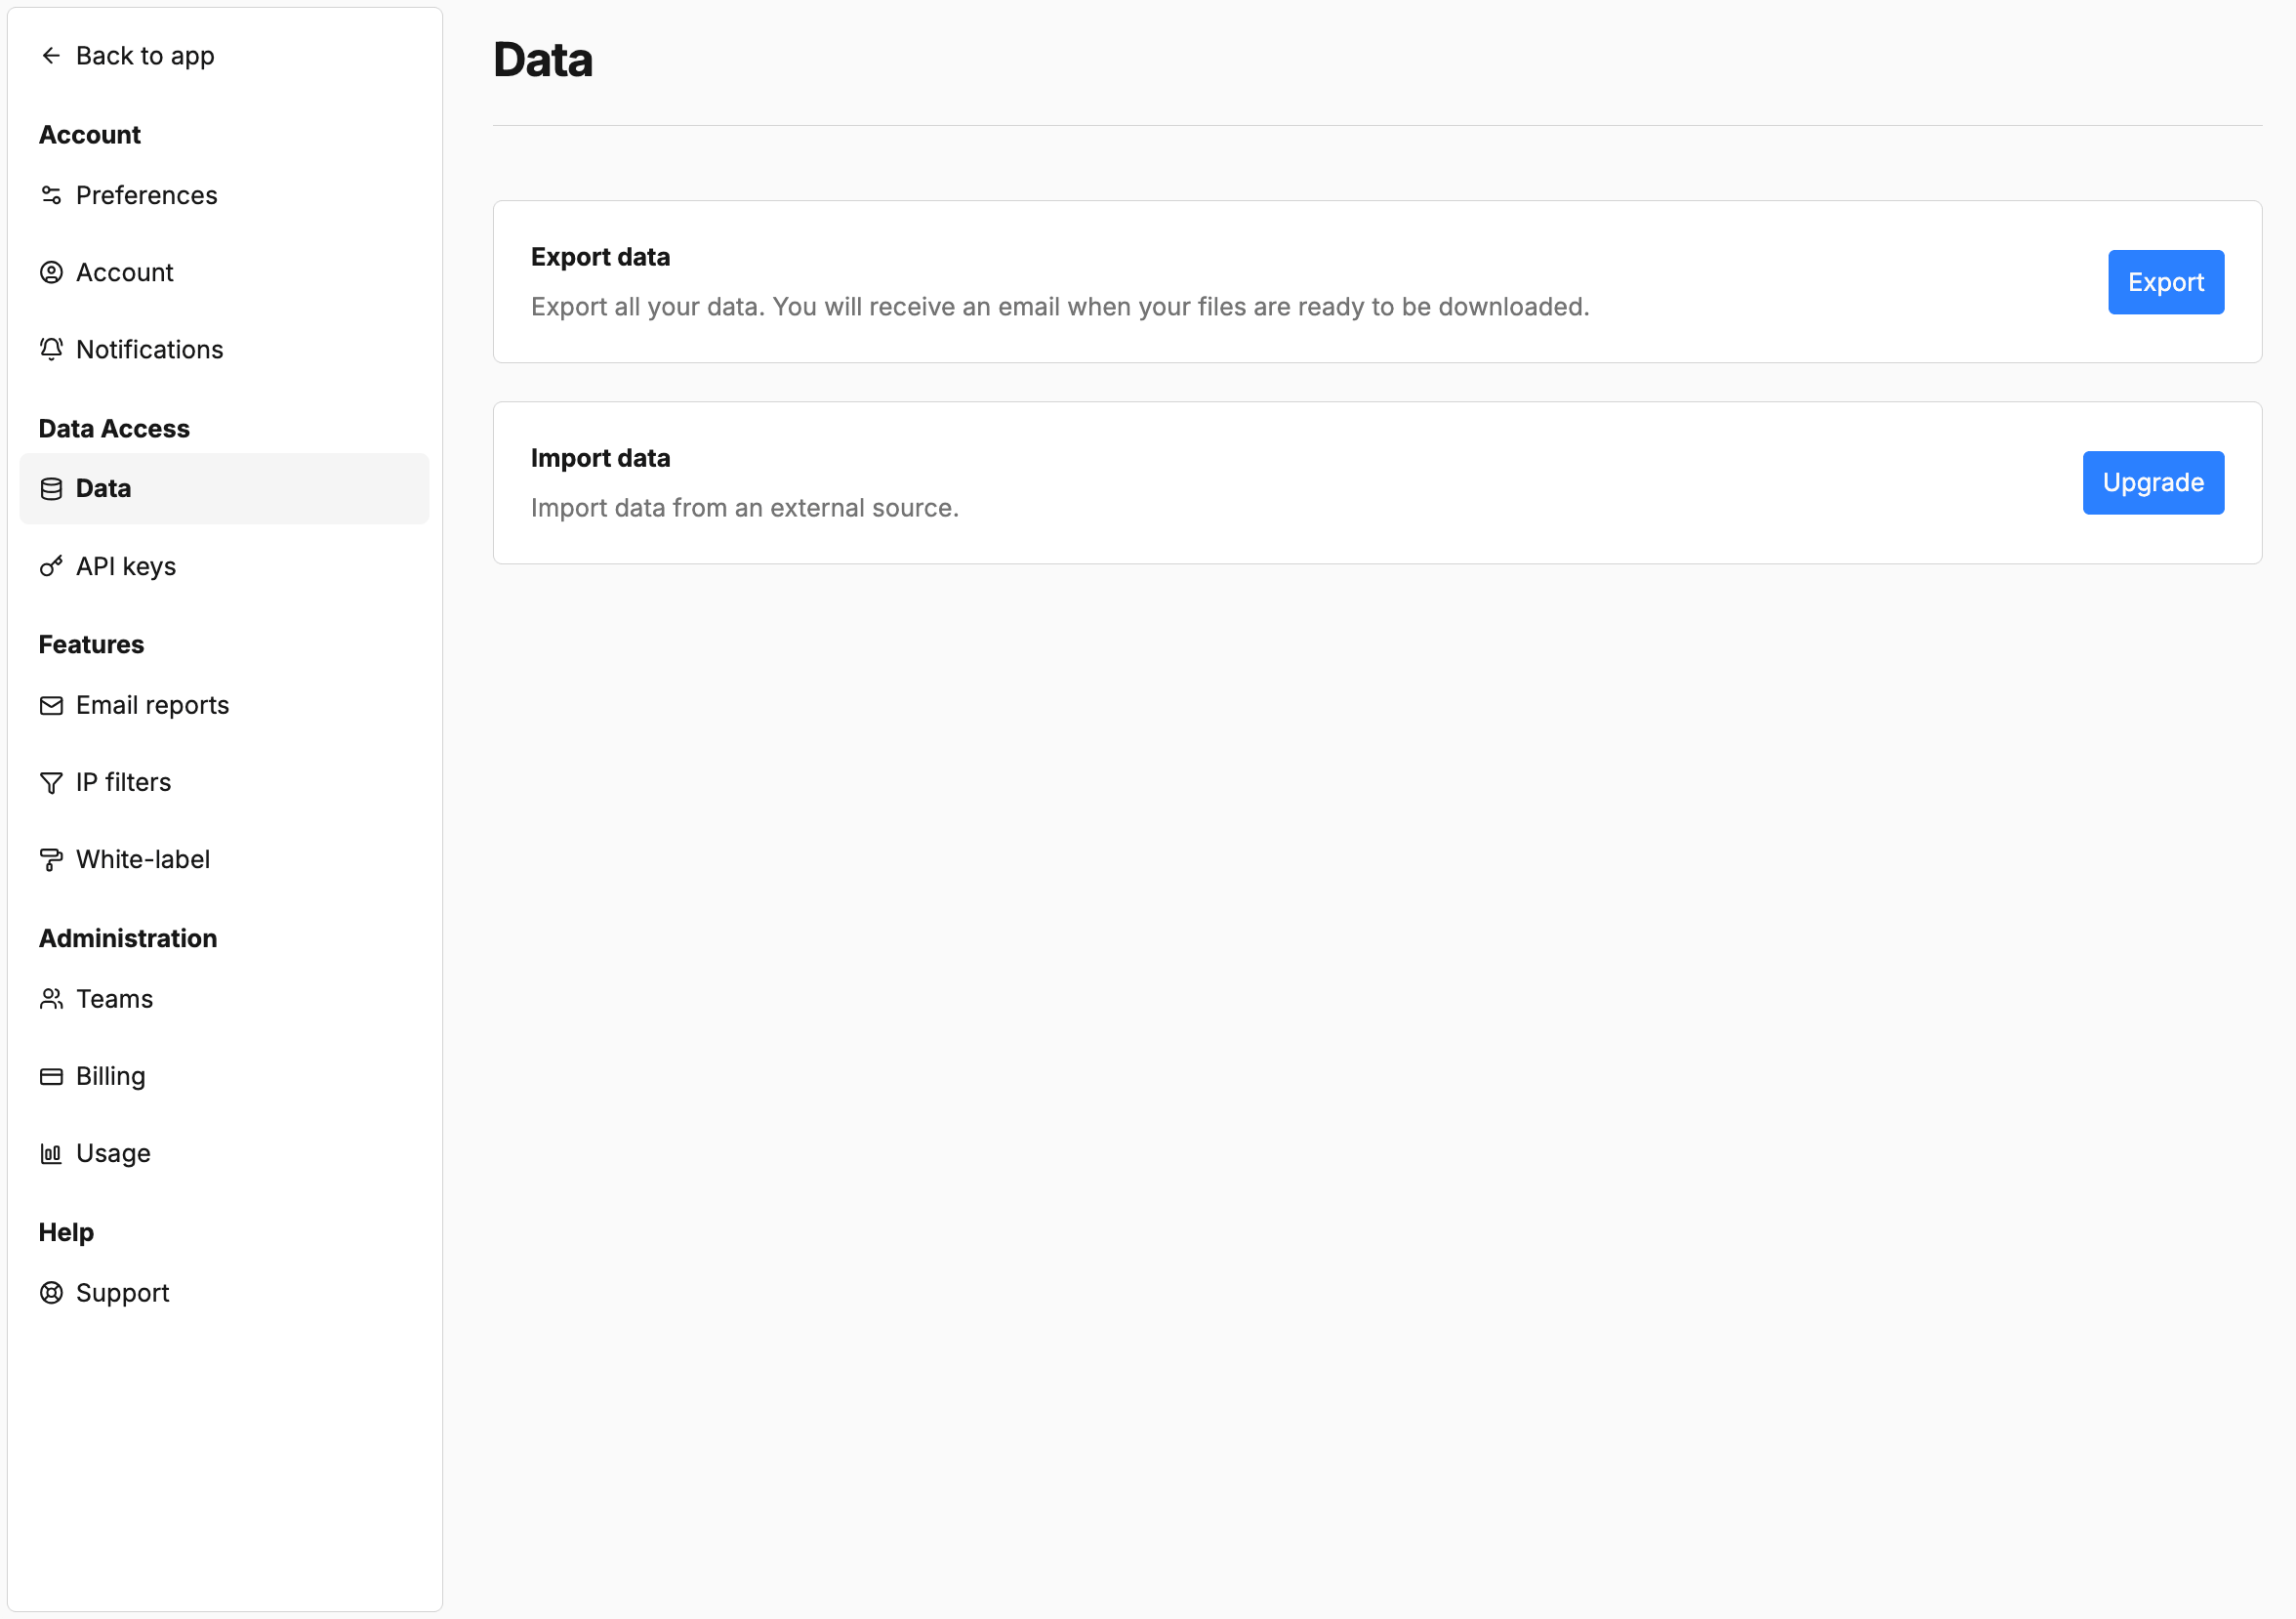
- Go to Settings → Data
- Click on the export button
- Select a website you want to export and a date range, then click export - Umami will email you a ZIP file with the exported data
You can learn more on how to export your data from Umami on their data export documentation.
Import into Swetrix
- Go to your project's Settings page in Swetrix
- Click the Import data tab
- Click the Umami provider card
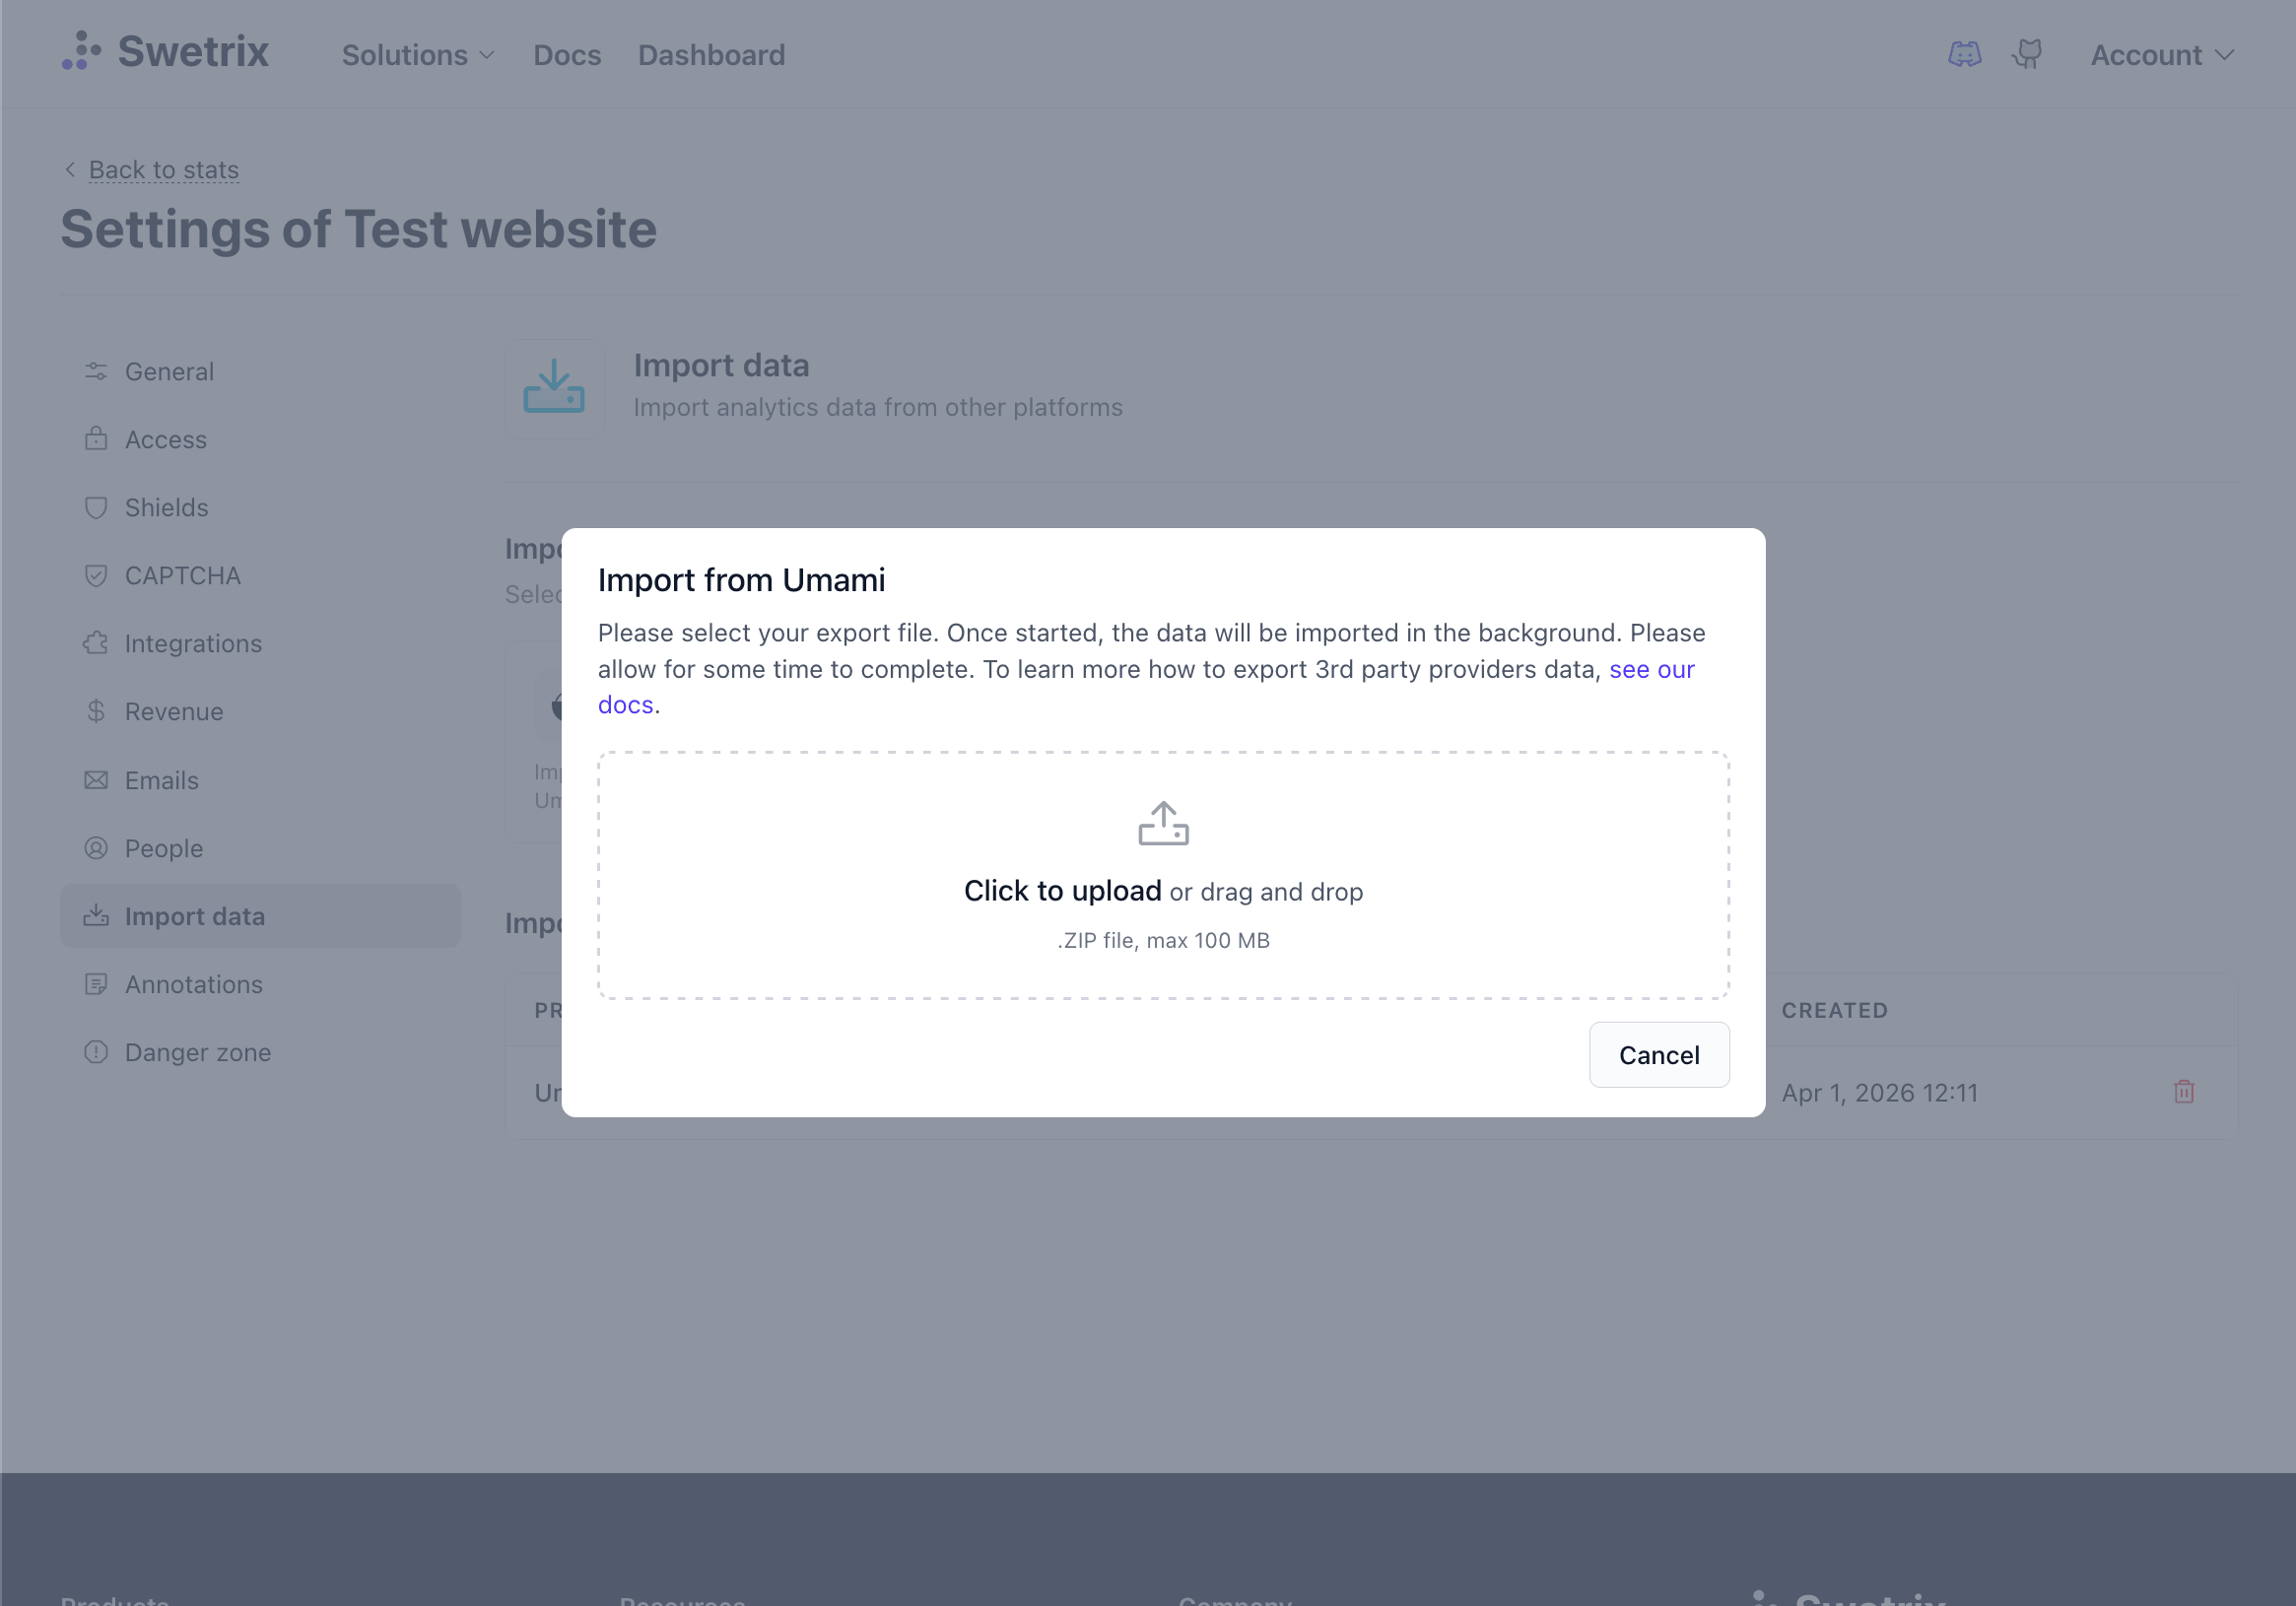
- In the upload modal, either drag and drop the
.zipfile or click to browse - Wait for the upload and processing to complete
.zip file from Umami directly - do not extract it first.Monitor Progress
After uploading, the import will appear in the Import history table below the provider cards. You can see:
- Status — Pending, Processing, Completed, or Failed
- Date range — The time span of the imported data
- Rows — How many analytics events were imported
The page auto-refreshes while an import is processing. You can navigate away and come back later.
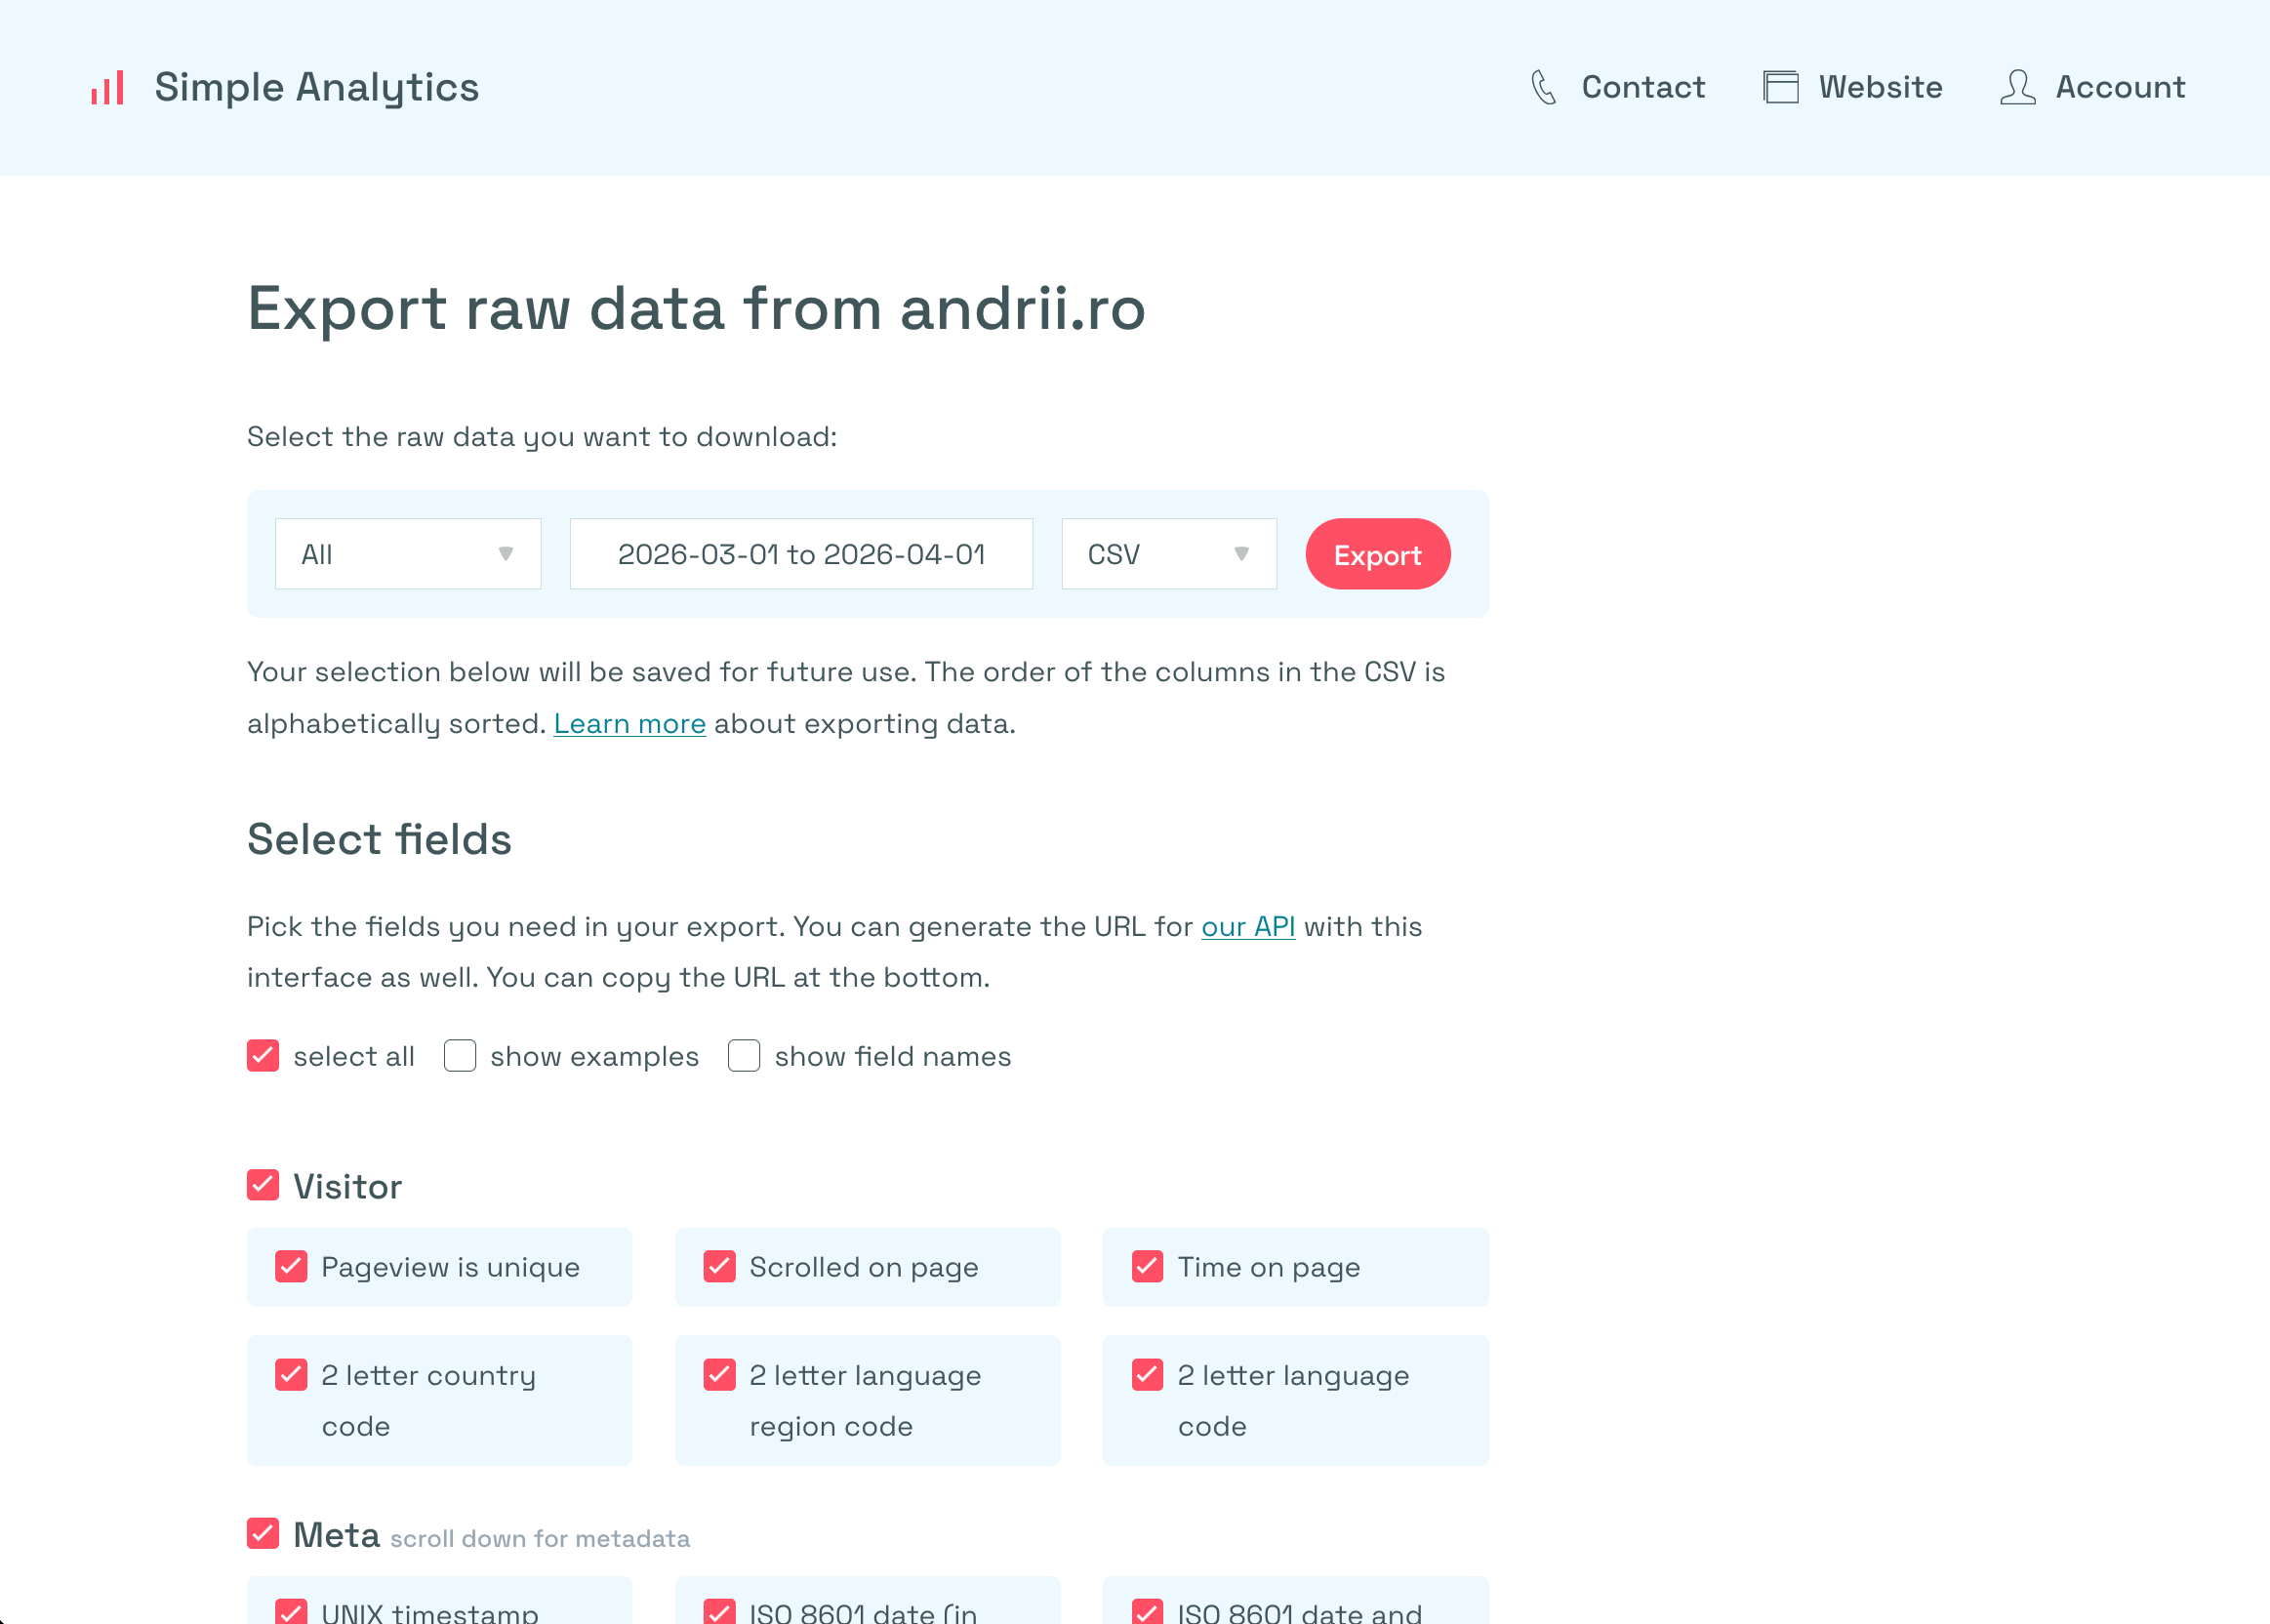
Export Your Data from Simple Analytics
- Log in to your Simple Analytics dashboard and go to their Export data page
- Under the Select the raw data you want to download section, select All option to include both pageviews and events and the export time period. For type, choose CSV.
- Under the Select fields section, choose the select all option to include all fields.
- Click the Export button to download a
.csvfile
You can learn more on how to export your data from Simple Analytics on their export documentation.
Import into Swetrix
- Go to your project's Settings page in Swetrix
- Click the Import data tab
- Click the Simple Analytics provider card
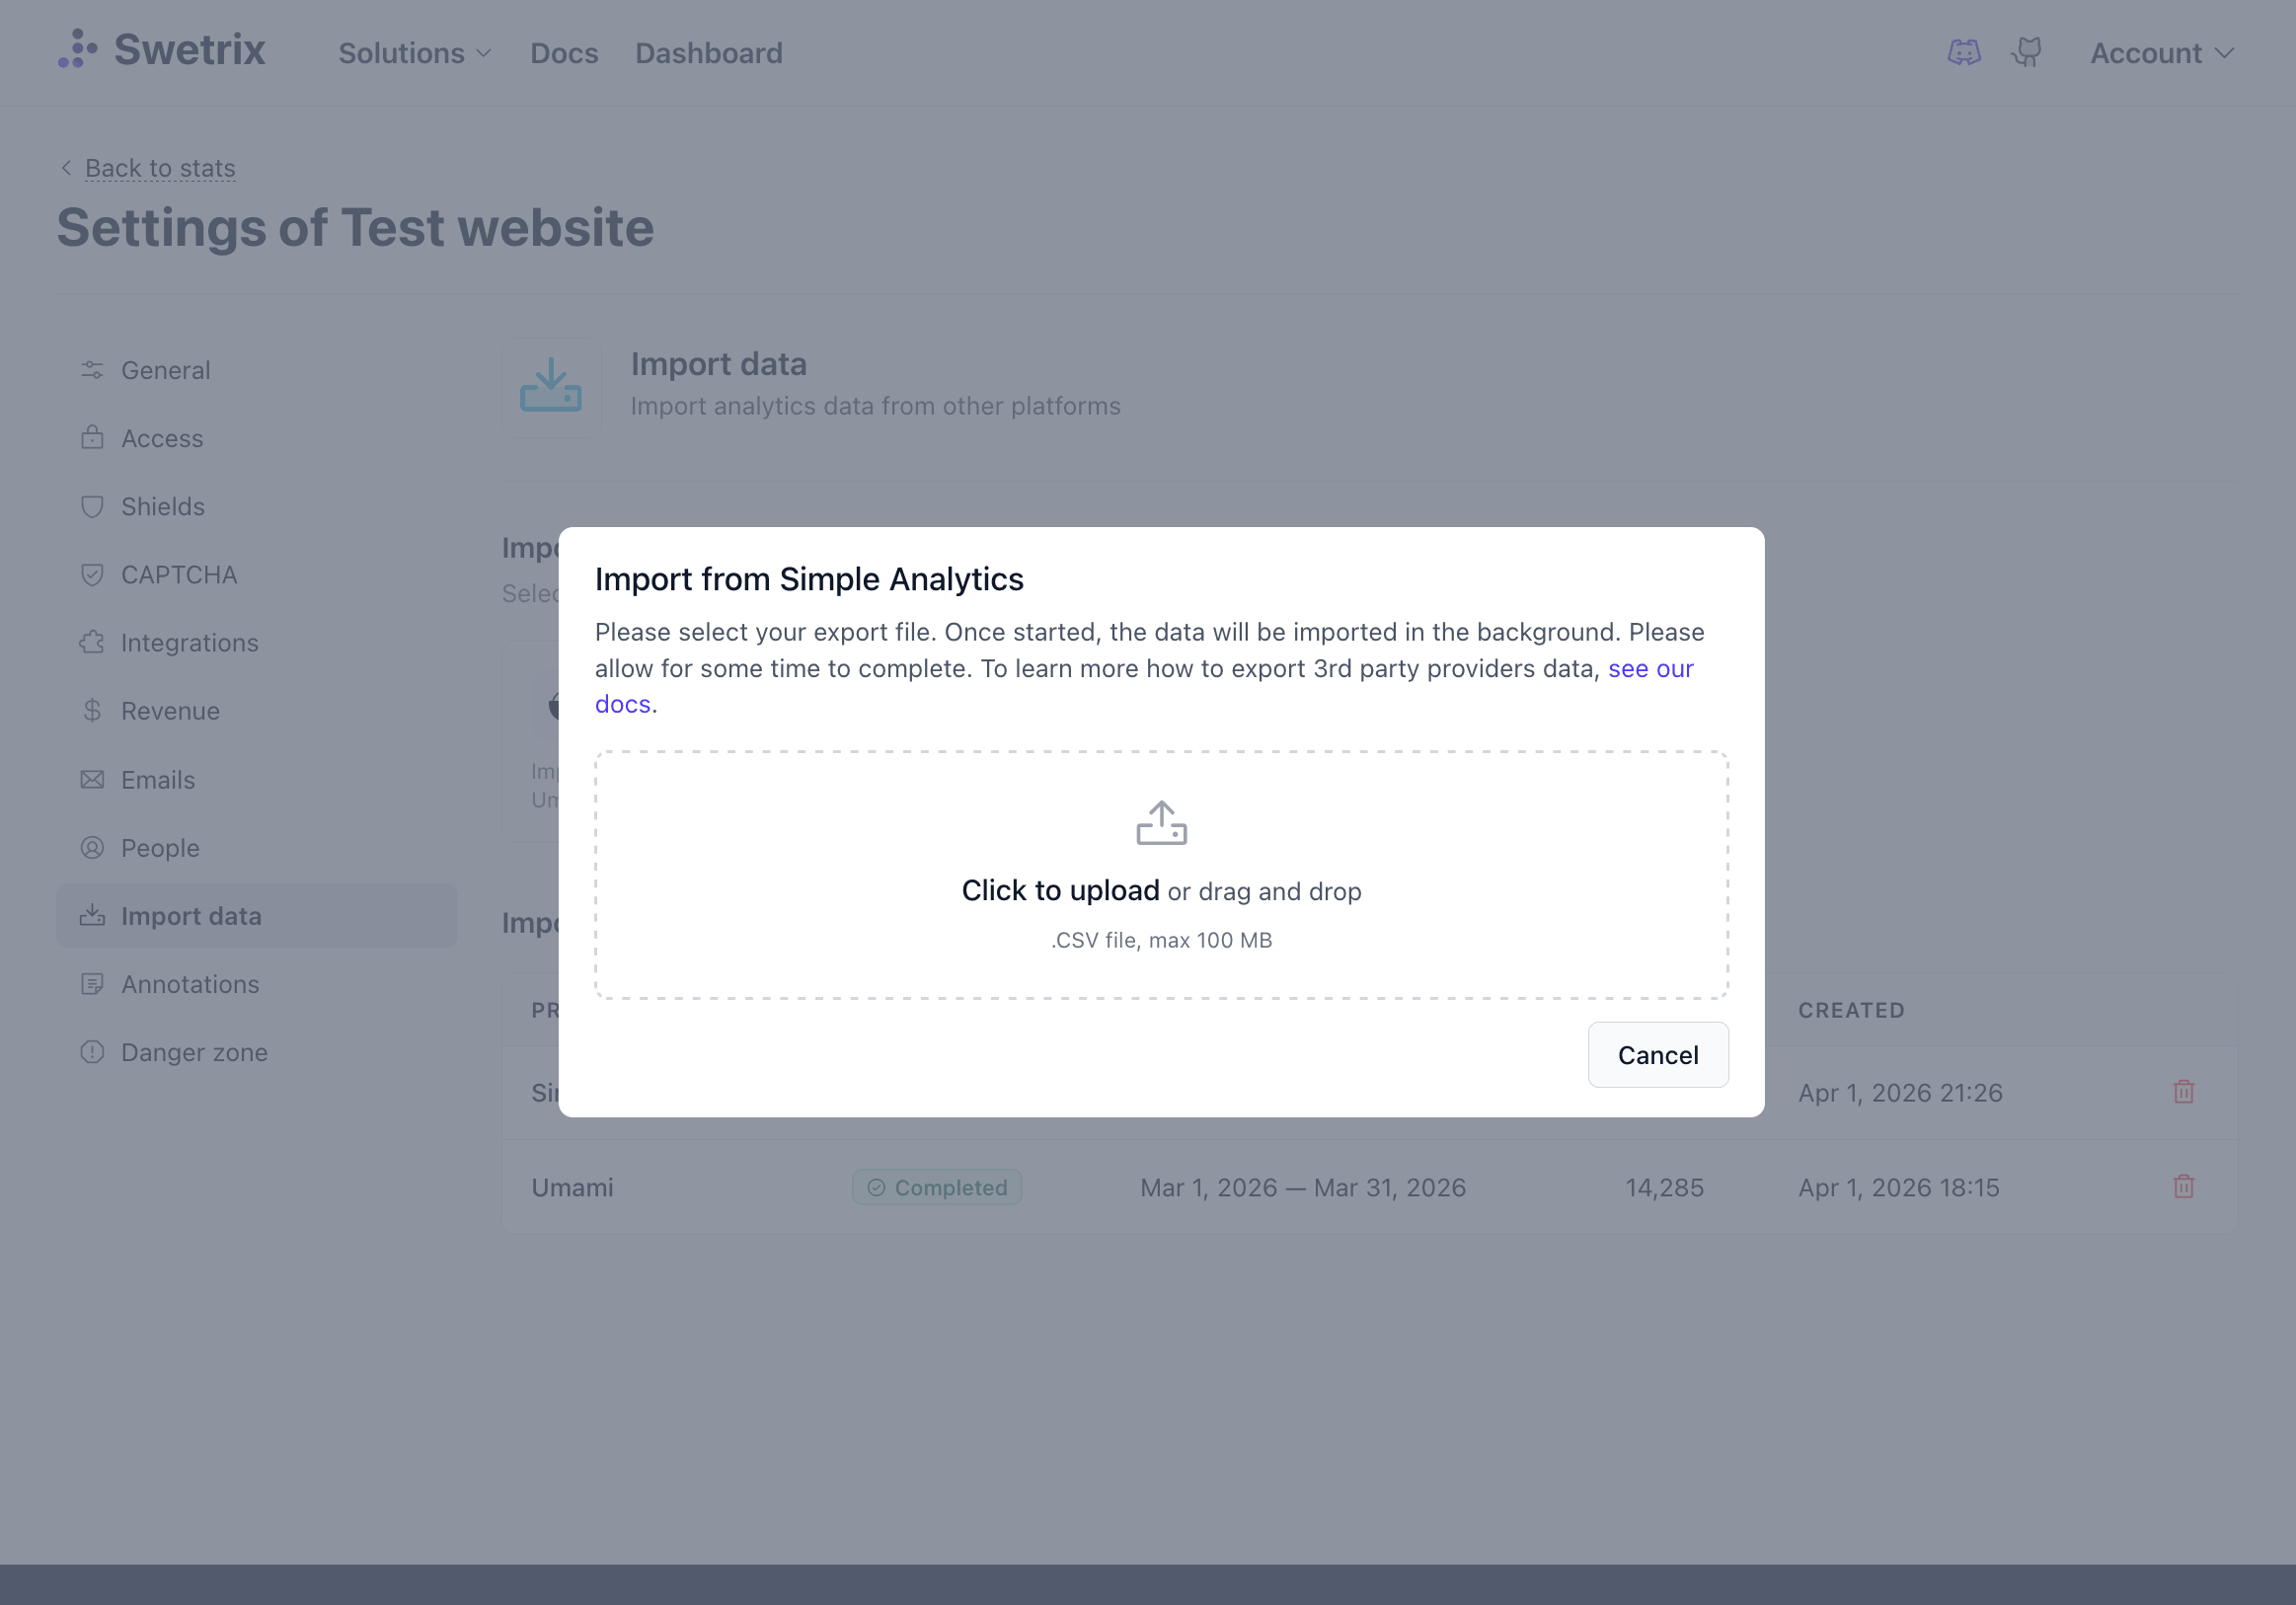
- In the upload modal, either drag and drop the
.csvfile or click to browse - Wait for the upload and processing to complete
Monitor Progress
After uploading, the import will appear in the Import history table below the provider cards. You can see:
- Status — Pending, Processing, Completed, or Failed
- Date range — The time span of the imported data
- Rows — How many analytics events were imported
The page auto-refreshes while an import is processing. You can navigate away and come back later.
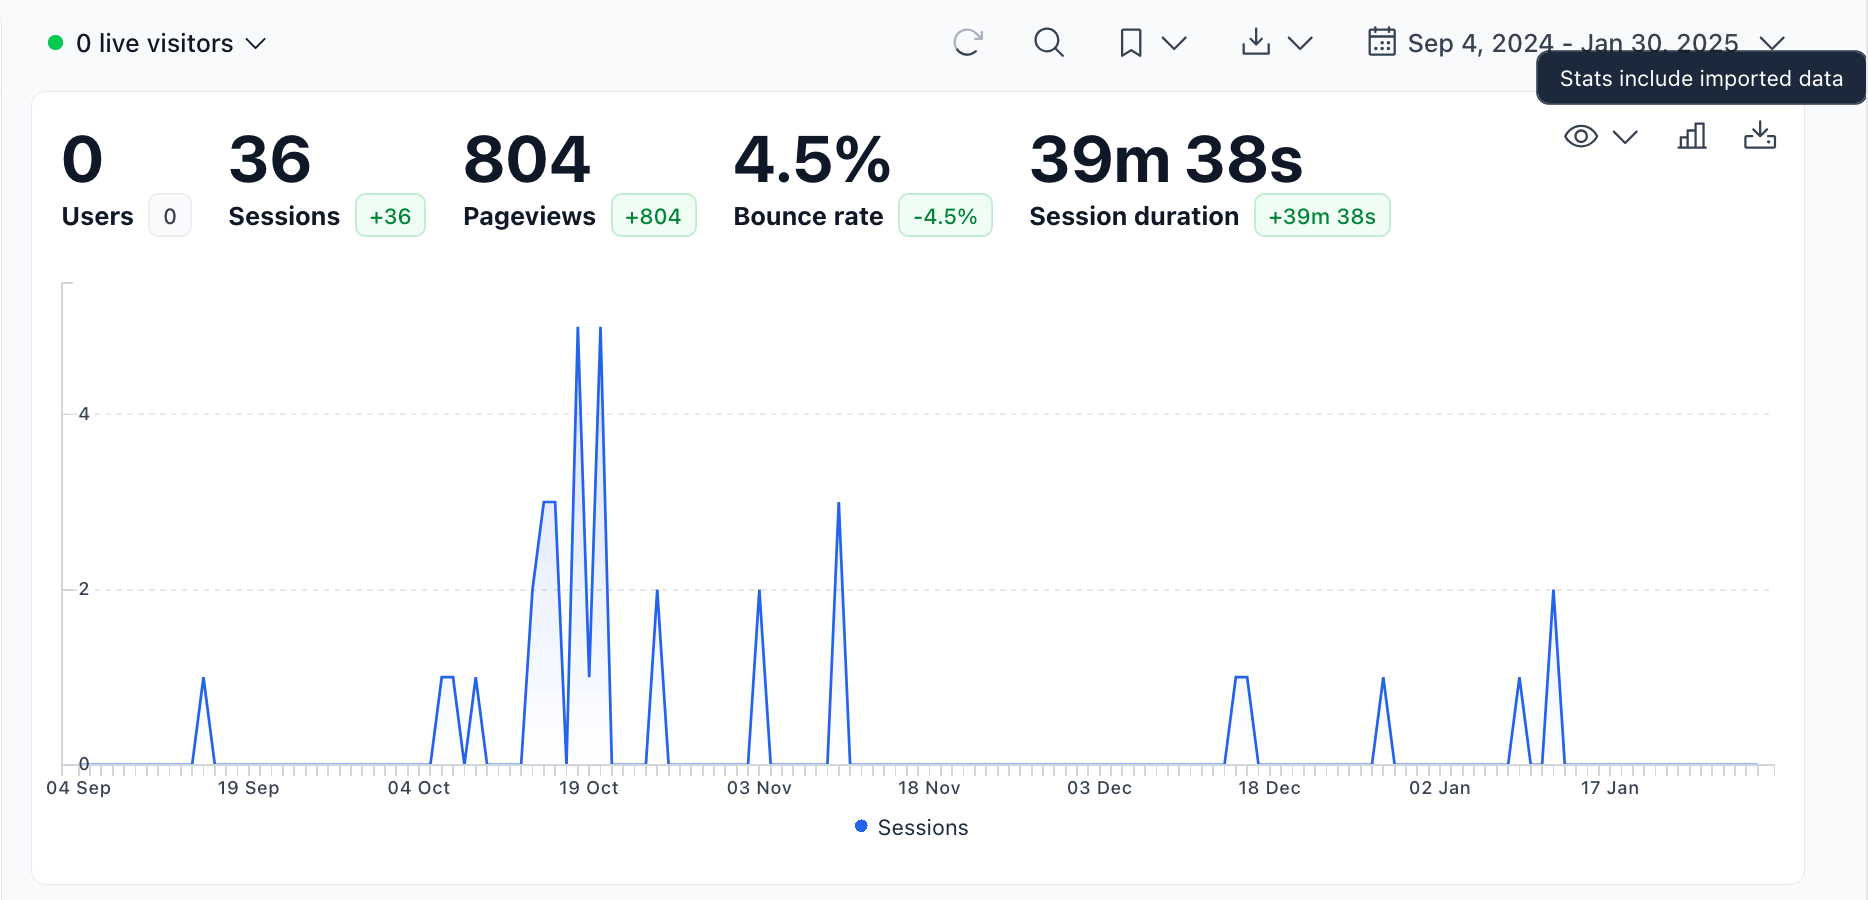
Because Fathom Analytics does not allow raw data exports, the sessions will be imported with hourly precision. It's still mostly accurate, but some longer sessions may be slightly misrepresented.
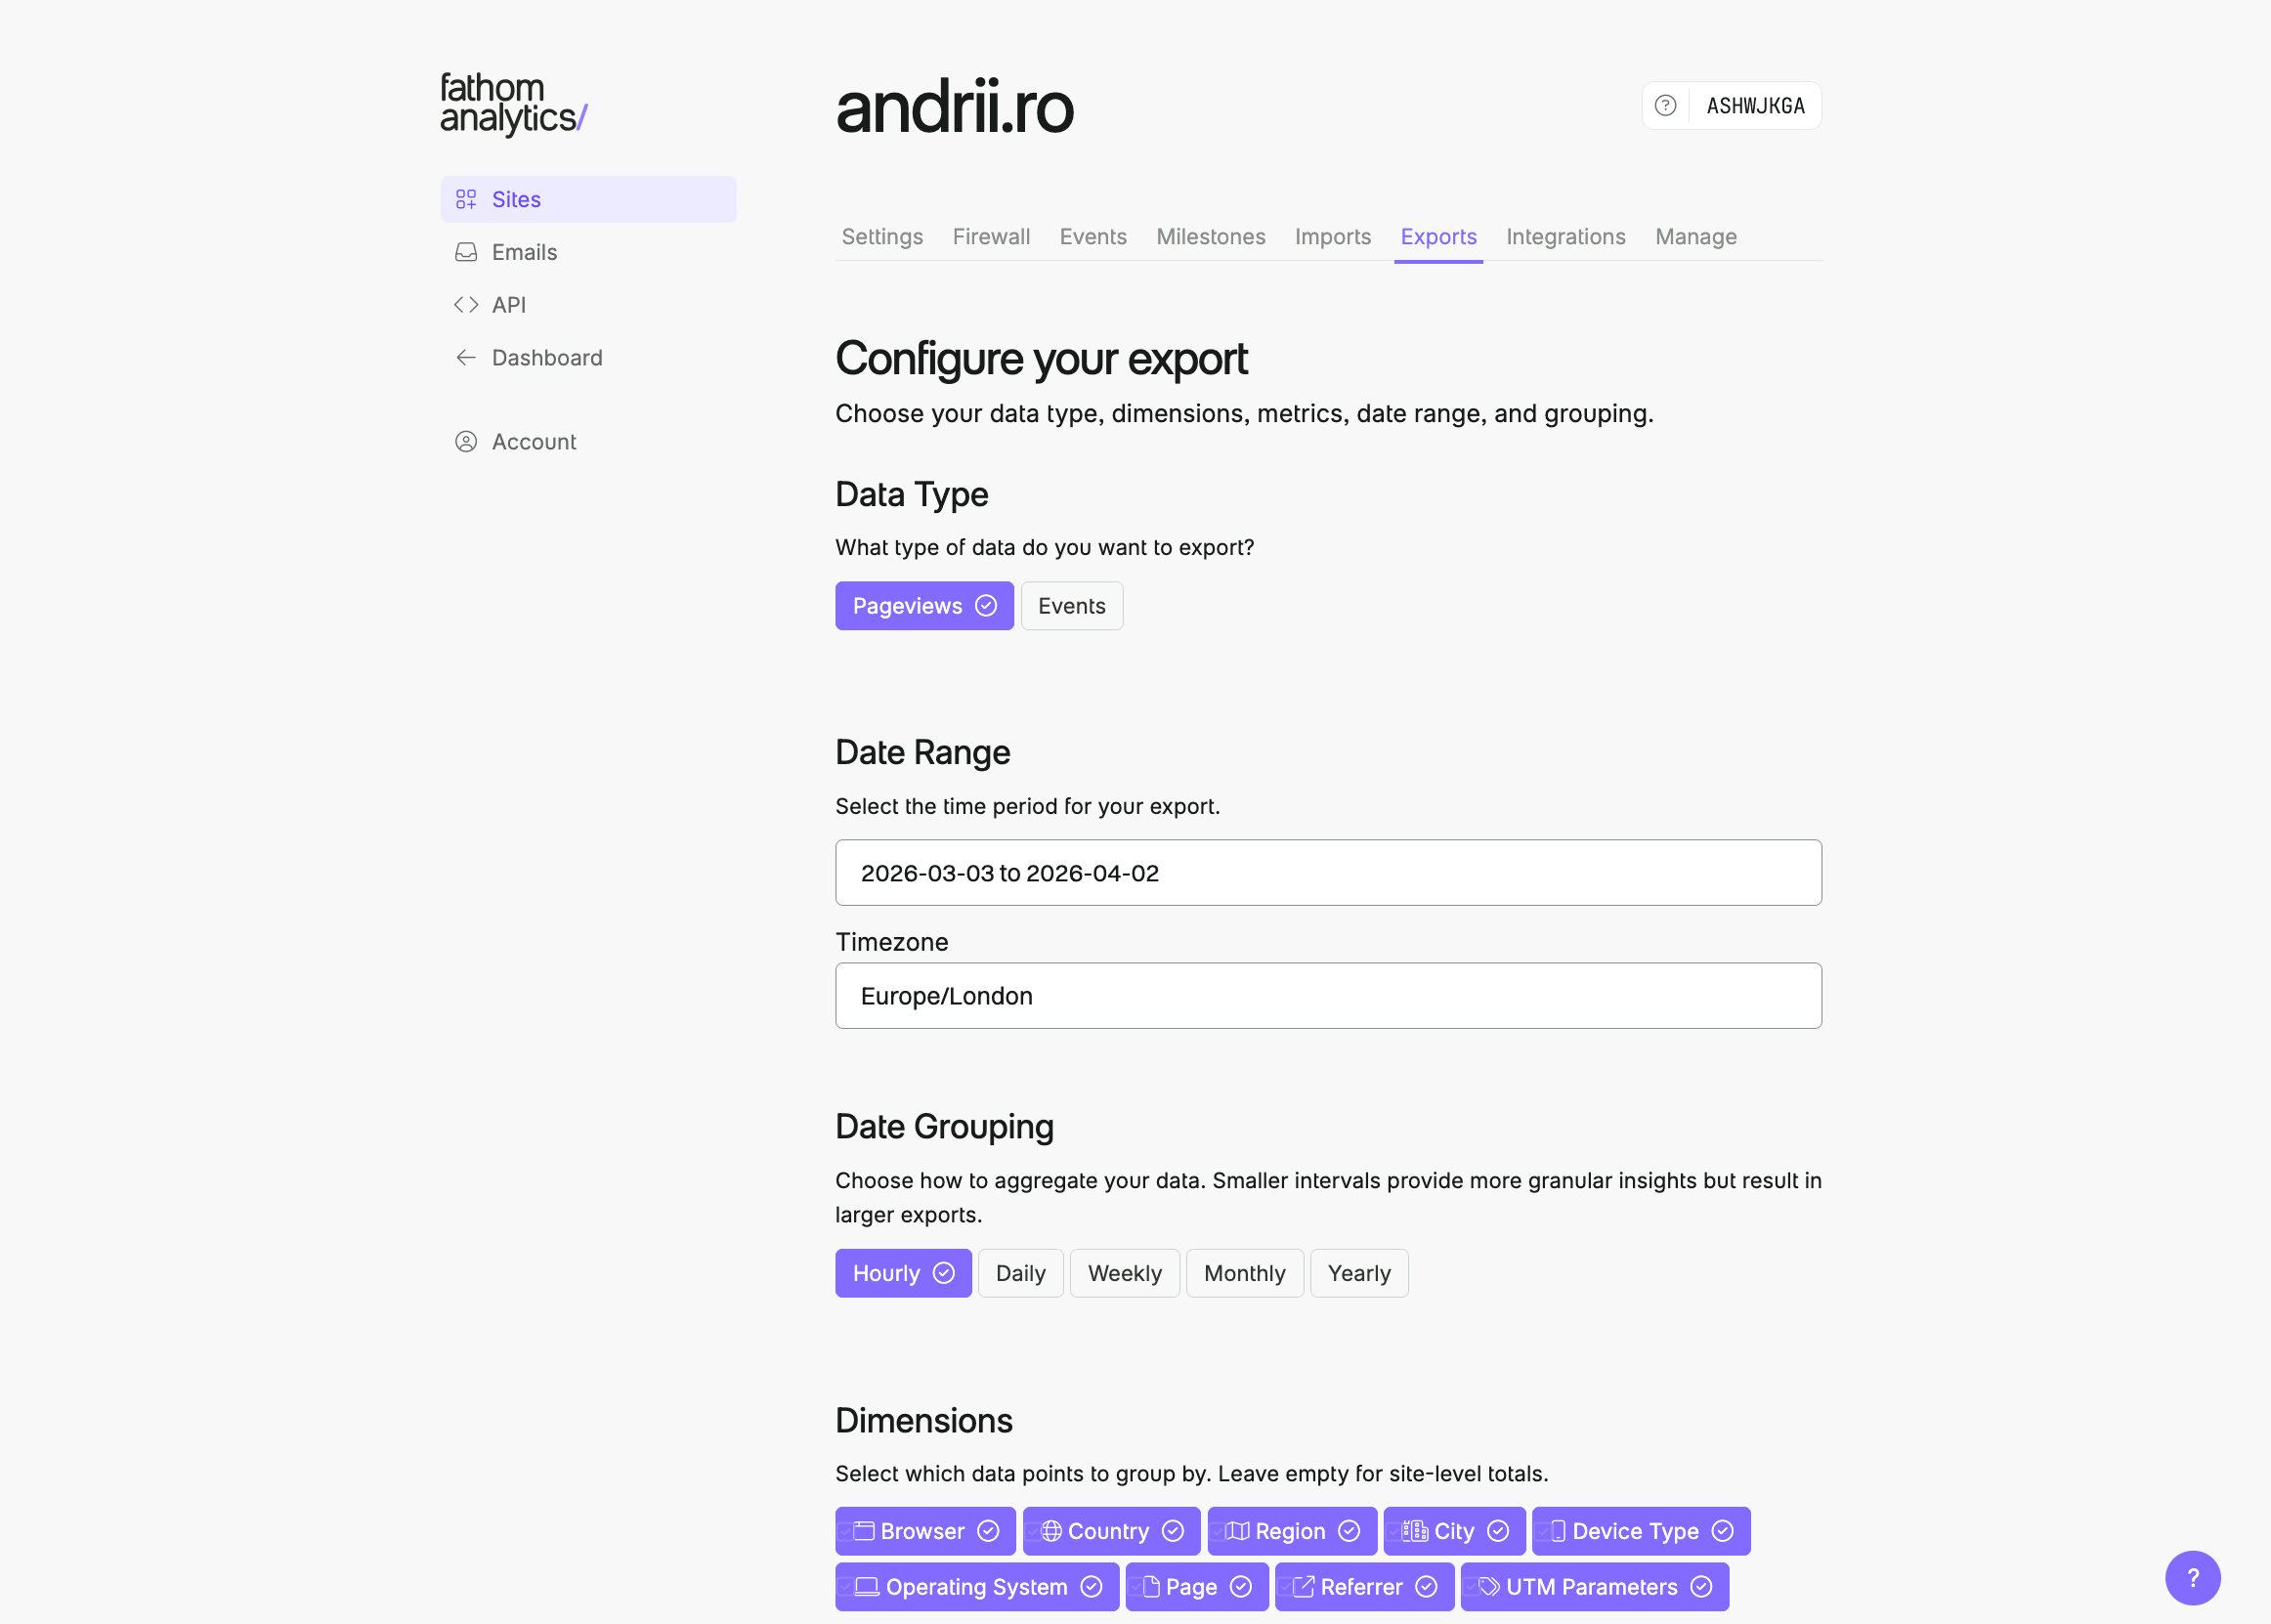
Export Your Data from Fathom
- Log in to your Fathom Analytics dashboard
- Go to your site's settings and go to the Exports tab
- Click New export
- (important) For Date Grouping, select Hourly
- Select all available Dimensions and Metrics
If you have tracked custom events with Fathom, you can also export them (under the Events tab) - for custom events make sure to also select Hourly for Date Grouping, as well as all available Dimensions and Metrics.
Fathom exports pageviews and events as separate CSV files. You will be able to import both of them to Swetrix one at a time.
You can learn more on how to export your data from Fathom on their export documentation.
Import into Swetrix
- Go to your project's Settings page in Swetrix
- Click the Import data tab
- Click the Fathom Analytics provider card
- In the upload modal, either drag and drop your
.csvfile or click to browse - Wait for the upload and processing to complete
Fathom exports pageviews and events as separate CSV files. Upload them one at a time — you don't need to upload both at once. The imported data will be linked automatically.
Monitor Progress
After uploading, the import will appear in the Import history table below the provider cards. You can see:
- Status — Pending, Processing, Completed, or Failed
- Date range — The time span of the imported data
- Rows — How many analytics events were imported
The page auto-refreshes while an import is processing. You can navigate away and come back later.
Plausible only allows exporting daily aggregated data — there is no raw event export. Swetrix reconstructs synthetic per-event rows from your aggregates so you can browse the data in dashboards. Because the mapper samples each dimension's daily distribution independently with replacement, single-dimension breakdowns (e.g. top browsers or top pages) are deterministic approximations rather than guaranteed exact reproductions of Plausible's report. Only per-day totals and the top-level generated counts (sessions, pageviews, custom events) are preserved exactly.
Export Your Data from Plausible
- Log in to your Plausible Analytics dashboard
- Open the site you want to export from
- Go to Site Settings → Imports & Exports
- Click Export in the CSV export section to download a
.ziparchive
The archive contains one CSV per dimension (imported_visitors_*.csv, imported_pages_*.csv, imported_browsers_*.csv, imported_devices_*.csv, imported_operating_systems_*.csv, imported_locations_*.csv, imported_sources_*.csv, imported_entry_pages_*.csv, imported_exit_pages_*.csv, imported_custom_events_*.csv, imported_custom_props_*.csv).
You can learn more on how to export your data from Plausible on their export documentation.
Import into Swetrix
- Go to your project's Settings page in Swetrix
- Click the Import data tab
- Click the Plausible Analytics provider card
- In the upload modal, either drag and drop the
.zipfile or click to browse - Wait for the upload and processing to complete
Upload the .zip file from Plausible directly — do not extract it first.
Monitor Progress
After uploading, the import will appear in the Import history table below the provider cards. You can see:
- Status — Pending, Processing, Completed, or Failed
- Date range — The time span of the imported data
- Rows — How many synthetic events were generated
The page auto-refreshes while an import is processing.
How the approximation works
For each day in the export, Swetrix:
- Reads
imported_visitors_*.csvto get the day'svisits(sessions) andpageviewstotals - Builds a probability distribution for each dimension (browser, OS, device, country/region, source/UTM, entry page, exit page, page) weighted by the visits/entrances/exits in the corresponding CSV
- Generates exactly
visitssynthetic sessions, sampling one value from each dimension's distribution independently with a deterministic PRNG seeded by the import ID and date - Distributes the day's
pageviewsacross sessions (first page = a sampled entry page, last page = a sampled exit page, middle pages sampled from the pages distribution) - Spreads session start times evenly across the 24h window and pageview gaps within a session based on the average
visit_durationper session
This is deterministic — re-importing the same export produces identical rows.
What's not imported?
- Custom event properties (
imported_custom_props_*.csv): Plausible reports property values aggregated separately from event occurrences with no way to attribute a value to a specific event, so these are skipped - Cities: Plausible exports only Geonames numeric city IDs without names, so the city field is left blank
- Exact session duration / bounce rate per session: only daily averages are preserved
- Exact breakdowns: each dimension is sampled independently with replacement per session, so single-dimension breakdowns are deterministic approximations rather than exact reproductions of Plausible's per-day report, and cross-dimension joints (e.g. "Firefox on macOS in GB") are sampled under an independence assumption and do not match Plausible's joint distributions
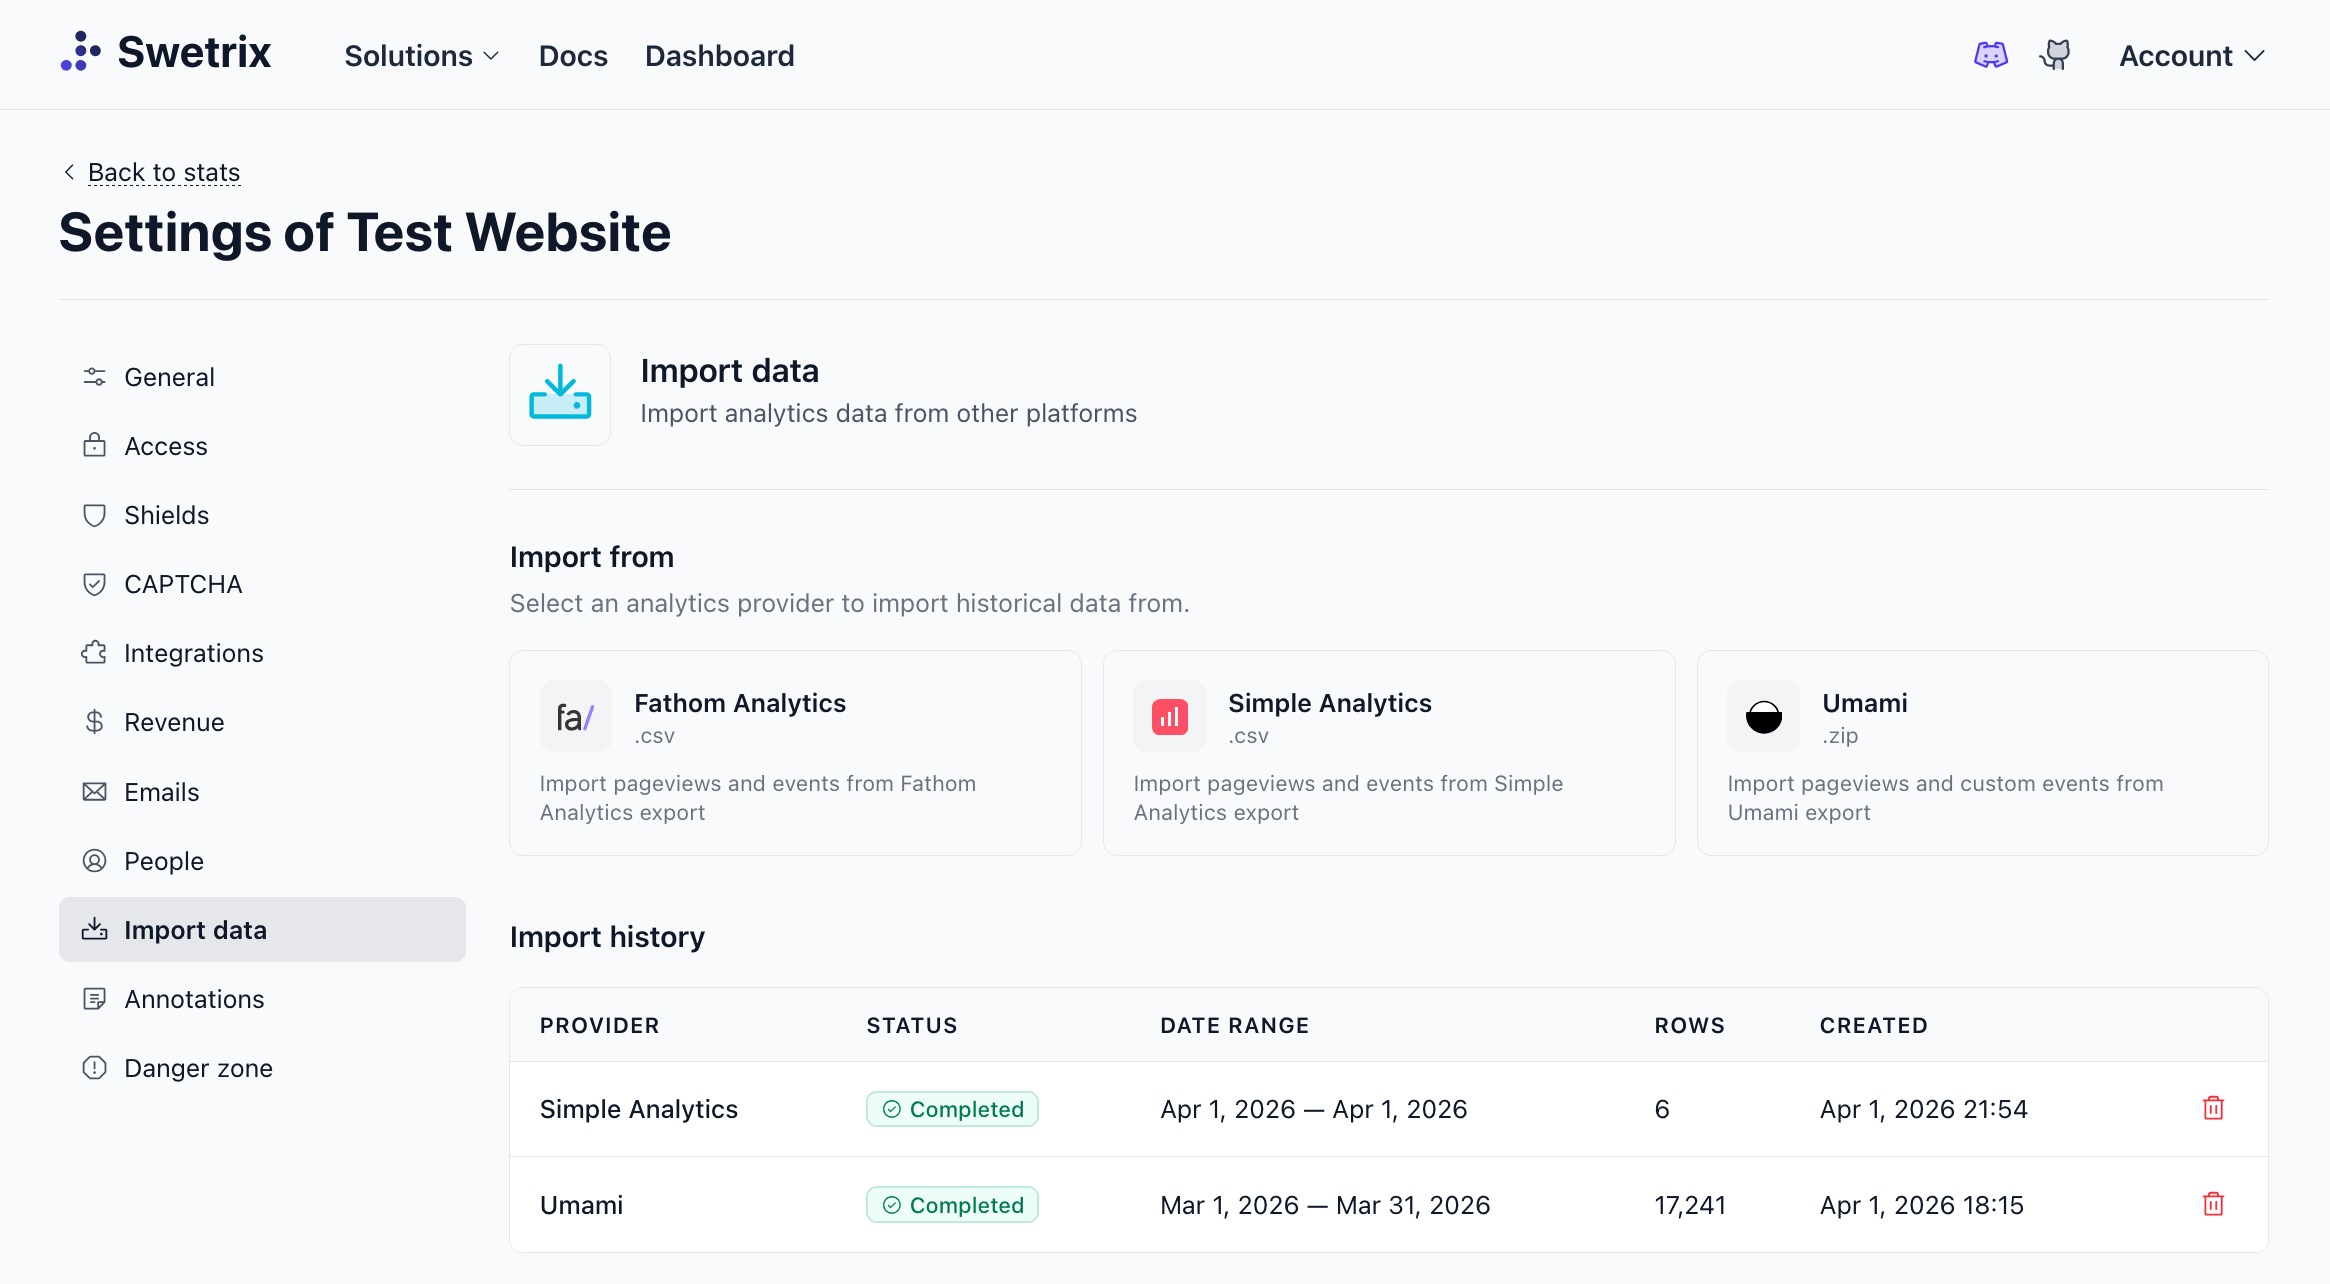
Viewing Imported Data
Once an import completes, the data is immediately available in your analytics dashboard. When you select a date range that includes imported data, a small "Imported" badge appears near the period selector to let you know.
Deleting an Import
If you want to remove imported data:
- Go to Settings → Import data
- Find the import in the history table
- Click the trash icon
- Confirm the deletion
This permanently removes all analytics rows associated with that import. Your live-tracked data is not affected.
Limitations
- File size: Maximum 100 MB per upload (for file-based imports)
- One at a time: Only one import can be active (pending or processing) per project at a time
- Timestamps: Events with invalid timestamps are skipped during import
- GA4 dimensions: Google Analytics 4 imports are subject to API limitations — see the "What's not imported?" section under the Google Analytics 4 tab for details
Troubleshooting
Import stuck in "Processing"
Large files may take several minutes to process. If an import seems stuck, wait up to 30 minutes. If it still hasn't completed, the import may have failed - check for error messages in the import history.
"An import is already in progress"
Only one import can run at a time per project. Wait for the current import to complete or fail before starting a new one.
Invalid file type error
Make sure you're uploading the correct file format for your provider. For Umami, upload the .zip file directly - do not extract it first. For Simple Analytics and Fathom Analytics, upload the .csv export file.
Data not appearing in charts
After a successful import, select a date range that covers the imported data's time period. The imported data indicator badge should appear to confirm it's included.
Help us improve Swetrix
Was this page helpful to you?