Captcha Analytics
The Captcha Analytics dashboard provides detailed insights into how users are interacting with the Swetrix CAPTCHA on your website. It helps you monitor generation volume, pass rates, failures, replay attempts, solve time, selected difficulty, and the demographics of users solving your CAPTCHAs.
Overview
Swetrix offers a privacy-friendly, cookieless CAPTCHA solution that uses a Proof of Work mechanism. This dashboard allows you to track the performance of this feature and ensure legitimate users are successfully accessing your protected content while bots are kept at bay.
For more details on how Swetrix CAPTCHA works and how to integrate it, please refer to the Captcha documentation.
Key Metrics
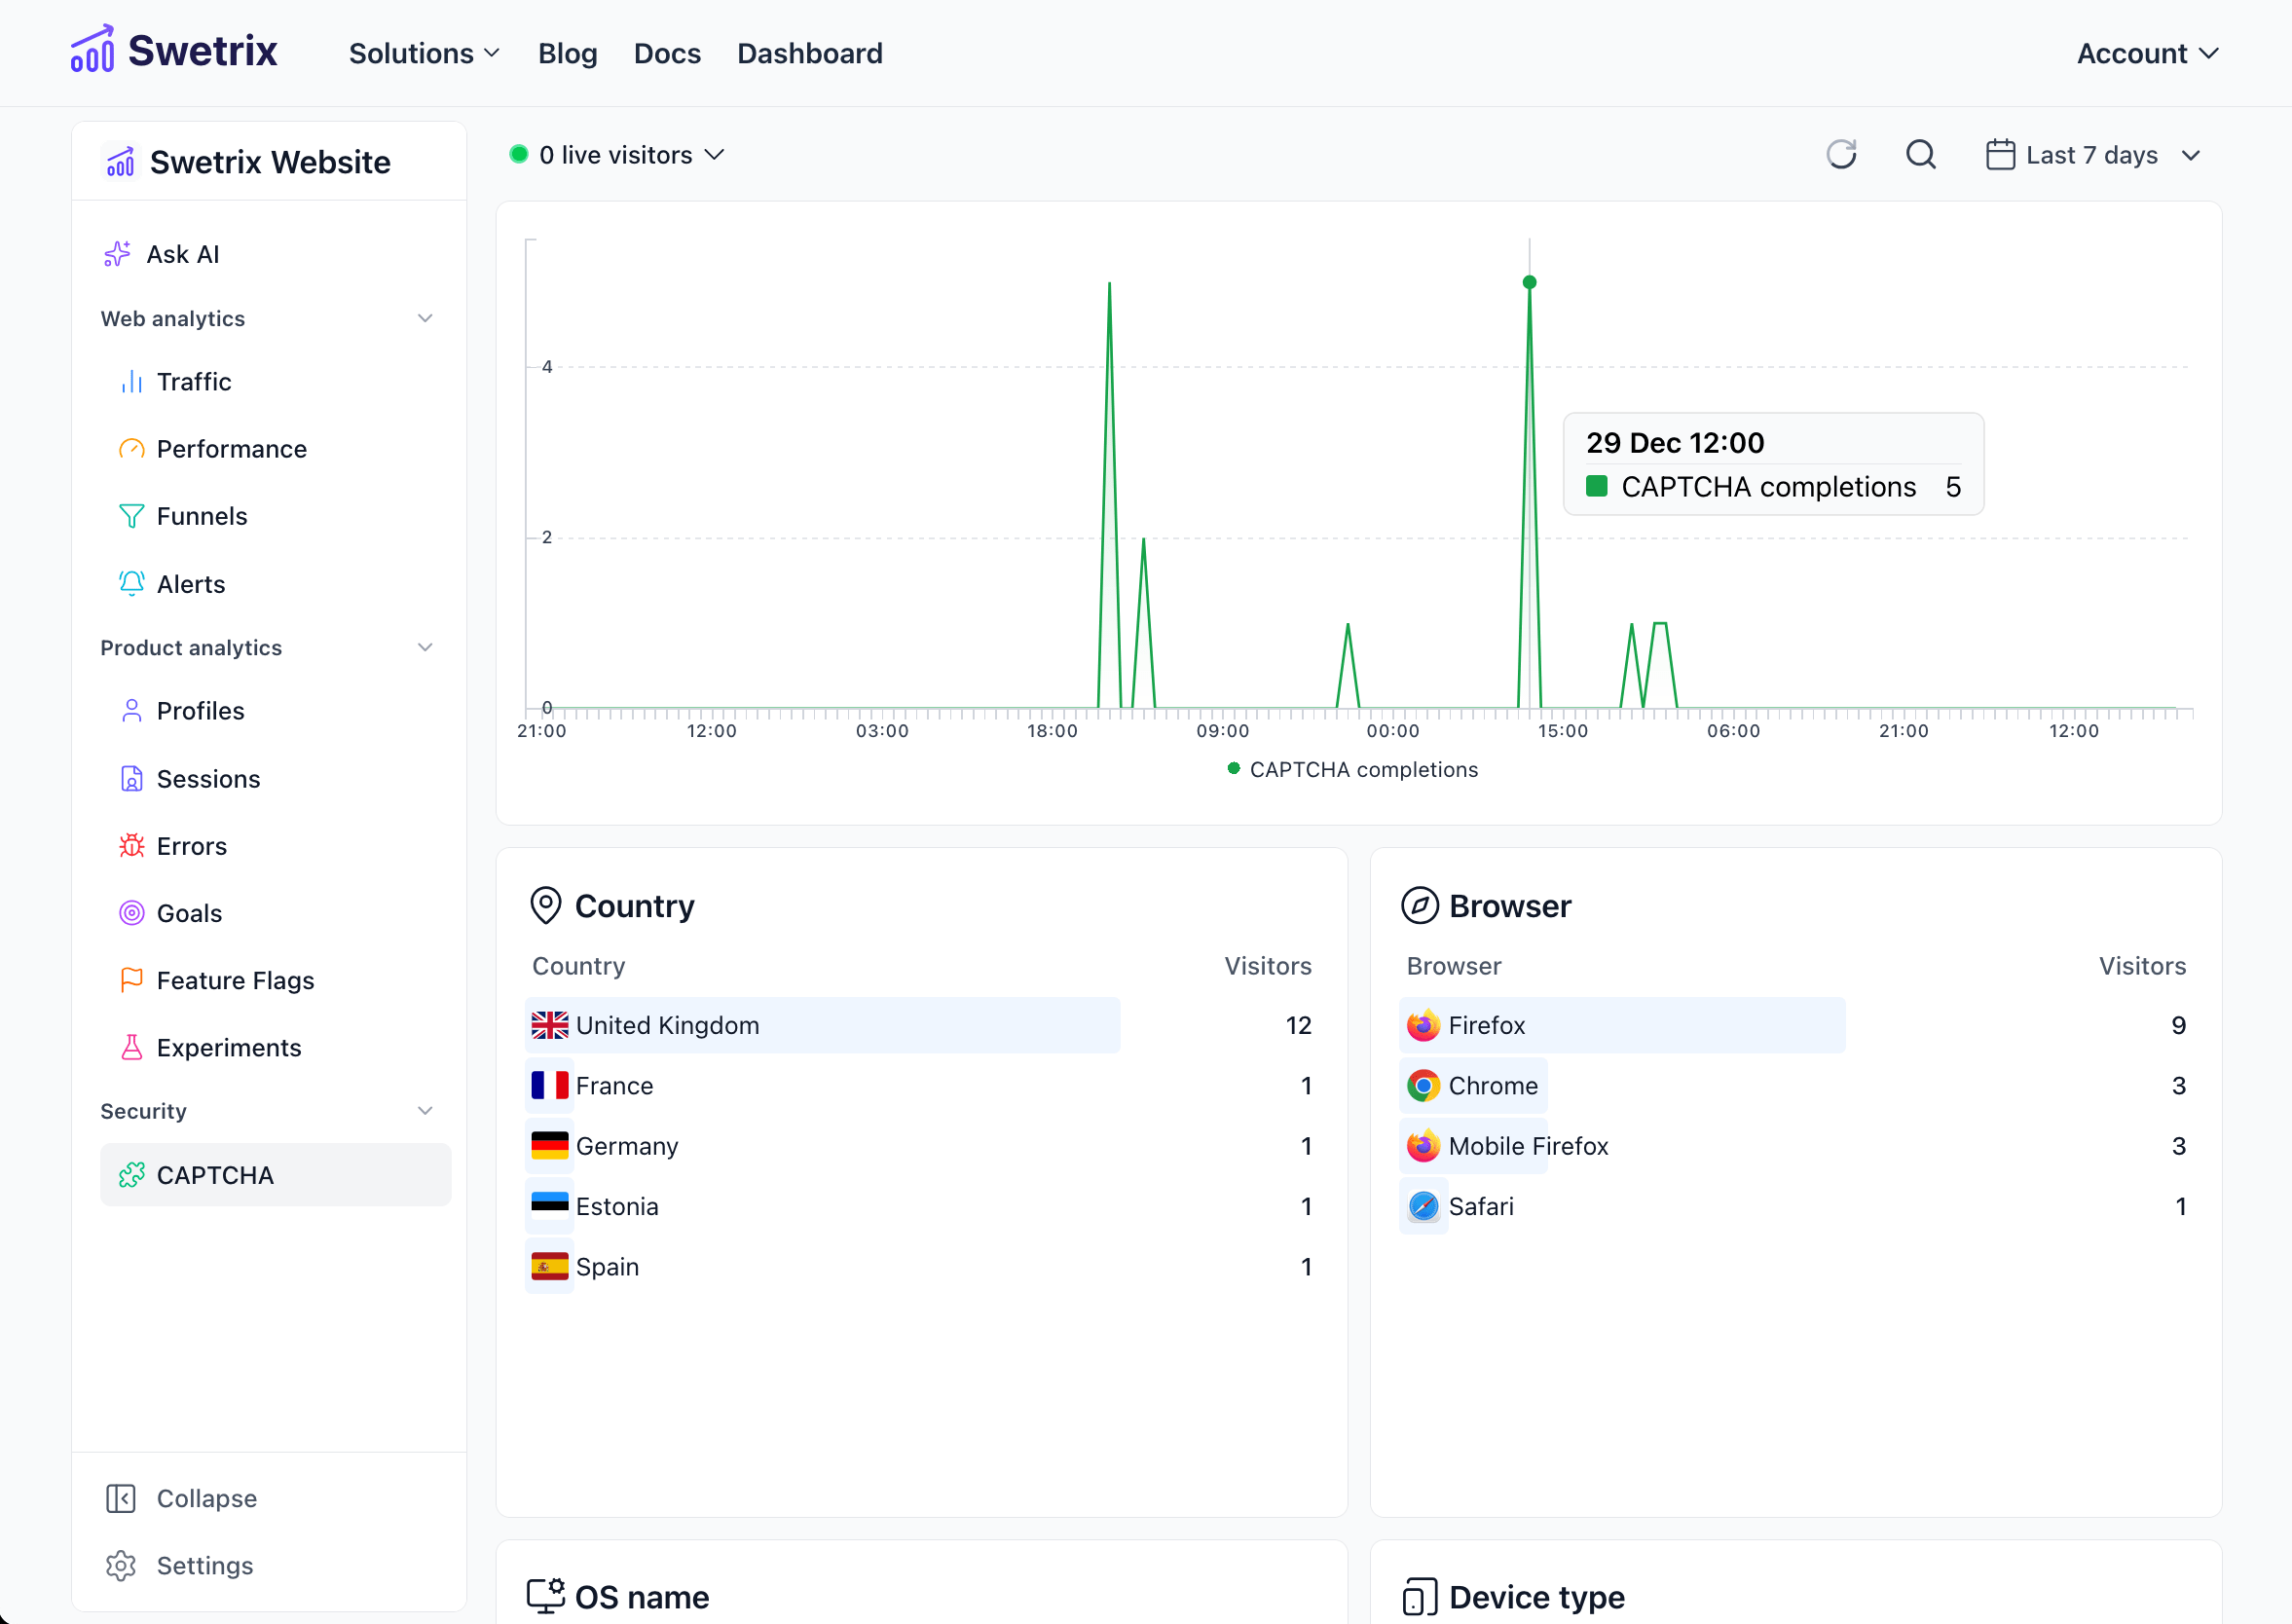
Captcha events
The main chart displays CAPTCHA generations, successful passes, verification failures, validation failures, and replay attempts within the selected timeframe. Older CAPTCHA data that does not include event metadata is treated as successful passes.
Visualising this data helps you:
- Monitor traffic spikes that might indicate bot attacks.
- Ensure the CAPTCHA is functioning correctly for legitimate users.
- Correlate CAPTCHA completions with specific events or campaigns.
- Identify validation or replay issues in your backend integration.
Auto difficulty
If Auto difficulty is enabled, the dashboard shows the selected difficulty distribution and the reason categories that caused Swetrix to raise the difficulty. These reason categories are intentionally coarse, such as hosting IP, project spike, country spike, replay attempts, verification failures, or low pass ratio.
Solve time
Solve-time panels and summary values show how long successful challenges took from generation to verification. This helps you spot when challenge difficulty is too aggressive for legitimate users.
Detailed Breakdown
Below the main chart, you can find detailed panels that categorise the CAPTCHA completion data by various dimensions:
Location
- Country: See which countries your CAPTCHA-solving traffic is originating from.
Devices
- Browser: Identify which web browsers are being used to solve CAPTCHAs.
- Operating System (OS): View the operating systems of your users.
- Device Type: Breakdown by device category (e.g., Desktop, Mobile, Tablet).
- Difficulty: Chosen challenge difficulty distribution.
- Auto difficulty reasons: Coarse categories explaining why Auto raised difficulty.
- Solve time: Distribution of successful solve durations.
Filtering and Analysis
As with other dashboards in Swetrix, you can filter the data by clicking on any specific item in the breakdown panels (e.g., filtering to show only CAPTCHA completions from "Mobile" devices).
You can also adjust the time range and time bucket (e.g., hourly, daily) using the controls at the top of the page to analyse trends over different periods.
Help us improve Swetrix
Was this page helpful to you?