Error tracking
Swetrix provides built-in client-side error tracking alongside your analytics. Monitor when, where, and what kind of errors your users encounter — complete with stack traces, affected sessions, and detailed breakdowns by device, browser, and page.
Quick setup
Error tracking is bundled with the Swetrix tracking script. Enable it by calling trackErrors() after initialising Swetrix:
Script tag
<script src="https://swetrix.org/swetrix.js" defer></script>
<script>
  document.addEventListener("DOMContentLoaded", function () {
    swetrix.init("YOUR_PROJECT_ID");
    swetrix.trackViews();
    swetrix.trackErrors();
  });
</script>
NPM package
import * as Swetrix from "swetrix";

Swetrix.init("YOUR_PROJECT_ID");
Swetrix.trackViews();
Swetrix.trackErrors();
That's it — unhandled errors will now be captured and sent to your Swetrix dashboard automatically.
What gets tracked
Each error event includes:
- Error name and message — e.g.
TypeError: Cannot read properties of undefined - File, line, and column — pinpoints where the error occurred
- Stack trace — the full call stack for debugging
- Page URL — which page the user was on
- Locale and timezone — user's language and region
- Custom metadata — attach your own context via the
callbackoption
Manual error reporting
You can also report errors manually using trackError(). This is useful for catching errors in try/catch blocks or logging errors from third-party libraries:
swetrix.trackError({
  name: "PaymentError",
  message: "Card declined",
  meta: {
    provider: "stripe",
    step: "checkout",
  },
});
Configuration options
You can fine-tune error tracking with options like sampleRate (to control how many errors are sent) and callback (to filter or enrich error data before sending):
swetrix.trackErrors({
  sampleRate: 0.5,
  callback: (error) => {
    if (error.message.includes("ResizeObserver")) return false;
    return error;
  },
});
See the full tracking script reference for all available options.
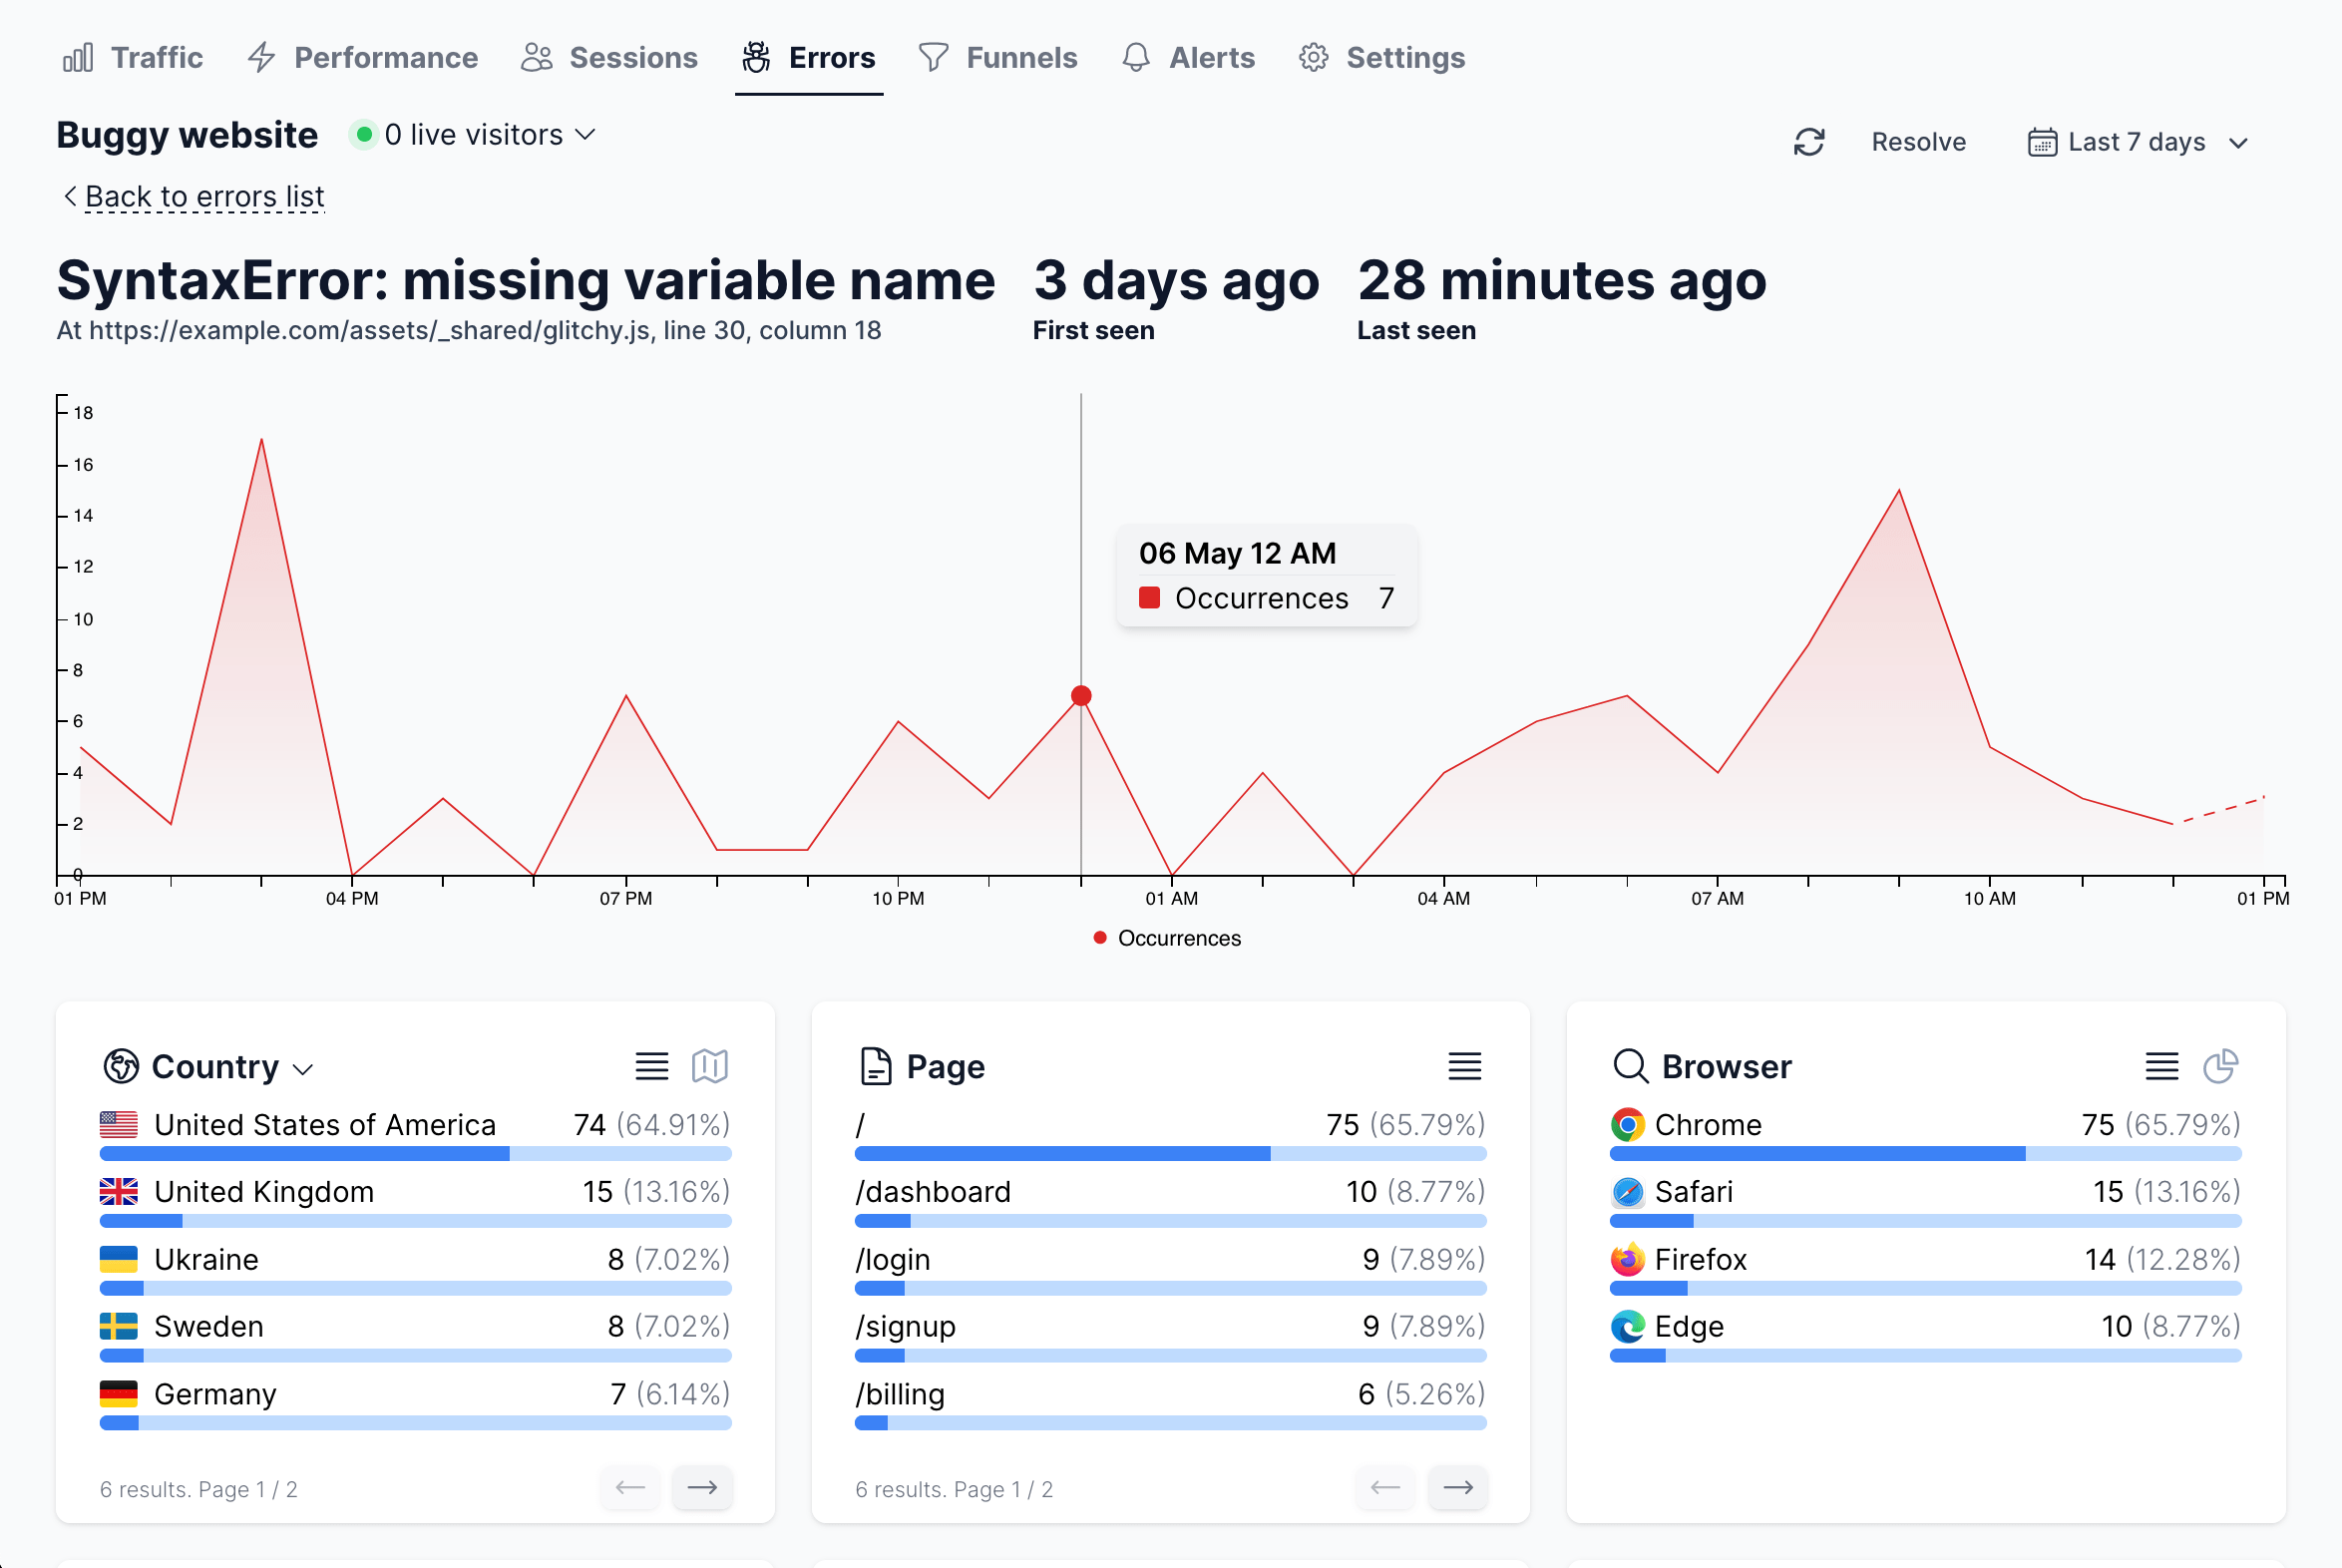
Dashboard features
Once errors start coming in, the Errors tab in your project dashboard gives you:
- Aggregated error list — errors grouped by signature with occurrence counts, affected users, and last-seen timestamps
- Error details — full stack traces, metadata, and affected sessions for each error
- Status management — mark errors as Resolved; Swetrix auto-detects regressions
- Breakdowns — slice error data by country, browser, OS, device type, and page
- Real-time alerts — get notified via Email, Slack, Discord, or Telegram when new errors appear
Learn more about the error tracking dashboard in the Error Tracking dashboard guide.
Error tracking is included in all plans. Each error event counts as 1 regular event (same as a pageview or custom event).
Help us improve Swetrix
Was this page helpful to you?