- Date
Website Heatmap Alternative: 6 Privacy-First Options
 Andrii Romasiun
Finding a website heatmap alternative means moving past raw interaction counts to measure the actual user journey. A traditional visual overlay shows where visitors click, tap, move, or scroll, which answers immediate questions about attention but rarely explains underlying behavior. Although a cluster of red dots on a button confirms interaction, it cannot tell you whether those visitors completed the checkout flow, experienced a JavaScript error, or arrived from a qualified paid campaign.
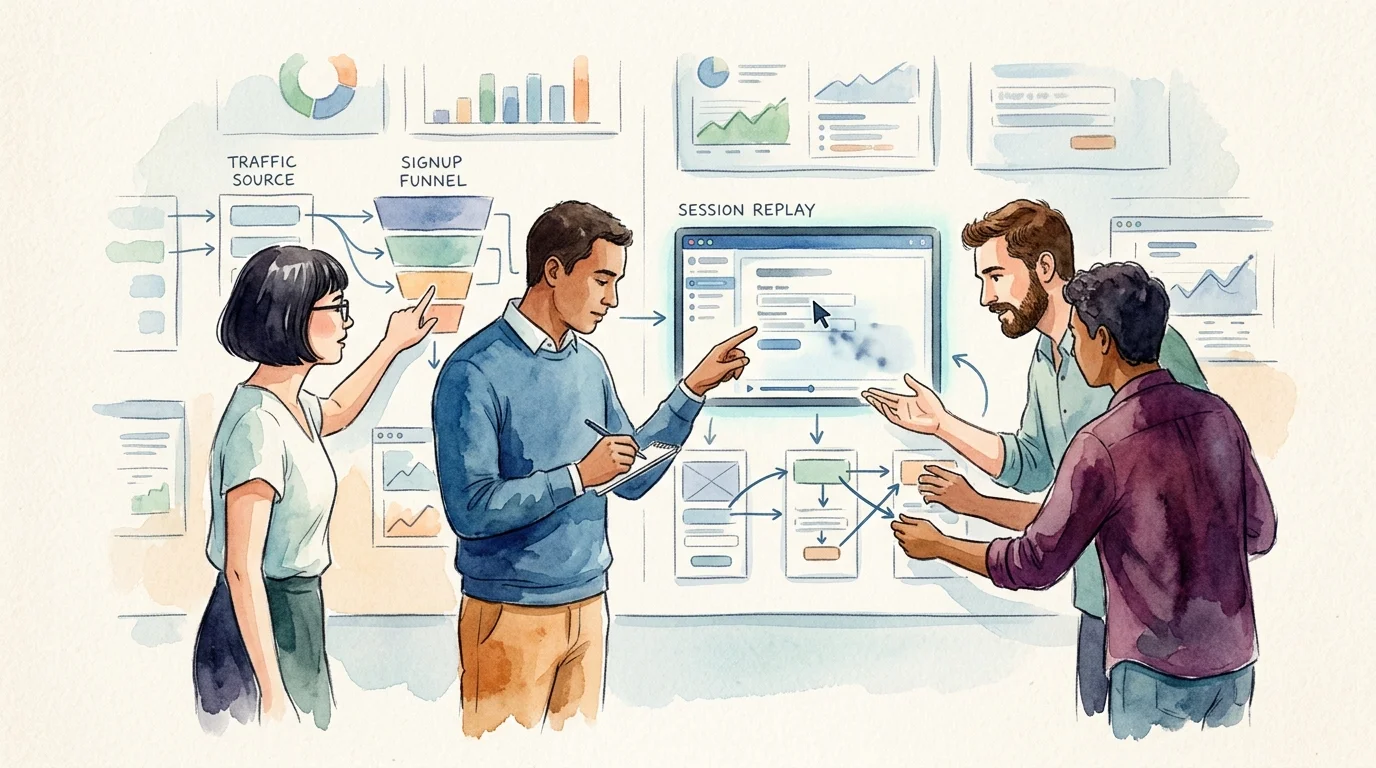
Relying exclusively on heatmaps leaves interaction data isolated from conversion metrics. If you see a user abandon a form, you might guess they found it confusing, whereas a broader analytics approach records the exact form_error event. This broader method traces the visit back to an organic search term and provides a masked recording of the exact field that failed. Combining cookieless behavior measurement with funnels, technical performance tracking, and selective session replay gives you the context a static map lacks.
How To Evaluate Measurement Options
Before you install a new script, write three measurable questions you need to answer, because different business problems require different measurement methods. A click map identifies neglected navigation links, while a conversion funnel flags the exact onboarding step where users quit. If a dynamic menu blocks a specific mobile device, a session replay reveals the cause.
To choose the right tool, score each option against event flexibility, privacy controls, and technical overhead. Visual mapping handles surface interactions, event funnels measure business outcomes, and session replay provides debugging context for broken journeys. Understanding the difference between web analytics and product analytics helps you select the smallest, most compliant method that satisfies your requirement.
The legal environment shapes how you collect this behavioral data. Under that framework, the April 29, 2026 UK ICO guidance explains how PECR and, where relevant, the UK GDPR apply to cookies, tracking pixels, device fingerprinting, and similar storage and access technologies. Meanwhile, the 2025 French CNIL guidance outlines conditions for consent-exempt audience measurement, including a purpose limited to audience measurement, anonymous statistical data, and no cross-site tracking.
| Platform | Primary Focus | Event Funnels | Default Tracking Method | Masking & Privacy Controls |
|---|---|---|---|---|
| Swetrix | Privacy-first analytics | Yes | Cookieless hashing | Explicit opt-in replay, total masking |
| Microsoft Clarity | Visual behavior maps | No | First-party/third-party cookies | Element exclusion, strict masking |
| Hotjar | UX surveys & heatmaps | Yes | First-party cookies | Input suppression, selective recording |
| Matomo | Owned analytics suite | Yes | First-party cookies | Client-side input masking |
| PostHog | Product engineering | Yes | Platform-dependent | Granular event rules, text masking |
| OpenReplay | Self-hosted debugging | Custom | Platform-dependent | Private mode, network obscuring |
1. Swetrix: Best For Privacy-First Analytics
Swetrix bridges the gap between simple website measurement and advanced product analytics, meaning you do not need to replace every heatmap with another visual map. The platform replaces isolated workflows by combining traffic attribution, custom events, conversion funnels, and technical SEO monitoring in a single open-source dashboard.
Operating without cookies, the standard analytics layer irreversibly hashes visitor data and hosts the platform on EU-owned servers in Germany. This architecture supports GDPR, CCPA, and PECR compliance directly out of the box. Instead of guessing whether a hot spot on a page translates to revenue, you can track user signups explicitly. Building a funnel from the landing page to the activation step lets you segment traffic by device and connect any drop-offs to recorded technical errors or slow page loads.
When a quantitative funnel reveals a problem, activating the session replay feature investigates the visual context. Swetrix replays are Cloud-only and disabled by default, so you must trigger them specifically by calling startSessionReplay() on the pages requiring investigation. To protect user information, the platform provides a total privacy mode that masks all text and inputs before the data leaves the visitor's browser.
Establish your traffic baseline using standard pageviews and campaign parameters, then track specific interaction milestones using event tags like cta_click, signup_start, and form_error. Build your conversion funnel and monitor the connected Search Console data for organic visibility. If a specific step shows unusual abandonment, review your consent requirements and activate masked session replays for that single URL to find the underlying interface problem.
2. Microsoft Clarity: Best For Visual Behavior Analysis
Microsoft Clarity serves teams prioritizing visual click maps, tap maps, scroll maps, and session recordings above deep funnel analytics. When your central question involves where visitors direct their attention on a specific layout, Clarity provides rapid visual density reports.
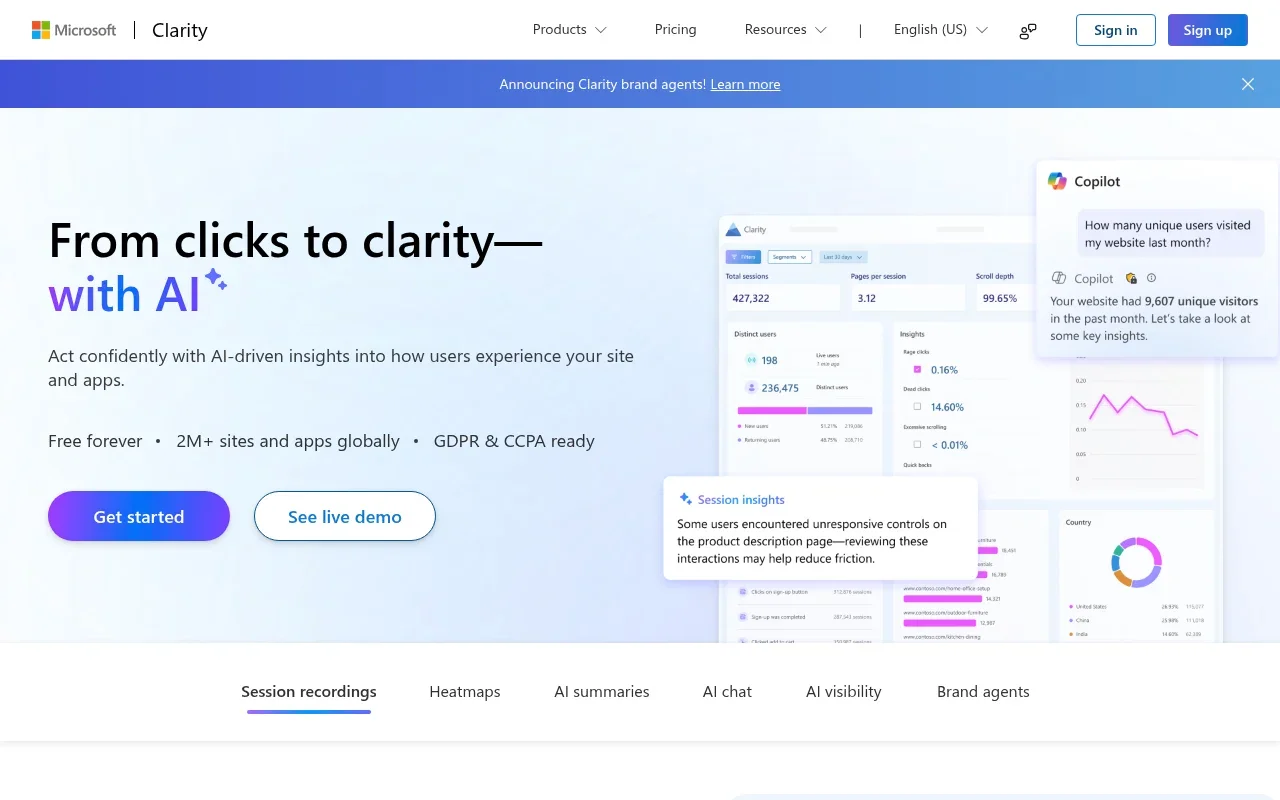
Typical usage relies on non-essential cookies, including first-party cookies such as _clck and third-party cookies such as CLID. Starting October 31, 2025, Microsoft Clarity began enforcing consent-signal requirements for page visits originating from the European Economic Area, the United Kingdom, and Switzerland, so a valid consent signal is required for full functionality in those regions.
Clarity retains heatmaps for up to nine months, allowing you to compare historical layouts against current redesigns. The tool generates visual reports quickly, often surfacing click data within thirty minutes of the interaction. This system validates hypotheses about missed calls to action or misleading navigation structures.
Configure your consent management platform to communicate with Clarity before initializing the tracking script. Segment your heatmaps carefully by device category and page variant. Do not blend mobile and desktop maps, and ensure you mask sensitive content programmatically. Treat a high-activity area as a hypothesis rather than a conclusion by pairing Clarity's visual data with a dedicated event-tracking system to confirm business impact.
3. Hotjar: Best For UX Feedback And Heatmaps
Hotjar excels when you need to combine visual heatmaps with direct user feedback, surveys, and qualitative research. The platform aggregates click, move, scroll, engagement, and rage-click behaviors into distinct visual layers.

By sampling cursor positions every 100 milliseconds to build movement maps, Hotjar creates detailed paths of mouse hover activity. This high-frequency tracking helps identify areas where visitors pause to read or hesitate before clicking. Hotjar also flags rage clicks, highlighting elements users repeatedly tap out of frustration when they mistakenly believe a target is interactive.
Visual overlays carry technical limitations, as Hotjar calculates percentages based on elements visible in a selected static screenshot. If your page features hidden dropdown menus or dynamic accordions, interactions inside those containers may not appear accurately on the base overlay. Furthermore, scroll maps spanning multiple URLs with different page heights distort average visibility calculations. Hotjar's standard tracking implementation powers these features using first-party cookies while processing IP addresses, user IDs, and behavioral information.
Define the exact page version and target device segment before analyzing a Hotjar map, avoiding aggregating traffic across materially different responsive layouts. Mask all forms and sensitive fields through the platform's privacy settings. Turn every qualitative observation you make in a heatmap into a measurable event, using an analytics platform to verify if fixing a rage-click issue improves your checkout conversion rate.
4. Matomo: Best For Owned Analytics Deployments
Matomo provides a mature analytics suite featuring integrated heatmaps and session recordings for organizations demanding total data ownership. Government agencies, healthcare providers, and enterprise security teams deploy Matomo on-premise to prevent behavioral data from flowing through third-party servers.
The Heatmap and Session Recording feature sets a first-party _pk_hsr cookie to maintain the session state. If you disable cookies entirely in your configuration, Matomo cannot guarantee that every page view in a visitor's journey will link to the same recording. The system treats this visual data as pseudonymized rather than fully anonymized, requiring you to mask page content and form data actively before transmission.
Your technical infrastructure directly impacts the quality of the visual data, since replay appearance depends entirely on the original HTML, CSS, images, and fonts loading correctly in the viewer. If your deployment pipelines remove old CSS assets, historical session replays will look broken or incorrectly styled, even though the underlying interaction data remains intact. To compare similar self-hosted recording capabilities, evaluate other open source session replay tools for your infrastructure.
Separate your base web analytics configuration from the optional heatmap and replay modules, and inventory all cookies and identifiers your instance generates. Configure strict client-side masking for inputs and sensitive page regions. After every major codebase release, test your responsive layouts, single-page application routes, and dynamic overlays thoroughly to ensure Matomo continues to capture visual elements accurately.
5. PostHog: Best For Product Analytics Teams
PostHog converges web analytics, product analytics, session replay, feature flags, experiments, and heatmaps into a single engineering suite. This platform fits software-as-a-service companies and application developers needing to measure complex technical behavior inside a logged-in product environment.
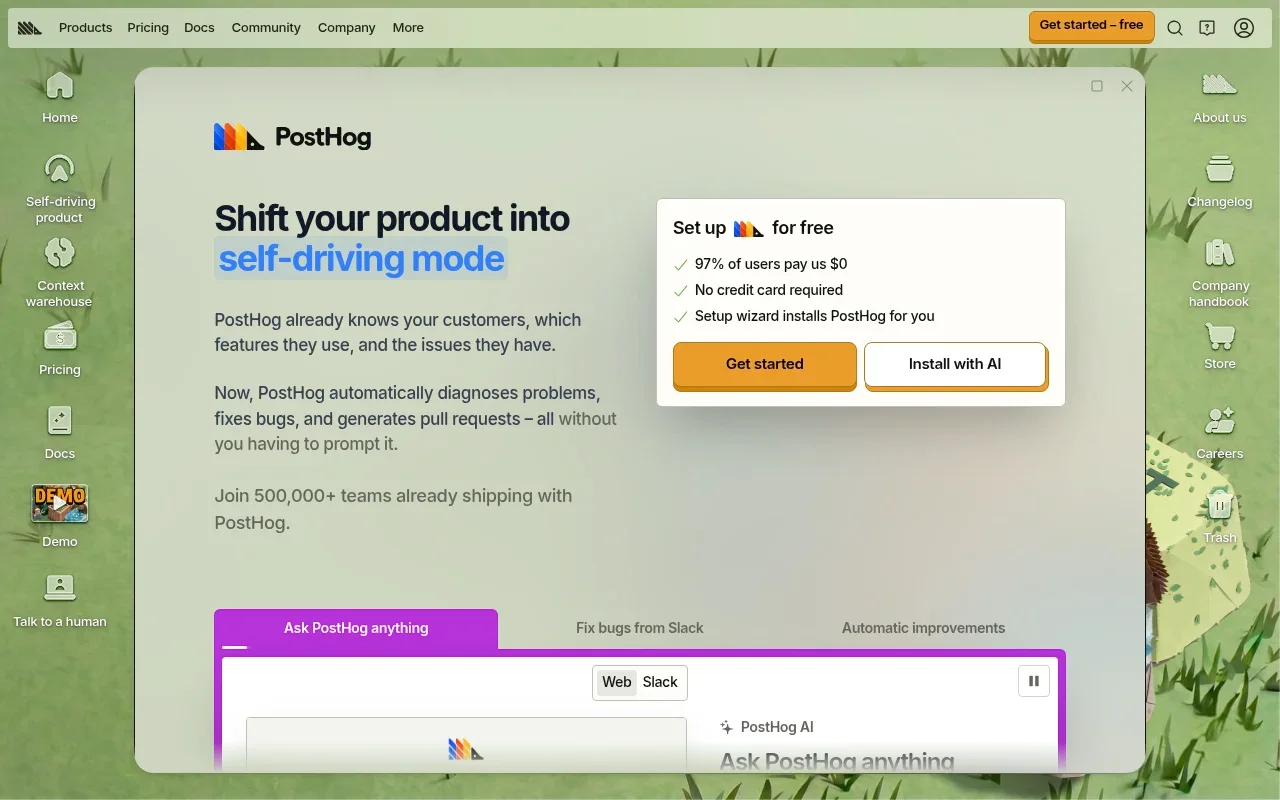
Shifting focus away from basic marketing-page attention toward product activation and feature adoption, PostHog lets you build detailed event taxonomies. These track when a user creates a project, invites a team member, or triggers a backend error. The integrated heatmap and replay tools then provide visual context for these highly technical user journeys.
A broad engineering toolset introduces complex privacy considerations, meaning your compliance posture depends entirely on your deployment choice, generated identifiers, event design, and enforced retention policies. Recording a logged-in SaaS environment carries a much higher risk of capturing personally identifiable information than monitoring a public blog post.
Define a minimal, strict event taxonomy using standard naming conventions like project_created and activation_complete before deploying the tracking snippet. Prohibit your engineering team from passing names, emails, authentication tokens, free-text inputs, or sensitive query parameters into event properties. Connect your A/B experiments to one primary conversion event, and review replay masking and data access controls with your security team before launching.
6. OpenReplay: Best For Self-Hosted Replay
OpenReplay operates as a replay-first alternative for engineering teams requiring deep session debugging capabilities deployed on their own cloud infrastructure. While other tools focus on marketing funnels or UX surveys, OpenReplay connects user behavior directly to technical application performance.
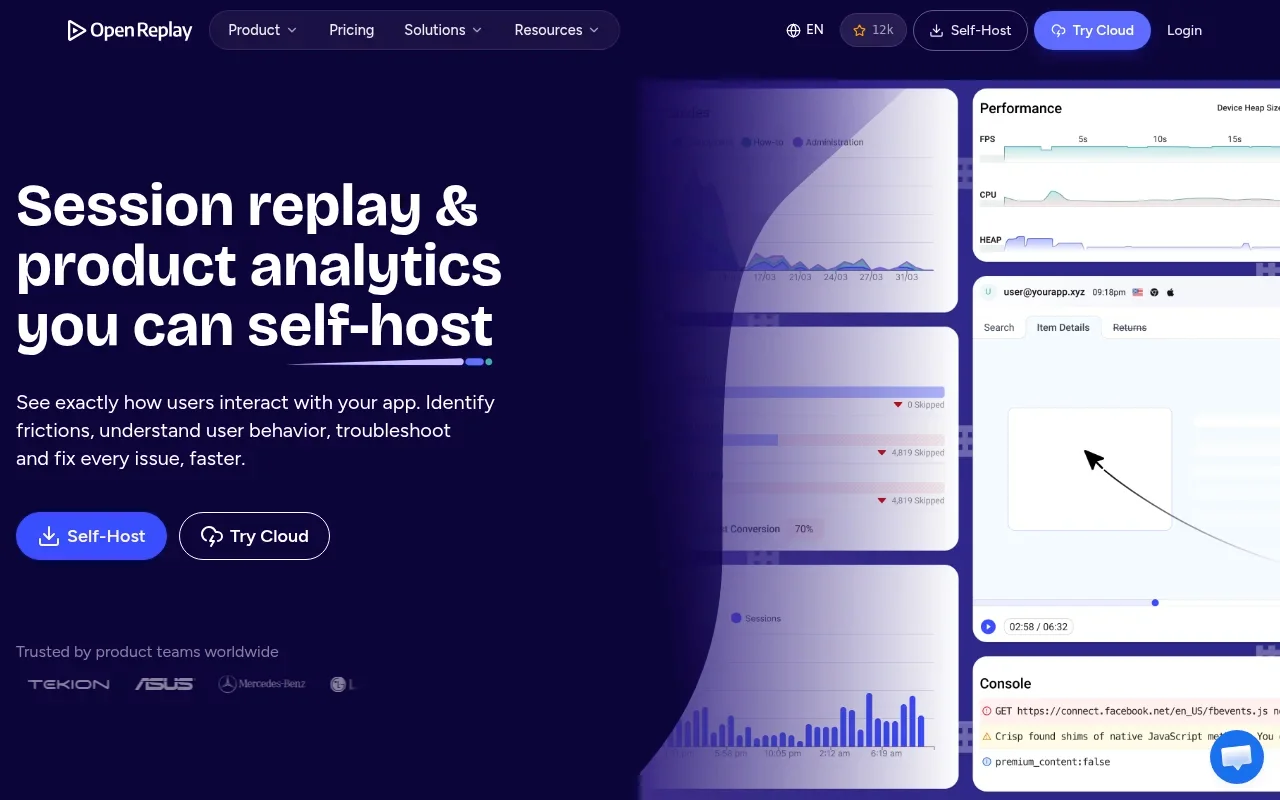
The platform offers a Private Mode that obscures visible text, network payload data, and console logs directly at the source. This client-side obscuring prevents sensitive application data from reaching your database. You can use OpenReplay to inspect the specific network requests, state changes, and JavaScript errors that fired exactly when a user clicked a broken button.
Because OpenReplay does not attempt to be a complete traffic attribution or SEO reporting suite, you will still need a baseline analytics platform to measure campaign performance, organic search visibility, and top-level conversion funnels. Instead, the tool serves strictly as a technical diagnostic layer for application interfaces.
Enable Private Mode comprehensively before collecting any sessions, and exclude authentication routes, payment gateways, health portals, and customer support pages from your recording targets unless you have a documented engineering requirement. Inspect network payloads during staging to verify masking. Finally, set aggressive, short retention periods and configure the tool to sample sessions tied exclusively to known errors rather than recording every successful visit indefinitely.
Moving beyond basic click maps allows you to measure the complete user journey. Swetrix gives you privacy-first traffic analytics, custom events, conversion funnels, and technical SEO monitoring in one cookieless dashboard, with masked session replays available exactly when you need them. Start your free Swetrix trial today..