- Date
Best Website Monitoring Tools 2026
 Andrii Romasiun
A successful HTTP status code only proves that the monitored request received a success response. When a monitoring service pings your endpoint and receives a 200 OK, the basic reachability test passes, but that green checkmark reveals nothing about whether real visitors experienced a broken checkout, encountered a blank screen caused by a JavaScript error, or abandoned a slow landing page.
Observing multiple layers of the application stack helps detect and diagnose modern incidents. An external HTTP or ping check confirms reachability, while synthetic transaction tests check whether specific workflows, such as a login screen or shopping cart, function from a given geographic location. Beyond basic uptime, real-user monitoring measures the page load speed visitors experience in their own browsers. Because error tracking captures code-level failures that can break interfaces silently, product analytics can then show whether a performance degradation coincided with a conversion drop-off. Finally, on-call alert workflows can route a threshold breach to the right engineer.
Finding the best website monitoring tools in 2026 requires matching these specific layers to your operational reality. A content site might need a basic availability alert combined with privacy-focused traffic analytics, whereas a revenue-focused software platform demands continuous synthetic testing, deep error tracking, and rapid incident escalation.

Quick Verdicts and Evaluation Criteria
We evaluate monitoring platforms across seven specific criteria: coverage of the monitoring layers, diagnostic depth, privacy and data control, alerting capabilities, setup simplicity, agency or multi-site fit, and price transparency. Prices and limits reflect a September 14, 2026 snapshot and depend heavily on the specific tier selected.
| Tool | Best for | Monitoring type | Privacy model | Free plan / trial | Starting price | Main limitation |
|---|---|---|---|---|---|---|
| Swetrix | Privacy-first analytics, performance, errors, funnels, and SEO context | Cookieless analytics, RUM, errors, funnels, optional replays | No cookies, transient IP processing, privacy-focused standard analytics | 14-day trial, payment method required | £15/month + VAT (Standard, 100k events) | Requires a companion tool for external uptime pings |
| UptimeRobot | Straightforward reachability alerts | External HTTP, API, ping, SSL, domain expiry | Standard SaaS | 50 monitors, 5-minute interval | $12/month (annual billing) | Lacks visitor behavior and conversion data |
| Better Stack | Incident response and status communication | Uptime, transactions, on-call schedules, traces, logs | Standard SaaS | 10 monitors and heartbeats, 1 status page | $34/license/month | Operationally complex for simple projects |
| Site24x7 | Multi-region synthetic tests | Global synthetic, transactions, RUM | Standard SaaS | Free forever, up to 50 resources | $9/month (annual billing) | Steep learning curve for basic users |
| Pingdom | Historic synthetic plus RUM | Uptime, page speed, RUM, transactions | Standard SaaS | Trial terms vary | Usage-based calculator | Unpredictable budget planning |
| Google Search Console | Search visibility and index health | Indexing, Core Web Vitals, organic clicks | Google ecosystem | Free | Free | Cannot monitor application uptime or specific transactions |
1. Best Overall for Privacy-First Analytics and Product Monitoring: Swetrix
Monitoring traffic without understanding performance leaves you blind to why visitors abandon your site. Swetrix closes that gap by combining cookieless analytics with performance monitoring, JavaScript error tracking, conversion funnels, and search visibility insights. Instead of running a fragmented stack where errors live in one dashboard and traffic in another, you can see how technical failures impact user journeys from a single interface.
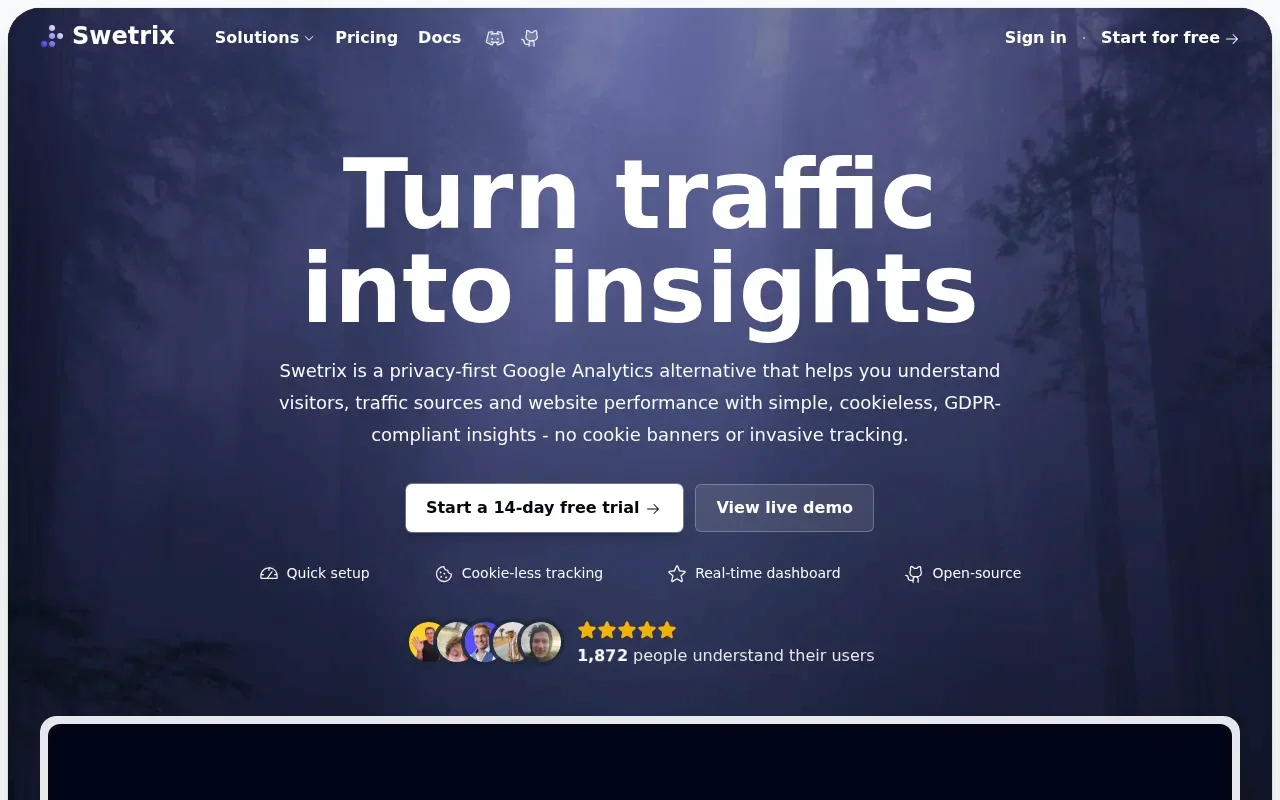
According to the published Swetrix Data Policy, standard analytics operates without cookies, local storage, or persistent client-side identifiers, and the system doesn't permanently store personally identifiable information such as IP addresses. Swetrix describes its standard analytics as designed for GDPR, CCPA, and PECR compliance, but optional session replay requires separate masking and legal review. That distinction means standard analytics may reduce the need for cookie-consent prompts, while replay settings still depend on how your site collects and displays visitor data.
Coverage extends beyond basic pageviews because the standard tier includes performance monitoring that surfaces slow load times across different browsers and countries. If a specific device type struggles to render a page, you can compare that degradation with the conversion data in the same interface. You can also configure alerts for selected events and JavaScript errors, routing notifications through supported email or team channels. When a frontend script breaks, the error tracking module captures the failure so developers can investigate the page and session associated with it.
The platform's SEO and GEO insights add search visibility context to on-site behavioral data. If an organic landing page loses traction, you can compare search performance with on-site behavior to investigate whether an indexing issue or a broken layout contributed to the decline. To validate machine readability, you can monitor how AI search engines crawl your content by running problematic URLs through an AI search LLM crawlability checker.
Setup remains straightforward since a single lightweight script initiates standard tracking, while advanced diagnostic features exist behind explicit technical triggers. Session replay, available on Cloud plans, does not start automatically; it requires developers to fire a startSessionReplay() call. Depending on your configuration, these recordings capture the page state, DOM changes, and non-password inputs. Because replay functionality can capture sensitive interactions, the explicit trigger lets you choose which sessions to record, but you still need to configure masking and assess the applicable notice, consent, or other legal basis.
For agencies and B2B software providers, the platform scales across client portfolios. Its current plan limits include 10 websites on Standard and 100 on Plus, while Enterprise adds on-premise installation, isolated instances, SAML single sign-on, and a dedicated account manager. Managing multiple properties becomes straightforward when you handle all client data within one consistent multi-site analytics management structure.
Price transparency is a priority. Swetrix's current pricing page lists its Standard plan at £15 per month plus VAT where applicable for 100,000 monthly events, with performance monitoring, funnels, error tracking, and SEO & GEO insights. The Plus plan costs £29 per month plus VAT where applicable and adds session replays, feature flags, and A/B testing. Both tiers include a 14-day trial, and a payment method is required to start it.
Swetrix delivers broad on-site behavioral context, but it does not perform external synthetic uptime checks from outside your server infrastructure. To measure pure endpoint availability and network routing, pair Swetrix with a dedicated synthetic uptime service.

2. Best Simple Uptime Monitor: UptimeRobot
When the primary question is whether an endpoint responds to external traffic, UptimeRobot provides the clearest answer. This service focuses on reachability, verifying that web servers, APIs, and network ports remain accessible from the outside internet, making it an ideal external companion to an on-site analytics platform.
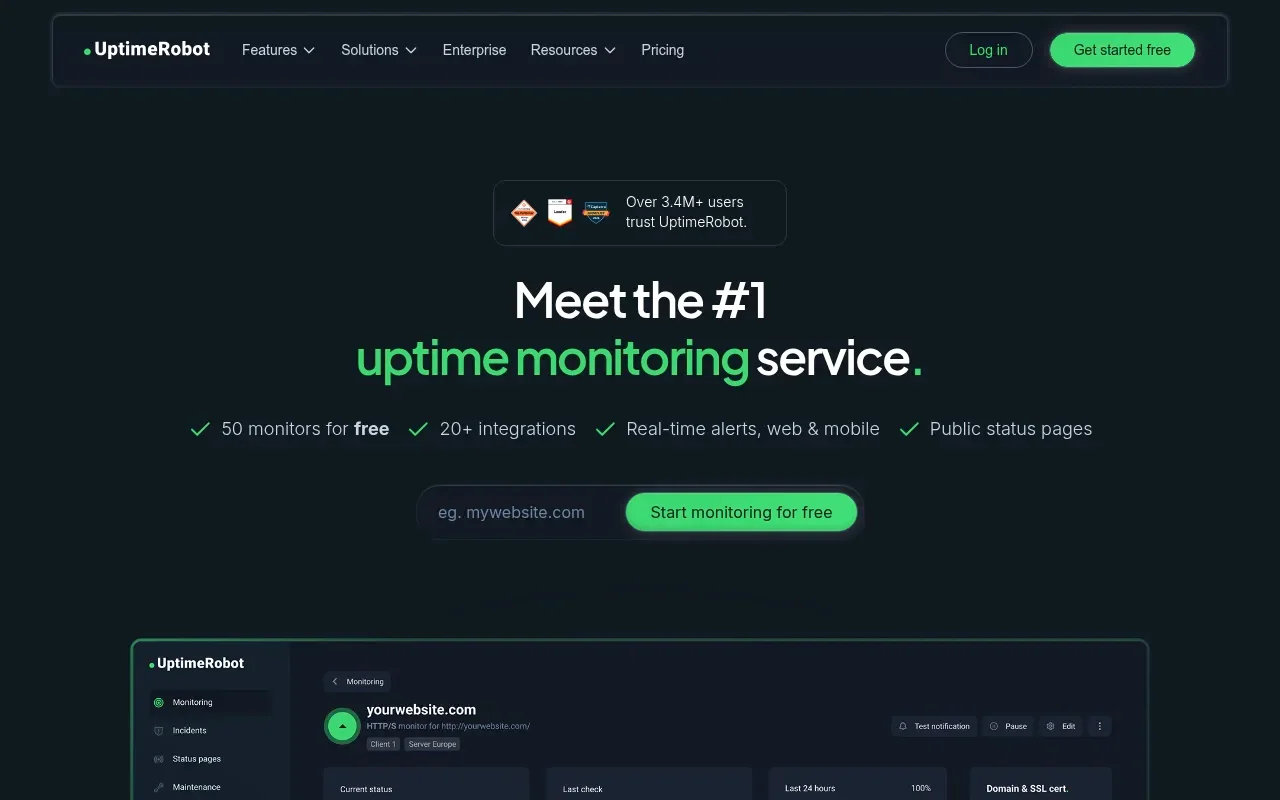
UptimeRobot excels at clear setups and targeted alerting. Configuring a new HTTP or HTTPS check involves pasting a URL and setting an interval so the system can poll that address continuously. If the server fails to return an accepted response, UptimeRobot can trigger an alert. Notifications route through email, SMS, voice calls, or integrations with Slack, Discord, and PagerDuty. To validate bulk responses internally before adjusting monitors, run target URLs through an HTTP status bulk checker to confirm exact header configurations.
Coverage spans beyond basic web endpoints. The platform monitors keyword presence, verifying that a specific database-driven word renders on a page. This helps detect silent database connection failures where a server still returns a 200 OK. Infrastructure checks include ping limits, specific port monitoring, domain expiry warnings, and SSL certificate validation.
Diagnostic depth is deliberately shallow. UptimeRobot informs you that a server stopped responding, but it offers little insight into user behavior, client-side application state, or conversion loss during the outage, because it acts as an alerting mechanism rather than a product analytics suite.
The UptimeRobot pricing page lists the Free tier with 50 monitors and five-minute checks. Solo adds 60-second checks and broader monitoring options. Those faster checks make UptimeRobot a fit if you require short intervals and straightforward outage alerts, while a primary analytics tool handles behavioral data.
3. Best for Incident Response: Better Stack
Software engineering teams need more than an alert when a critical service goes down; they require a coordinated operational response. Better Stack integrates uptime monitoring with deep incident management, on-call scheduling, and public status communication.
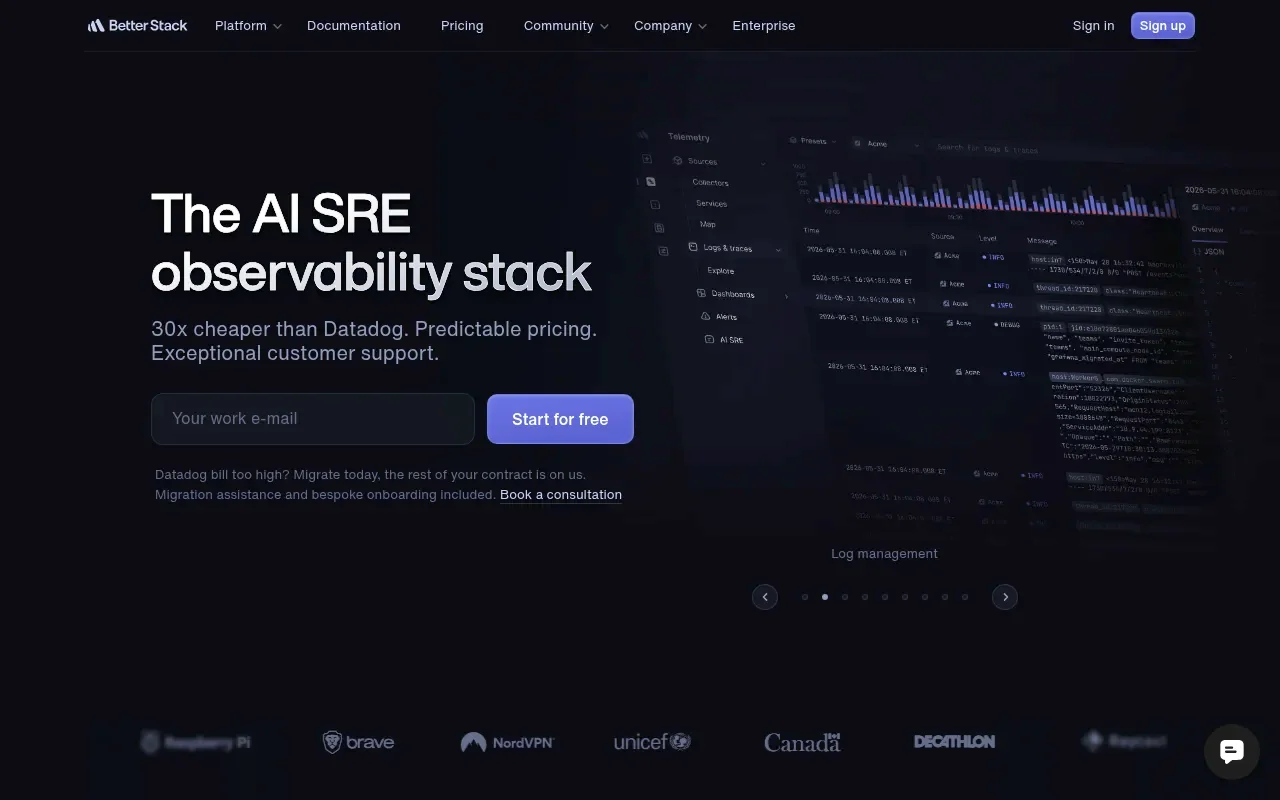
Alerting is where Better Stack stands out. A broken database query can create an incident, route it through the current on-call schedule, and escalate through configured rules. The platform also supports synthetic transaction monitoring, heartbeats for cron jobs, public status pages, and telemetry intake including logs, traces, and metrics.
Diagnostic depth extends into server infrastructure. By ingesting application logs and traces alongside uptime data, engineers can investigate the server exception associated with downtime. This code-level observability contrasts sharply with tools that measure only the browser experience.
Coverage is extensive for system health, but it solves a different problem than product analytics. Better Stack answers who was notified and how the engineering team contained the damage, but it does not map the business impact, funnel abandonment, or organic search degradation that followed the incident.
The current Better Stack pricing page lists a free personal-project tier with 10 monitors and heartbeats plus one status page. Responder pricing starts at $34 per license per month, or $29 when billed annually, and white-label status pages are listed at $250 per page per month, or $208 per page per month when billed annually. That breadth makes Better Stack overkill for a basic blog but structurally practical for a revenue-heavy SaaS product.

4. Best for Agencies and Global Synthetic Checks: Site24x7
Global applications fail differently across regions. A DNS routing issue might block users in Europe while North American traffic flows normally. Site24x7 addresses this fragmentation by executing synthetic tests from specific locations around the world to check whether a workflow succeeds across variable network conditions.
Diagnostic depth relies heavily on transaction monitoring. Instead of only loading a homepage, Site24x7 can simulate clicking a login button, entering credentials, and verifying that the authenticated dashboard loads within a specified time limit. This checks whether background authentication services, database connections, and frontend rendering cooperate successfully. Real-user monitoring tracks page load times, allowing you to compare the synthetic baseline against the delays experienced by browsers in the field.
The platform fits agencies managing complex client infrastructure. Administrators can group monitors by client, define maintenance windows to suppress alerts during scheduled deployments, and generate detailed SLA compliance reports. To verify that the monitoring data aligns with contractual guarantees, calculate specific required availability percentages manually with an uptime SLA calculator.
Data control and privacy follow a traditional IT observability model that prioritizes infrastructure telemetry over cookieless user tracking. The platform's breadth across network, server, cloud, and website monitoring creates a steep learning curve, and the interface caters to system administrators hunting for infrastructure bottlenecks rather than marketers tracking campaign conversions.
The free tier advertises up to 50 monitored resources with instant downtime email alerts, while the Web Uptime package costs $9 per month with annual billing or $10 monthly. It includes 25 websites, transaction monitors, 32 monitoring locations, and a one-minute polling interval, according to Site24x7's current pricing page. The same page lists a ten-second minimum polling frequency in its detailed comparison, while monitoring-location counts vary by plan.
5. Best for Synthetic Monitoring Plus RUM: Pingdom
Pingdom combines synthetic availability checks with real-user monitoring. It remains a mature choice if you want historical performance data and straightforward page speed reports without migrating to a massive observability platform.
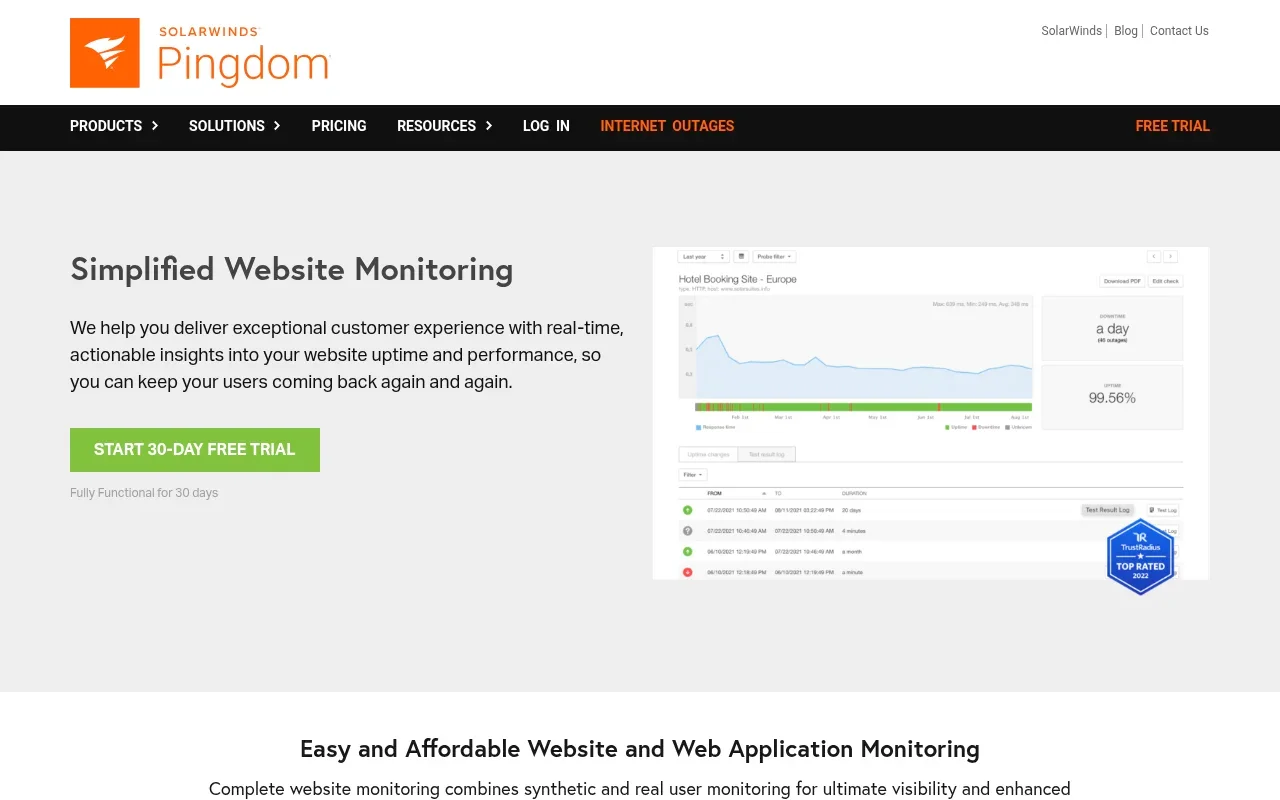
Coverage includes standard external uptime checks, transaction monitoring for high-priority workflows, and dedicated page speed analysis. The RUM capability filters performance data by geography, browser, and device, which helps identify why a recent code deployment slowed down mobile rendering in a specific market. Retention terms should be checked for the selected plan before you rely on year-over-year comparisons.
Setup complexity is moderate. Configuring basic uptime checks takes seconds, but writing and maintaining transaction scripts requires ongoing developer attention. Alerts route through email and SMS, tying into custom public status pages that keep stakeholders informed during maintenance windows.
Price transparency is the main drawback for quick budget evaluations. Pingdom's pricing depends on the volume of pageviews and synthetic checks, so organizations need to estimate usage before committing to a plan. Check the current plan terms before comparing it with flat-rate tools.
6. Best SEO Monitoring Companion: Google Search Console
Search visibility determines whether visitors ever reach your infrastructure. Google Search Console monitors the relationship between your website and the Google search index. While it cannot send an alert when your server crashes, it serves as an official source for how Google reports your site's search performance and indexing status.
Coverage targets search mechanics exclusively. The platform reports on organic search performance by queries, pages, and countries. It flags indexing errors, indicating when a server configuration or a restrictive robots.txt file blocks Googlebot from crawling your content. The URL Inspection tool evaluates individual pages, while the Core Web Vitals report grades field data for loading performance, interactivity, and visual stability.
Diagnostic depth focuses on algorithmic health rather than application state. If Google issues a manual penalty or detects a security issue like a malware infection, Search Console provides the official notification, though it offers no insight into what a visitor does after clicking a search result.
Search Console and Google Analytics cover different stages of the visitor journey. Google Search Central explains that Search Console focuses on activity before a visitor arrives from Google Search, while Analytics reports interactions after arrival, so the two tools use different scopes and can show different totals. These differences can result from missing Analytics tags or users opting out of tracking.
Because it operates within the Google ecosystem, Search Console costs nothing. It remains a useful monitoring layer that pairs well with on-site analytics and external availability tools to complete the technical picture.
One Tool or a Layered Stack?
No single platform excels at every layer of website monitoring. Your technical architecture and business model dictate how many tools you need to run concurrently.
Content creators and bloggers require the lightest configuration. You can run Swetrix Standard for privacy-first traffic, performance, and SEO insights while relying on UptimeRobot Free for a basic ping that ensures the server stays online. This approach provides excellent visibility without inflating monthly software costs.
Agencies and SMB marketers face stricter client expectations. Combining Swetrix Plus with a dedicated external monitor covers behavioral analysis, funnel tracking, session replay, and availability alerting. If clients demand complex multi-region testing, replacing UptimeRobot with Site24x7 helps verify that localized campaigns load properly across selected regions.
Ecommerce and SaaS companies operate in environments where seconds of downtime cost revenue. In these scenarios, layer Swetrix Enterprise or Plus for analytics and conversion funnels alongside Better Stack. This layered setup can page the on-call engineer, keep customers informed through a status page, and give the product team a way to analyze behavioral fallout in a cookieless dashboard.
Your monitoring stack should expose technical failures without violating user privacy. Start capturing cookieless performance data, JavaScript errors, and conversion funnels by evaluating the 14-day trial at Swetrix.