- Date
How To Measure Website Drop Off Rate Effectively
 Andrii Romasiun
A visitor lands on your pricing page, clicks the trial button, enters their email, and then closes the tab on the billing screen. That abandoned session represents a funnel bottleneck. Learning how to measure website drop off rate helps you pinpoint exactly where users leave multi-step processes, which reduces cart abandonment and increases overall conversions. Map these flows entirely using privacy-friendly tools like Swetrix to optimize the user journey without relying on invasive tracking methods.
What Is Website Drop-Off Rate?
Tracking user progression requires understanding the difference between isolated pageviews and connected actions. A drop-off occurs when a user abandons a predefined sequence of steps before reaching the final conversion point.
Drop-Off Rate vs. Bounce Rate
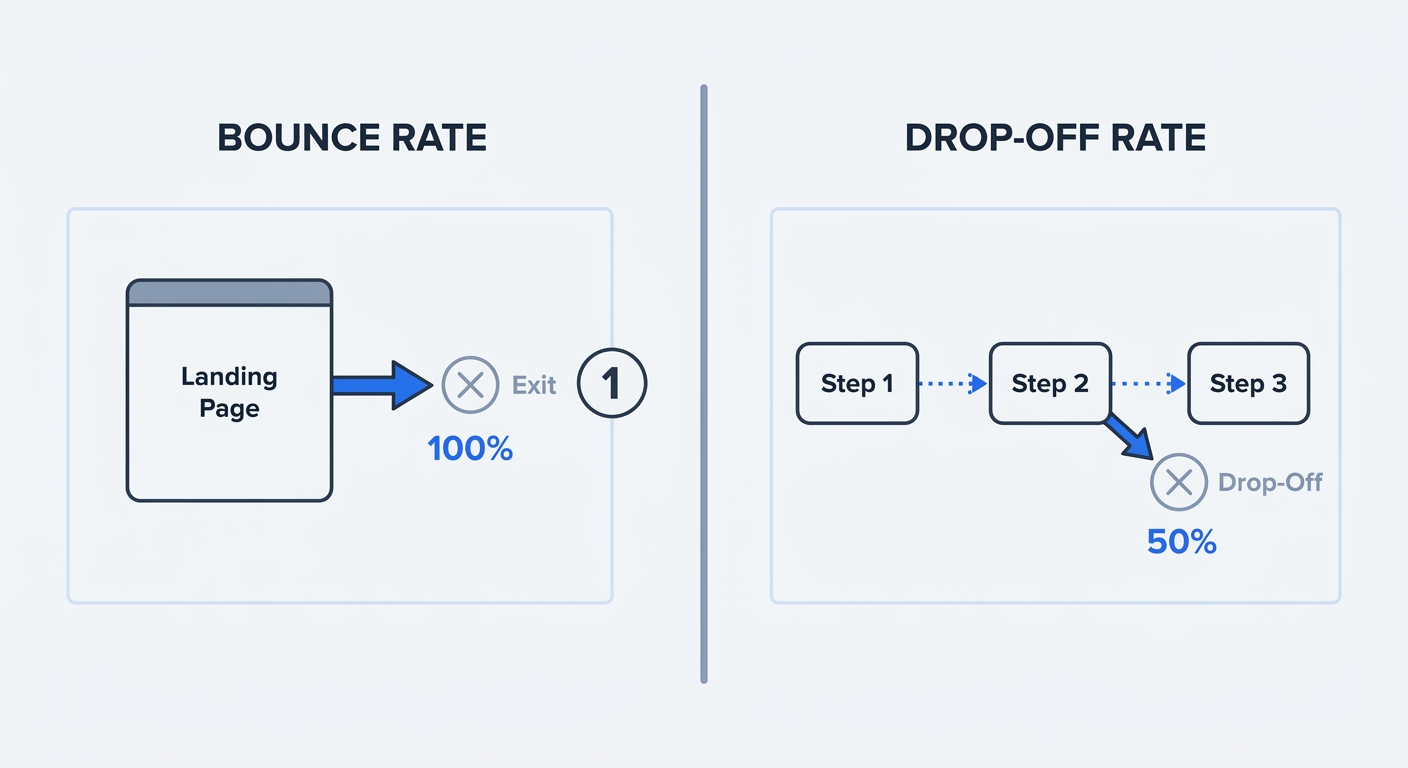
Bounce rate measures single-page exits, such as when a visitor lands on a blog post, reads it, and leaves without clicking anything else. The cross-industry median bounce rate sits at 47.4 percent, but this metric varies heavily by source. Paid search traffic bounces at roughly 38.6 percent, while display ad traffic often exceeds 65 percent.
While bounce rate measures single-page exits, drop-off rate measures abandonment within a multi-step flow like a checkout sequence, onboarding tutorial, or multi-page form. Calculate it by dividing the number of users who failed to complete the process by the total number of users who started it, then multiplying by one hundred. If one thousand people add an item to their cart and three hundred complete the purchase, seven hundred dropped off, resulting in a 70 percent drop-off rate.
The Financial Impact of Funnel Leaks
Ignoring abandoned flows costs digital businesses heavily. US and EU e-commerce sites lose an estimated $260 billion in sales each year due to recoverable checkout drop-offs. Failing to measure the intermediate steps between adding a product and confirming the payment leaves revenue on the table.
Traditional analytics platforms historically relied on third-party cookies to track these user journeys, a method that carries heavy compliance risks under modern privacy regulations like GDPR and CCPA. Swetrix solves this by mapping complex multi-step flows without cookies. The privacy-first platform aggregates event data to show exactly where users stall, providing the insights needed to fix a funnel without collecting personally identifiable information.
Average Drop-Off Rates by Industry
Setting realistic optimization goals requires comparing metrics against relevant benchmarks. A perfectly optimized checkout will still experience abandonment, and understanding the baseline prevents over-engineering a page that already performs well.
E-commerce and Mobile Variances
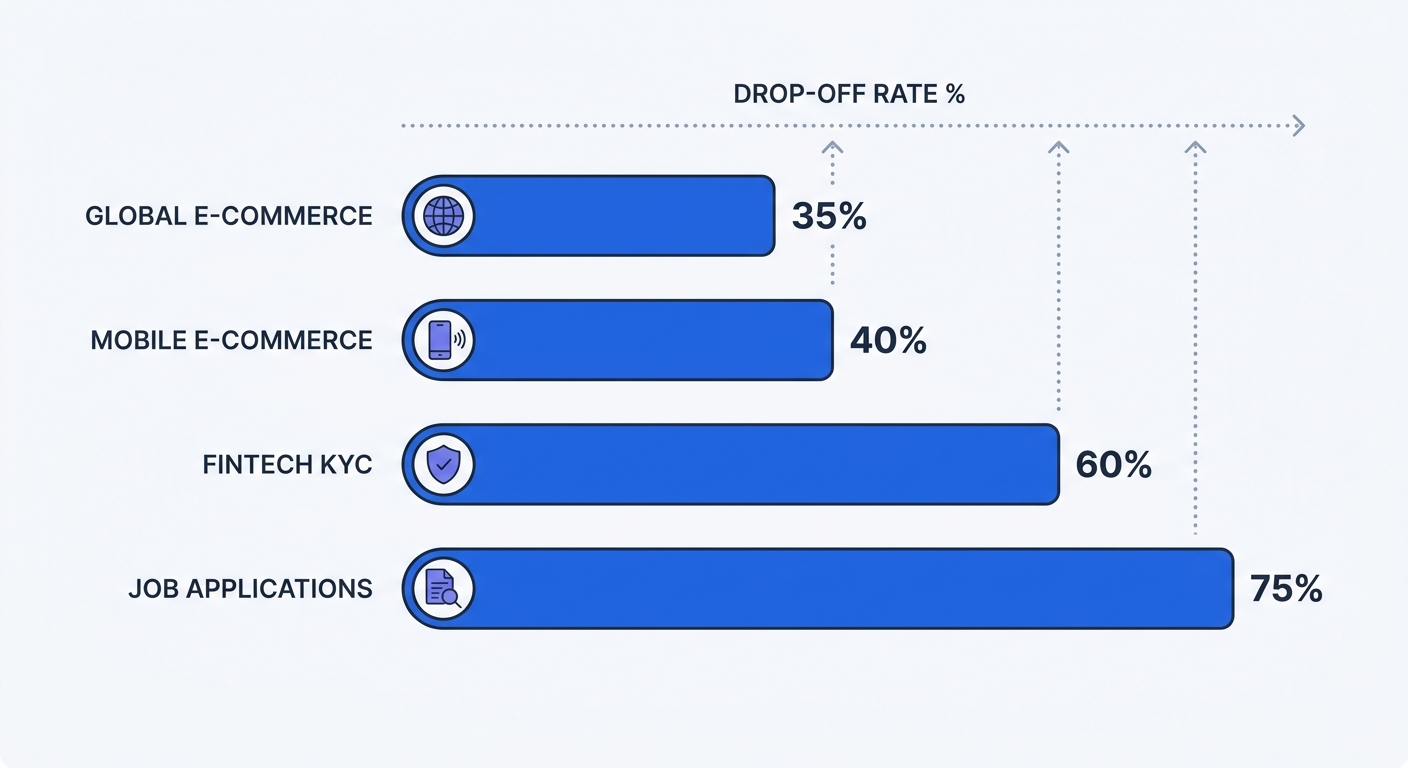
The average global online shopping cart abandonment rate sits at 70.22 percent. This number fluctuates depending on the device the customer uses, with desktop users abandoning carts at a rate of 66.41 percent compared to 80.02 percent for mobile users. Mobile screens amplify friction because tiny input fields, complex navigation, and slow loading times on cellular networks push users away. If a blended drop-off rate looks unusually high, separate desktop traffic from mobile traffic to identify mobile-specific UI problems rather than a general lack of intent.
SaaS, Fintech, and Recruitment
Different business models experience distinct abandonment patterns based on the user commitment required:
- Fintech Onboarding: Financial applications require heavy identity verification. Roughly 60 percent of users who initiate a fintech signup flow abandon the app before completing their Know Your Customer documentation, as asking for government ID creates massive friction.
- B2B SaaS: The average business software website conversion rate ranges from 0.9 to 2.3 percent. The journey from a landing page visit to a booked demo or paid subscription contains dozens of micro-decisions.
- Recruitment: Lengthy applicant tracking systems repel talent. Job application forms see an average drop-off rate of 45 to 60 percent because requiring users to upload a resume and then manually type their work history guarantees high abandonment.
Segment analytics by traffic source to maintain accurate data. Organic search visitors carry higher intent than users who clicked a low-cost display ad, so evaluating the drop-off rate of paid social campaigns independently from direct traffic prevents misdiagnosing a traffic-quality issue as a broken website flow.
How To Measure Website Drop Off Rate in Practice
Identifying a general leak in the system is only the first step toward optimization. Granular visibility into the specific form field or button causing the exit provides the actionable data needed to fix it.
Setting Up Granular Micro-Funnels
Viewing an entire checkout process as a single metric hides bottlenecks. Break the broad sequence into granular micro-funnels by isolating every distinct action the user must take.
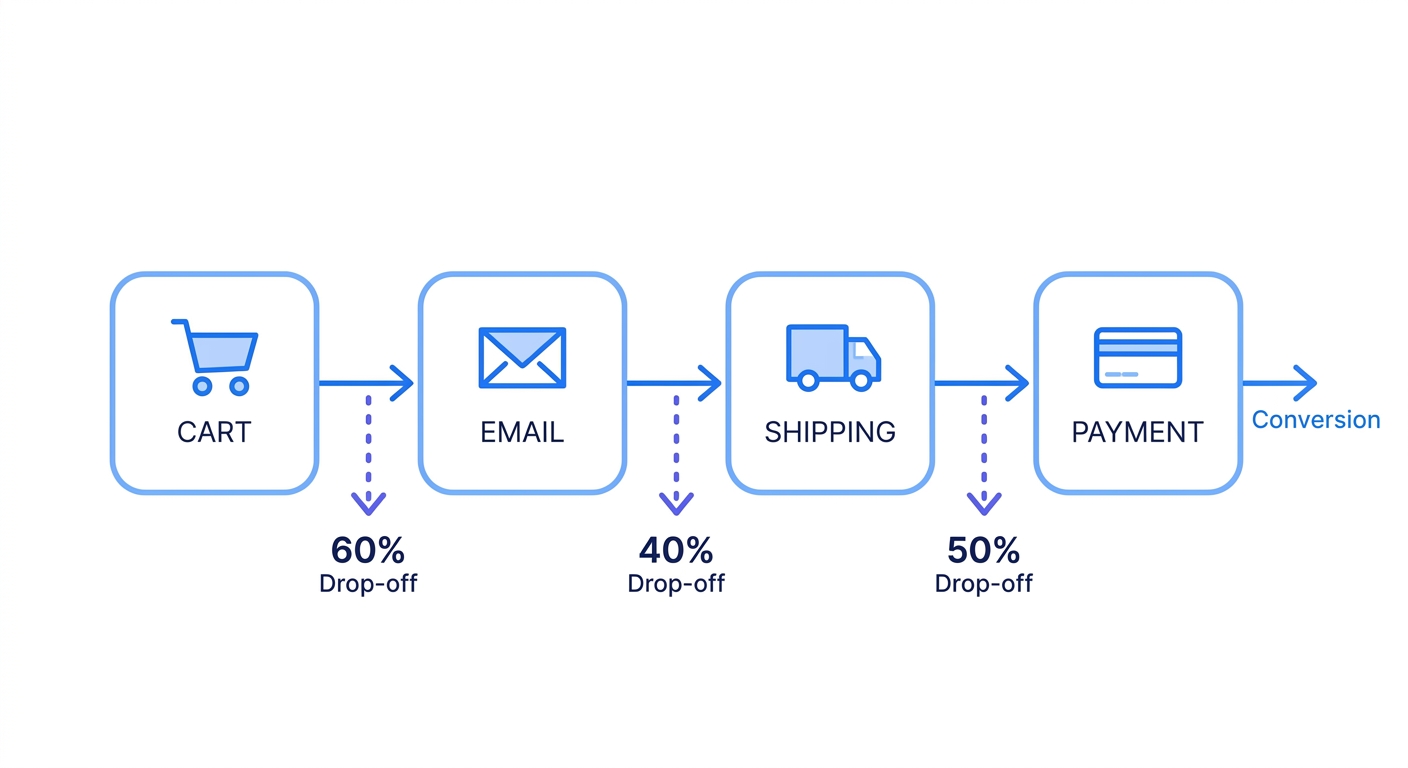
- Define the exact sequence: Map out the exact steps. A standard flow includes Cart View, Email Entry, Shipping Address, Payment Details, and Order Confirmation.
- Tag every event: Add a tracking script or custom event trigger to each specific button click or form submission in the sequence.
- Calculate the step-to-step loss: Compare the volume of users at step two against the volume at step one.
If an overall checkout drops 70 percent of users, high prices might seem like the culprit. A micro-funnel analysis might instead reveal that 95 percent of users pass the email step and 90 percent pass the shipping step, before 85 percent drop off specifically at the payment field. Isolating this exact bottleneck proves the problem lies with the payment gateway rather than the product pricing.
Tracking With Privacy-First Analytics
Measuring these steps does not require invasive user profiling. Swetrix handles this through custom event tracking without tag manager complexity, allowing you to trigger an event in the application code every time a user successfully completes a form section.
Here is a basic example of tracking a multi-step form completion using standard JavaScript alongside Swetrix:
// Trigger this when the user saves their shipping details
document.getElementById("shipping-form").addEventListener("submit", function () {
  swetrix.track({
    ev: "completed_shipping_step",
    meta: { step: 2 },
  });
});

// Trigger this when the payment fails
function onPaymentError(errorType) {
  swetrix.track({
    ev: "payment_failed",
    meta: { reason: errorType },
  });
}
Logging these specific interactions populates the analytics dashboard with an aggregated view of user progression, showing exactly how many users moved from the shipping event to the payment success event. Analyzing aggregated flows proves that effective conversion optimization does not require tracking individual people across the web. Monitoring where the volume of traffic halts keeps the business compliant with privacy laws while providing accurate behavioral data.
Top Causes of High Drop-Off Rates
Users abandon multi-step forms for predictable reasons, and fixing a broken funnel involves removing friction rather than adding new features.
Hidden Costs and Account Friction
The checkout screen is the worst place to introduce new information. 48 percent of users abandon flows due to unexpected shipping fees or taxes, often because adding a twenty-dollar delivery fee to a fifty-dollar cart breaks the customer's mental commitment to the purchase. Move shipping calculators directly to the product page and display flat-rate delivery costs near the add to cart button. Customers are far less likely to abandon the payment screen when they know the final price upfront.
Forced registration creates an equally massive barrier, causing approximately 26 percent of users to drop off when a website mandates account creation before a purchase. E-commerce sites treat forced accounts as a marketing strategy to capture emails, but this blocks revenue. Implement a prominent guest checkout option instead, and ask the user to save their information to create an account on the final order confirmation page after securing the transaction.
Consumer Trust and Data Privacy
Modern internet users scrutinize where they input personal information, with around 18 percent abandoning carts due to a lack of trust in payment and data security. Poorly designed forms, missing SSL certificates, or vague data policies drive visitors away.
Analytics infrastructure can serve as a direct trust signal. Relying on privacy-focused tools rather than invasive advertising trackers allows sites to display a cookie-free badge near email capture forms. Because the Swetrix platform is open-source and GDPR compliant, linking out to a transparent website privacy policy reassures customers. Telling users that their data is not sold to third-party ad networks reduces anxiety and lowers drop-off rates at sensitive data-entry stages.
Advanced Strategies to Reduce Drop-Offs
Acquiring new visitors costs more every quarter, with the overall cost per website visit rising by 9.4 percent between 2023 and 2024. Marketers can no longer afford to buy cheap traffic to compensate for a leaky website, meaning budgets must shift toward optimizing existing traffic.
AI-Powered Recovery Interventions
Traditional cart recovery relies on sending automated emails hours after the user has left. These standard email campaigns capture a marginal 3.33 percent recovery rate because the user has already moved on, purchased from a competitor, or lost interest.
Modern conversion strategies intercept the user before they close the tab. AI-powered pre-abandonment tools detect exit intent in real time by monitoring cursor velocity, scrolling patterns, and idle time. When the software detects a likely exit on a checkout page, it triggers a targeted intervention like a dynamic discount code or a chat widget offering support. Intercepting users at the exact moment of hesitation recovers 30 to 38 percent of at-risk sessions.
Behavioral Analytics and Error Tracking
While quantitative analytics identify where a user left, behavioral tools explain the cause. Staring at a high drop-off metric on a specific step does not fix the underlying code issue, so pair funnel data with diagnostic tools.
Monitor the frontend for broken code, as users cannot progress if an API fails to load shipping rates. Swetrix offers built-in error tracking that logs JavaScript exceptions as they happen. Cross-referencing drop-off rate spikes with error logs isolates the technical failure.
Review the performance of individual pages. A three-second delay on a payment processing button often results in duplicate clicks, failed charges, or rage-quitting. Use website performance monitoring to ensure critical funnel steps load instantly, which eliminates the invisible friction driving up drop-off rates.
Stop losing revenue to broken funnels and blind analytics. Swetrix provides privacy-first, cookie-free data to map user journeys and eliminate drop-offs without compromising compliance. Plans start at $19/month for 100,000 events. Start your 14-day free trial today and pinpoint exactly where visitors leave the funnel.