- Date
How To Measure Core Web Vitals For Better Rankings
 Andrii Romasiun
Google penalizes slow websites. Delayed button clicks frustrate users and drive them away before the content renders. Declining engagement forces search rankings to drop. Monitoring performance prevents these issues and protects your traffic.
Website owners often attempt to fix speed issues by installing more monitoring tools. These heavy analytics platforms cause the exact slowdowns they claim to measure. Switch to privacy-focused, cookieless web analytics to track loading times without blocking the browser thread. Swetrix captures performance data on page load without bogging down your infrastructure.
What Are Core Web Vitals?
Google evaluates user experience using three specific performance metrics. These numbers determine how search algorithms rank your website against competitors. Google's official interaction guidelines dictate strict passing thresholds for every URL, though acceptable load times vary by content type and industry standards.
The Three Key Metrics to Track
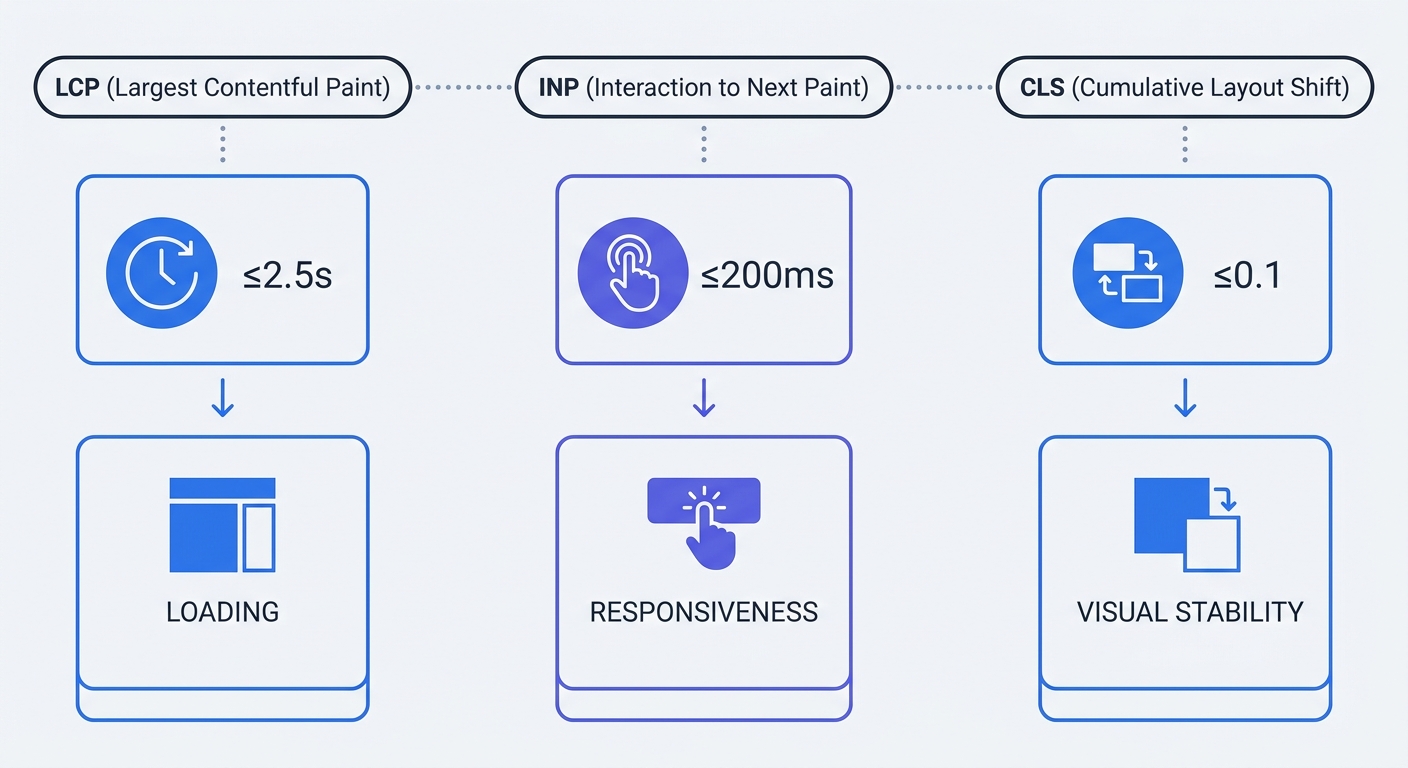
The algorithm checks loading speed, visual stability, and interactivity.
- Largest Contentful Paint (LCP): Measures loading performance. The timer starts when the user requests the URL and stops when the browser renders the largest text block or image in the viewport. Keep this duration under 2.5 seconds.
- Interaction to Next Paint (INP): Measures interactive responsiveness. This metric replaced First Input Delay in March 2024 to track latency across the entire page lifecycle. Keep the delay between a user click and the resulting visual change under 200 milliseconds.
- Cumulative Layout Shift (CLS): Evaluates visual stability. The browser calculates the shifting of visible content during the lifespan of the page. Keep this layout shift score below 0.1.
| Metric | Focus Area | Passing Threshold | Poor Threshold |
|---|---|---|---|
| LCP | Loading Speed | ≤ 2.5 seconds | > 4.0 seconds |
| INP | Interactivity | ≤ 200 milliseconds | > 500 milliseconds |
| CLS | Visual Stability | ≤ 0.1 | > 0.25 |
Why Mobile Performance Determines SEO
Mobile devices generate nearly 60 percent of global web traffic, though this share ranges from around 40 percent in B2B sectors to over 70 percent for consumer retail. Search algorithms run mobile-first indexing, evaluating the mobile version of your site before the desktop version.
A fast desktop site offers zero protection if the mobile experience fails. Smartphones possess weaker processors than desktop computers, causing JavaScript to take longer to parse. Test your mobile URLs using Google Search Console to understand your search ranking potential.
How to Measure Core Web Vitals: Lab vs. Field Data
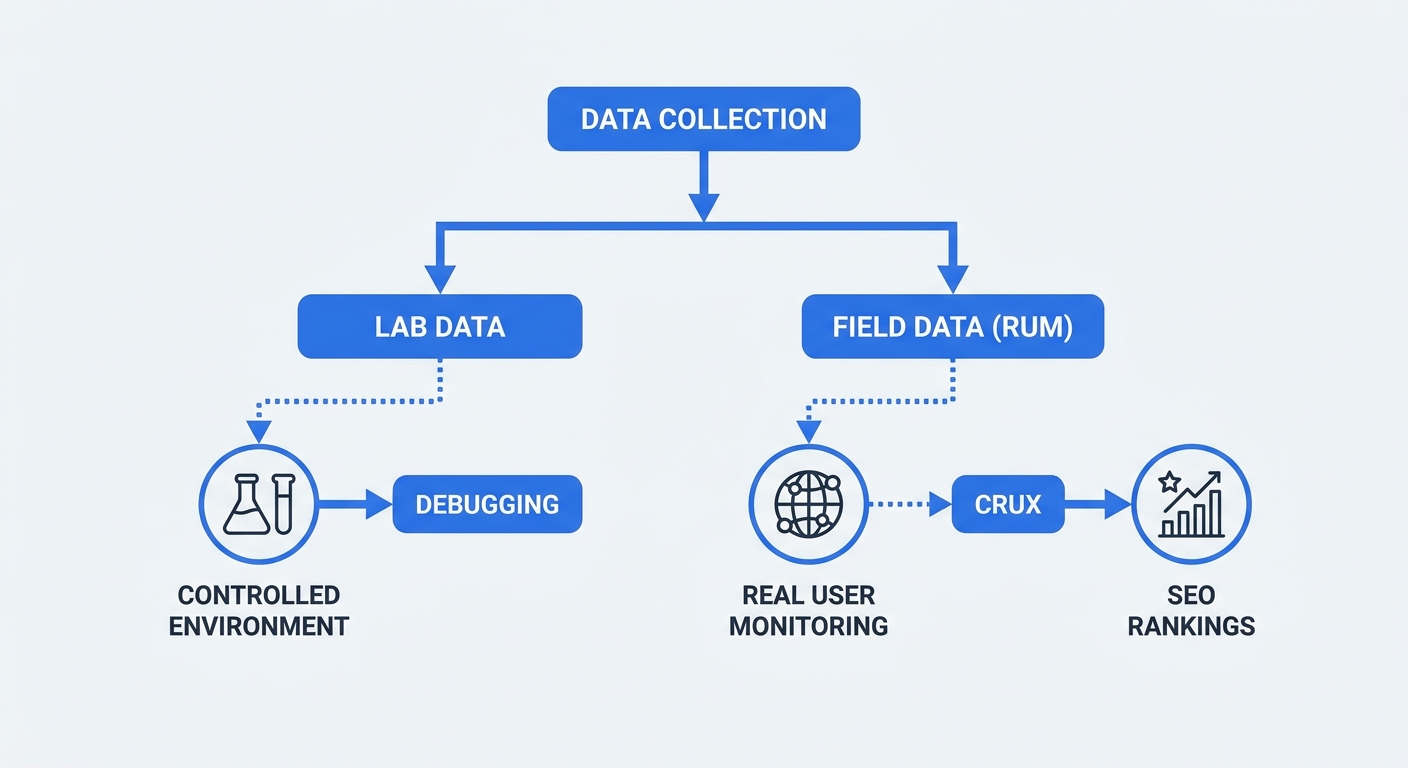
Measurement environments dictate the accuracy of your performance reports. Developers look at one dataset for building features, while search algorithms use a separate dataset for rankings.
Understanding Lab Data for Debugging
Lab data originates from controlled tests. Run a Lighthouse audit in Google Chrome to simulate a specific device and a throttled network speed.
Use lab data to reproduce bugs by finding the specific script blocking the main thread. Test different image formats to observe local performance changes. Fix the issue in your local environment before pushing code to production. Search engines ignore lab data when calculating your position in the search results.
Real User Monitoring (Field Data) for SEO
Field data originates from live visitors. Google collects this information through the Chrome User Experience Report (CrUX). Search algorithms evaluate your site using this specific data.
Track field data to spot trends before Google updates your search console. Install the open-source web-vitals library to capture metrics from user sessions. Route these anonymous events to a performance dashboard.
Install the package via npm:
npm install web-vitals
Import the functions into your application and log the output:
import { onCLS, onINP, onLCP } from "web-vitals";

function sendToAnalytics(metric) {
  const body = JSON.stringify(metric);
  // Send the data to your privacy-focused endpoint
  navigator.sendBeacon("/analytics-endpoint", body);
}

onCLS(sendToAnalytics);
onINP(sendToAnalytics);
onLCP(sendToAnalytics);
This script captures the metric value for every user. Map this data to custom events in your analytics platform. Monitor the 75th percentile of user sessions to understand your baseline field performance.
The Hidden Cost of Analytics on Performance
Adding tracking scripts degrades the metrics you want to improve. Marketing departments stack multiple tracking tags on a single page, creating bloat that ruins the user experience.
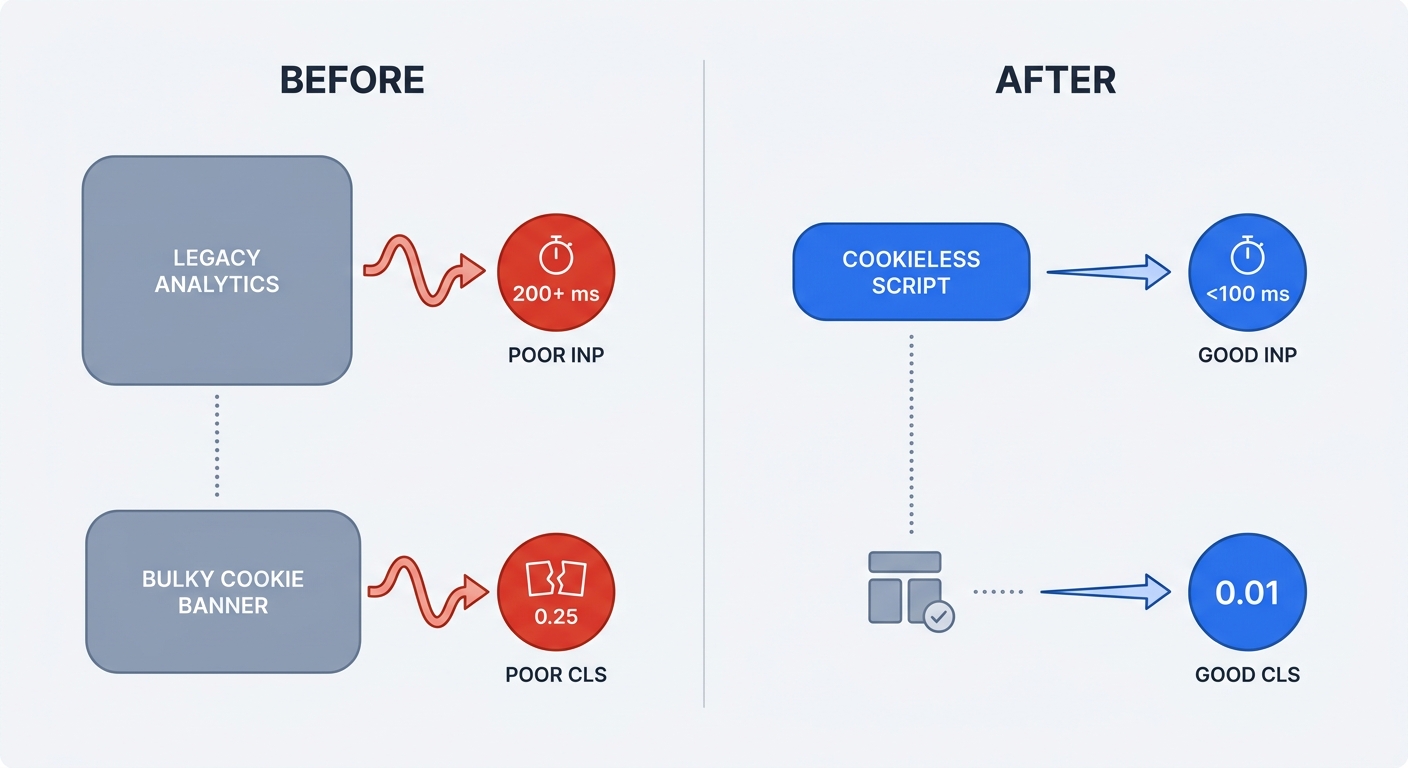
How Heavy Tracking Scripts Ruin INP
Legacy analytics tools load massive JavaScript bundles. The browser main thread pauses to execute these scripts, causing user clicks to register late. This delay forces the INP score into the red zone.
Cookieless platforms fix this bottleneck. Swetrix uses a script under 5KB to keep the main thread free. Pages respond to user taps without delay.
Eliminating CLS Penalties from Cookie Banners
Privacy laws require user consent for tracking cookies. To achieve this, Consent Management Platforms load banners using JavaScript. The sudden appearance of a banner at the top of the viewport pushes all text downward.
This shift creates a massive CLS penalty. Switch to cookie-free tracking to solve this problem and remove the intrusive consent banner. Visual stability improves the moment you delete the banner code.
Top Tools to Track Your Web Vitals
Gathering accurate data requires proper software. Rely on tools that separate local debugging from live user tracking.
Privacy-First Monitoring with Swetrix
Measure site speed without compromising user privacy. Swetrix offers dedicated performance monitoring features to track page load times and core metrics across global regions.
Capture data without tracking personal identifiers to avoid bloated scripts. Review your mobile and desktop load times in a unified dashboard. Open-source transparency ensures you own your data.
Google Search Console and PageSpeed Insights
Open Google Search Console to review historical metrics. Open the Core Web Vitals tab in the sidebar to group failing URLs by metric. This grouping helps identify site-wide template issues affecting hundreds of pages at once.
Paste single URLs into PageSpeed Insights to review the 28-day historical CrUX data at the top of the report. Scroll down to compare those numbers against the Lighthouse lab data. Use this comparison to verify if recent code changes solved historical speed issues.
Proven Ways to Improve Your Scores
Identifying a failing metric represents the first step. Fixing the underlying code requires specific optimization techniques.
Optimizing LCP with Next-Gen Images
Large files delay the Largest Contentful Paint. Convert legacy JPEG and PNG files to modern formats like WebP or AVIF to reduce file sizes by 30 to 50 percent.
Instruct the browser to prioritize the hero image by adding a preload tag to the <head> of your document.
<link rel="preload" href="/images/hero-image.webp" as="image" fetchpriority="high" />
This tag forces the browser to download the main image before parsing the rest of the stylesheet. The LCP timer stops faster as a result.
Implement a Content Delivery Network (CDN) to store image assets on servers near your target audience. Shorter physical distances reduce the time to first byte.
Fixing INP by Unblocking the Main Thread
Long JavaScript tasks destroy interactivity. The browser cannot respond to a button click while parsing a 200-kilobyte tracking script.
Break long scripts into chunks under 50 milliseconds. Use setTimeout or requestIdleCallback to defer non-critical operations.
function processData() {
  // Execute critical UI updates
  updateButtonState();

  // Defer heavy calculations
  setTimeout(() => {
    runHeavyAnalyticsTask();
  }, 0);
}
Audit third-party scripts and remove unused code. Switch to a Google Analytics alternative that prioritizes speed. Utilize the Long Animation Frames (LoAF) API in Chrome DevTools to diagnose stubborn main-thread blocks.
Eliminating Layout Shifts
Browsers need physical dimensions to paint a webpage. Images lacking explicit dimensions cause layout shifts because the text loads first. After the browser paints the text, the image downloads. The browser forces the text downward to make room for the image.
Set explicit width and height attributes on all media.
<img src="product.avif" width="800" height="600" alt="Product description" />
The browser reserves the 800x600 space before the image downloads. Reserving this space prevents content jumps. The CLS score remains at zero.
Apply this same rule to advertisements and dynamic embeds by reserving a fixed slot for third-party content using CSS. Never inject dynamic alerts above existing DOM content. Append notifications to the bottom of the screen or use absolute positioning to float them over the interface.
Debugging Workflow in Chrome DevTools
PageSpeed Insights displays what failed, while Chrome DevTools highlights where the failure occurred in your code.
Open Google Chrome and press F12 to open the developer tools. Go to the Performance tab and check the "Web Vitals" box in the capture settings. Click the record button, reload the page, and stop the recording after the page finishes loading.
The timeline populates with execution data. Locate the "Web Vitals" lane. Hover over the LCP icon to highlight the DOM node that triggered the timer.
Locate tasks marked with red triangles. These markers indicate long tasks blocking the main thread. Click a red task to view the bottom-up summary. The summary displays the JavaScript function responsible for the delay. Rewrite that specific function to clear the INP bottleneck.
Building a Culture of Performance
Speed requires continuous maintenance. A fast website degrades over time as marketing adds new tracking pixels and developers ship new features.
Establish a performance budget by defining the maximum allowed size for JavaScript bundles. Reject pull requests that exceed this limit.
Set a schedule to monitor these metrics on a routine basis. Fix small regressions before they compound into major SEO penalties. Rely on privacy-focused tools to gather insights without hurting the user experience.
Monitor your website speed without sacrificing user privacy. Swetrix provides performance analytics, cookieless tracking, and open-source transparency in one dashboard. Start your 14-day free trial today and keep your Core Web Vitals in the green.