- Date
What Is Marketing Mix Modeling: Privacy-First Analytics Guide
 Andrii Romasiun
Apple released the App Tracking Transparency framework. Browsers block cross-site tracking protocols, stripping marketers of visibility into individual user journeys. Close to 70% of advertisers feel overwhelmed by third-party cookie deprecation (Funnel.io, 2025). Build a measurement system immune to signal loss.
The Re-Emergence of MMM in a Cookieless World
What Is Marketing Mix Modeling?
Marketing mix modeling functions as a top-down statistical analysis technique. Analysts use aggregated historical data to quantify the sales impact of various marketing channels. To use this method, feed daily spend totals, website sessions, and conversions into a mathematical equation instead of tracking individual users.
Data scientists separate baseline sales from incremental sales. Baseline revenue occurs without advertising spend. Brand equity, organic search traffic, and returning customers generate this baseline volume. Incremental revenue results from campaign investments. Mathematical models calculate the specific ratio between these two figures.
Consider a mid-sized retail brand running holiday campaigns. The marketing team allocates $50,000 to social media ads, $20,000 to search, and $30,000 to television. Total December revenue hits $500,000. Without statistical analysis, the team guesses which channel drove the spike. Using marketing mix modeling, the algorithm correlates daily ad spend fluctuations with daily revenue changes to assign a specific dollar value to each channel.
The Surge in Privacy-First Adoption
Advertisers hit a wall with tracking pixels because conversion algorithms break under strict privacy regulations. Brands abandon granular setups as a result.
Teams return to aggregated measurement out of necessity. Marketing mix modeling depends on large datasets. This methodology serves as a privacy-proof solution for modern businesses because it avoids personal identifiers. Marketers sidestep the legal risks associated with cookie banners and cross-site scripts.
Audit your current attribution framework by opening your analytics dashboard. Calculate the percentage of traffic categorized as "Direct" or "Unknown." If this metric exceeds 30%, pixel-based tracking fails your reporting needs (Cometly, 2026). Note that this baseline can vary by industry, as brands with heavy dark social sharing or strong offline brand awareness naturally see higher direct traffic. Adopt an aggregated methodology before signal loss corrupts budget decisions.
Core Concepts Driving Modern MMM Algorithms
Understanding Adstock and Carryover
Marketing impact outlasts the initial impression. For example, buyers purchase a product on Wednesday after viewing a television campaign on Sunday. Data scientists call this delay Adstock or the carryover effect.
Different channels decay at varying rates. Television and video advertising maintain a long carryover decay between 0.4 and 0.8 for most retail brands. Paid search registers a shorter carryover between 0.1 and 0.4 (AnalyticalAlley, 2026).
Spend $10,000 on video ads on Day 1 with a 0.5 decay rate. The second day retains $5,000 of impact, and Day 3 holds $2,500. The mathematical model distributes the credit across these subsequent days. Attributing all sales to Day 1 undervalues the lingering effect of video advertising.
Map your channel decay rates by creating a spreadsheet. List your active channels in column A. Next, assign an estimated day-delay value in column B based on conversion delays. Pull CRM data to calculate the average time to purchase.
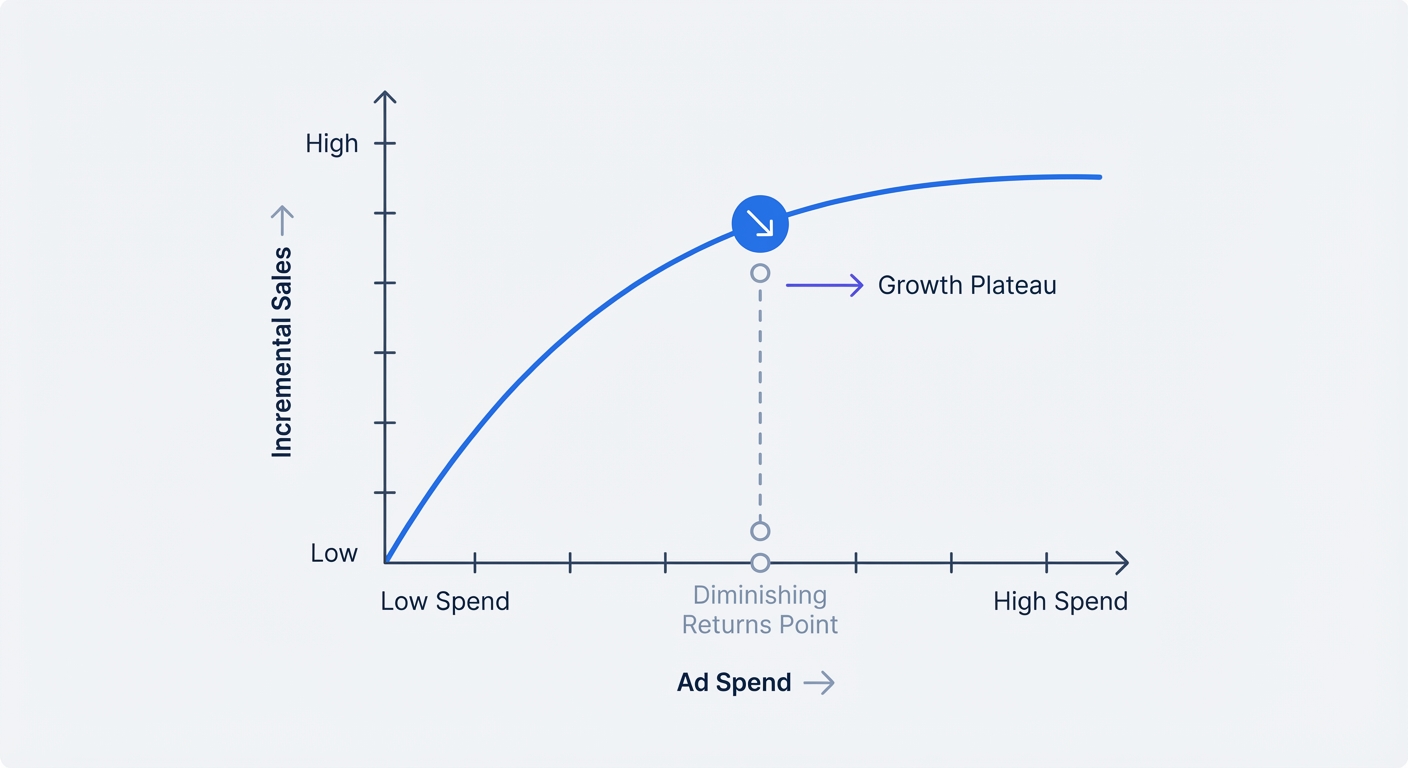
Diminishing Returns and Saturation Curves
Adding budget to a channel produces zero extra revenue at a certain point. Spending $1,000 on social ads might generate $3,000 in return. Scaling that same campaign to $10,000 yields $12,000, causing the cost per acquisition to skyrocket.
A saturation curve plots this drop-off point. Analysts use this curve to find the threshold where an extra ad dollar yields less than one dollar in return. Initial budgets capture eager buyers, while subsequent ad spend reaches uninterested audiences. The mathematical equation identifies the peak efficiency zone.
Review historical ad spend data to find the month with the highest paid media investments. Compare the revenue generated per click to a low-spend month. Find the spend level where the cost per acquisition doubled. Cap future budgets at that identified limit.
MTA vs. MMM: Solving the GDPR Paradox
The Decline of Multi-Touch Attribution
Multi-Touch Attribution requires constant surveillance. A tracking pixel placed on a visitor prompts the software to follow them across six distinct websites. Privacy laws like GDPR render this practice illegal without explicit opt-in consent.
Users decline cookies, browsers block cross-site trackers, and your attribution model breaks. A customer clicks a Meta ad, leaves, and returns via Google Search three days later. The pixel drops the connection during that window. Because the analytics platform records two separate users, the software credits the entire sale to Google Search. Marketers then allocate the upcoming budget to the wrong platform.
Compare the two measurement approaches in this matrix:
| Feature | Multi-Touch Attribution (MTA) | Marketing Mix Modeling (MMM) |
|---|---|---|
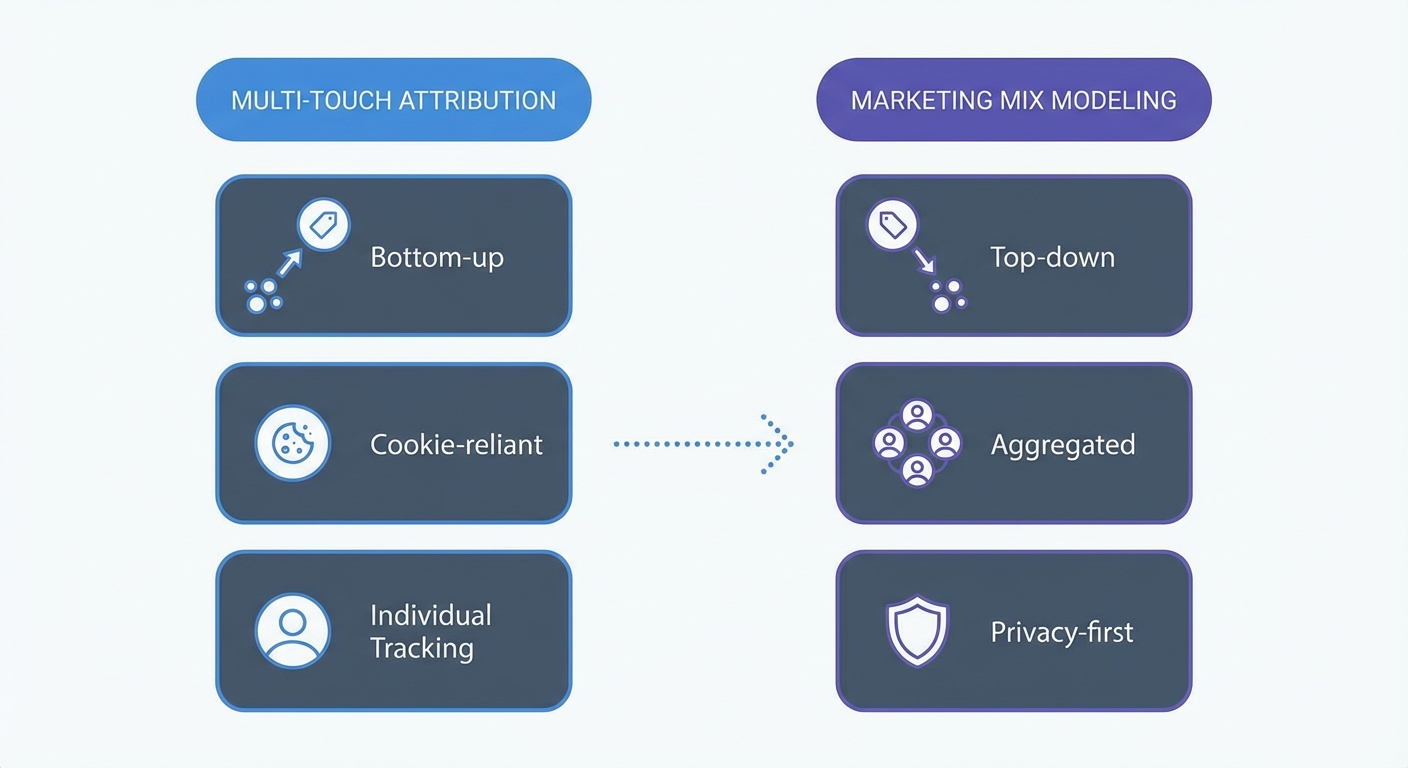
| Data Focus | Individual user paths | Aggregated volume trends |
| Compliance | Requires cookie consent banners | 100% privacy safe |
| Offline Impact | Blind to offline variables | Measures TV, radio, print |
| Setup Burden | Complex pixel deployment | CSV data ingestion |
Embracing Privacy-Compliant Measurement
Marketing mix modeling ignores individual actions. Analysts feed aggregate numbers into the system instead. For instance, ten thousand people visited the site while the company spent $5,000 on Facebook. The statistical equation correlates the spikes in traffic with the spend. By avoiding personal identifiers, this framework functions as a robust measurement standard under European privacy laws (SecurePrivacy.ai, 2025).
Shift team KPIs away from user-level conversion paths. Build a blended metric that divides total monthly revenue by total marketing spend across all channels. Review our guide on how to comply with GDPR for structural changes to the tracking strategy. For specific state regulations, read our CCPA vs CPRA comparison.
The Modern MMM Tech Stack and First-Party Data
The Role of Clean Web Analytics
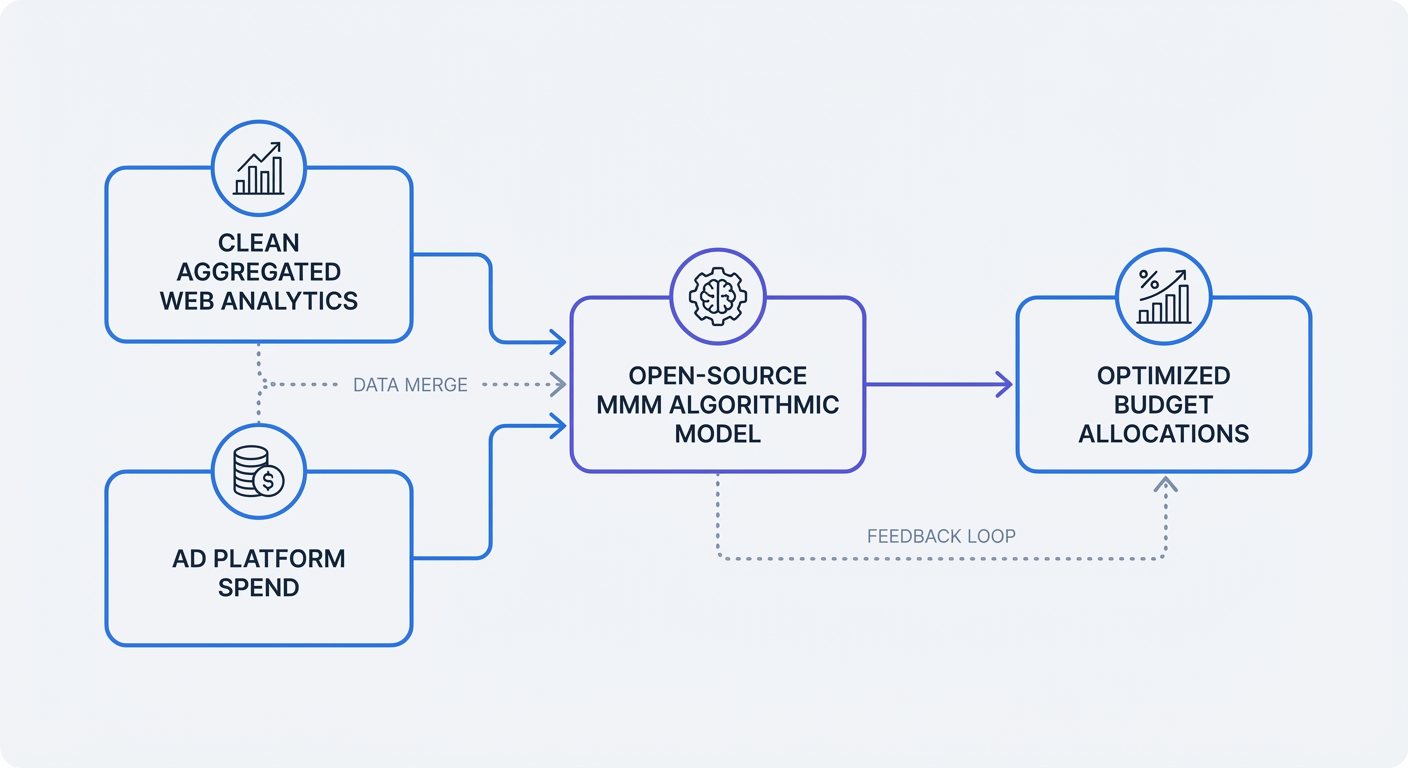
Corrupted data ruins statistical outputs. Analysts require accurate website visitor counts to train the mathematical equations. Ad blockers hide traffic, while bot swarms inflate the numbers. The predictive software then generates incorrect budget recommendations based on corrupted volume metrics.
First-party aggregated data replaces third-party tracking pixels as the foundation of modern measurement. Swetrix collects clean, aggregated data without cookies. Our open-source infrastructure bypasses ad blockers while respecting user privacy. Feed this clean baseline data into the predictive tool to map cross-channel ROI.
Block automated traffic before it reaches the mathematical model. Integrate a privacy-focused reCAPTCHA alternative on lead forms. Next, scrub historical data to remove known bot spikes before exporting the CSV files to the data scientists.
Navigate to analytics settings to check data retention rules. Configure the platform to store raw aggregate data for at least two years. Predictive equations require this historical volume to identify seasonal trends. Read our data retention policy best practices to set appropriate timeframes.
Open-Source and SaaS Solutions
Data teams construct custom pipelines using free libraries. Cloud deployment holds 64.2% of the market revenue share in the marketing modeling sector as of 2025 (Future Market Insights, 2025). Organizations choose from three primary paths to build a stack:
- Google Meridian: An open-source framework utilizing Bayesian modeling. Data engineers deploy this in a Python environment.
- Meta Robyn: An R-package using ridge regression to allocate budgets. The library requires processing power to run iterations.
- SaaS Platforms: Subscription software that connects to ad platforms via API. These tools offer visual dashboards for teams without a dedicated data scientist.
Implement a cookie-free web analytics tool today. Start building a 90-day baseline of accurate traffic data before deploying any predictive equations.
Real-World ROI and Steps to Get Started
The Financial Impact of Optimizing Spend
Budget reallocation creates immediate revenue. E-commerce brands achieve 23% greater budget efficiency by shifting funds based on aggregated data models (ConvertMate, 2026).
Retail companies spending between $3M and $5M each year see ROI improvements ranging from 5% to 20% (Circana, 2026). Direct-to-consumer businesses drive a 2.0% revenue lift on flat budgets through campaign-level pacing adjustments (Sellforte, 2025).
Use our ROI calculator to project potential revenue lift. Input the current spend and apply a 5% optimization factor to calculate the minimum expected gain.
Incrementality Calibration
Statistical correlation does not equal causation. A basic model assigns heavy credit to branded search ads, but buyers searching a brand name planned to purchase anyway. The algorithm mistakes existing demand for new growth.
Analysts fix this error with incrementality testing. Turn off branded search in Texas for two weeks. Measure the revenue drop in that state. Feed the test results back into the mathematical model to ground the predictions in causal data (ifda.ai, 2025).
Design a geographic holdout test by picking a mid-sized market and pausing one marketing channel. Record the variance in sales over fourteen days. Evaluate the performance drop using a standard A/B test calculator to verify statistical significance.
Data Formatting and Export Structure
Algorithms require specific spreadsheet formats to process historical data. Build a master CSV file with distinct columns for every variable. Column A holds the date, Column B logs total revenue, and Columns C through G track individual channel spend.
Include non-marketing variables in the subsequent columns. Add a binary column for national holidays, placing a 1 in the row for Black Friday and a 0 for normal days. Create another column for average competitor pricing. The model uses these external factors to isolate sales spikes unrelated to the advertising budget.
Clean your campaign naming conventions. One misspelled campaign name splits aggregated data into two separate rows. Use our UTM generator to establish uniform tags across every ad platform.
Step-by-Step Implementation Guide
Launch your first predictive model using this structured timeline.
- Consolidate core data (Days 1-14). Export daily spend from Google, Meta, and TikTok. Download total sessions from the analytics dashboard.
- Define external variables (Days 15-30). Document macroeconomic factors. Include price changes, promotions, competitor actions, and major holidays.
- Clean the dataset (Days 31-45). Identify outliers and remove bot traffic spikes. Standardize date formats across all imported spreadsheets.
- Run a pilot model (Days 46-60). Install an open-source library like Meta Robyn. Feed the master CSV file into the system to run the initial regression.
- Review the output (Days 61-75). Compare the algorithm's baseline sales estimate to organic revenue. Investigate extreme discrepancies.
- Calibrate the equations (Days 76-90). Apply the results from the geographic holdout test. Adjust the saturation parameters, and finalize the budget allocation recommendations.
Create a shared folder today named "MMM Data Pipeline." Export last week's spend and traffic data into a single CSV file to test the formatting. Assign one team member to maintain this spreadsheet each week.
Stop renting analytics data to ad networks. Track website traffic without compromising user privacy by signing up for a Swetrix free trial. This platform provides the clean, aggregated data foundation necessary for accurate measurement.