- Date
What Is Incrementality Testing In Marketing: A Complete Guide
 Andrii Romasiun
Ad networks inflate their own numbers. Launch a branded search campaign, and Google Ads might report a massive return on investment. The marketing team celebrates the win. Meanwhile, total store revenue remains flat because the platform takes credit for customers who planned to buy your product without seeing an advertisement.
Stop paying for sales you would have won without advertising. Incrementality testing in marketing fixes this attribution blind spot. Separate the audience into two groups to measure the financial impact of your campaigns. One group sees the ad, and the other group sees nothing. Comparing the revenue from both groups uncovers the number of net-new customers your budget generated.
What Is Incrementality Testing in Marketing?
Defining Incrementality vs. A/B Testing
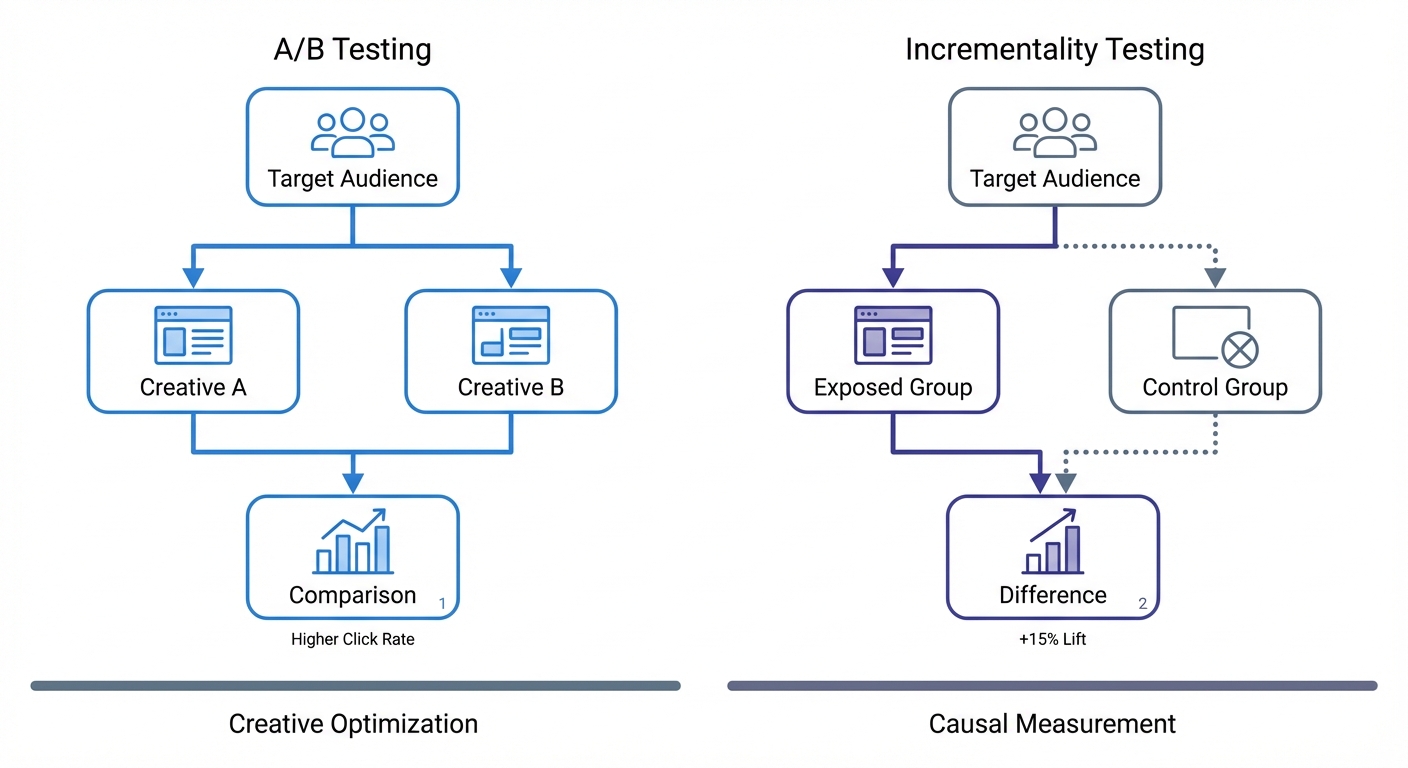
Many marketers confuse a creative test with an incrementality test. A/B testing measures which ad variation performs best. Marketers show Creative A to half their audience and Creative B to the other half, awarding the budget to the winning variation. Optimizing campaign performance with A/B testing software improves click-through rates. This software cannot determine if the winning ad generated a net-new sale.
Incrementality testing in marketing isolates net-new revenue. Divide your target market into a test group and a control group. The test group views your ad. The control group acts as a holdout and sees zero marketing from your brand.
Removing the ad from the control group establishes a baseline of sales momentum. Compare the final conversions from the test group against that baseline. The resulting difference represents the causal impact of your ad spend.
Calculating Incremental Lift
To measure this causal impact, calculate the incremental lift. Subtract the results of the control group from the results of the test group. The remaining figure equals the net positive effect of your campaign.
Apply this formula to your next campaign by building an audience of 100,000 users. Isolate 50,000 users into the control group and exclude them from all ad targeting. Target the remaining 50,000 users with a new Meta video ad. After 14 days, check the sales data.
The test group yields 750 conversions, producing a 1.5% conversion rate. The control group yields 250 conversions, producing a 0.5% conversion rate. Apply the formula: 1.5% (Test) - 0.5% (Control) = 1.0% Incremental Lift.
The ad generated a 1% increase in conversion rate. Two-thirds of the sales in the test group happened because of the ad. One-third occur without marketing intervention. Scale your budget based on the 1% net-new lift to maximize profitability.
Failing to separate these two groups leads to bad financial decisions. Platform return on ad spend (ROAS) dashboards might report a 4.0x multiplier when a brand spends $10,000 to make $40,000 in the test group. However, if a control group check reveals $35,000 in baseline sales, the incremental revenue equals $5,000. Causal ROAS drops to 0.5x, meaning the campaign lost money.
Why Marketers Are Abandoning Legacy Attribution
The Demise of Multi-Touch Attribution
Multi-channel attribution models track a user across the web to map their entire journey. A visitor clicks a Facebook ad on their phone during lunch. That evening, the same person searches your brand on a laptop and completes a purchase. Legacy attribution software stitches these events together using third-party cookies and IP addresses.
Privacy regulations and software updates broke this tracking infrastructure. Apple introduced App Tracking Transparency to block cross-app data sharing, and browsers disabled third-party cookies. Marketing teams lost the ability to follow users from device to device. Marketers must abandon multi-touch attribution because it requires invasive tracking methods with broken functionality (Northbeam, 2025).
Despite this structural collapse, 78.4% of marketers continue to rely on legacy last-click attribution (AI Digital, 2026). Last-click models assign 100% of the revenue to the final link a user clicked before checkout. This approach rewards bottom-funnel channels and ignores the top-of-funnel campaigns that introduce new customers to the brand. Last-click data trains ad platform algorithms to hunt for users who plan to buy without prompting.
The Danger of the Retargeting Reality Check
Retargeting campaigns log high conversion numbers in a last-click analytics dashboard. Brands serve ads to users who abandoned their shopping carts. Those users return and complete their purchases, allowing the ad platform to take 100% credit for the revenue.
Run an incrementality test on your retargeting campaigns. Analysts call this the "Retargeting Reality Check" (Right Side Up, 2025). Isolate a holdout group of cart abandoners and show them no ads. Measure their baseline return rate. Marketers observing this test discover that abandoners return to buy without prompting.
Marketers testing retargeting campaigns expose wasted budget. The ads target users with high purchase intent. Analysts reviewing the incrementality test see that the ad did not cause the sale. Stop spending your budget to acquire customers you own. Shift those dollars to upper-funnel channels that drive net-new growth.
Current Benchmarks for Incremental Ad Performance
Analyzing iROAS Across Channels
Incremental Return on Ad Spend (iROAS) measures the causal revenue generated by a campaign. The metric tracks the net-new revenue proven by a holdout test. For every dollar spent, the median retail digital campaign generates $2.31 in causal revenue, representing a 2.31x median iROAS, though software and service industries see different baselines (Stella Incrementality, 2025).
Channel performance varies based on funnel position and user intent. Top-of-funnel video channels introduce the brand to cold audiences, creating new demand. Connected TV generates the highest median return (Stella Incrementality, 2025) because it reaches viewers who had zero prior intent to buy.
| Marketing Channel | Median Incremental ROAS (iROAS) | Funnel Position |
|---|---|---|
| Connected TV (CTV) | 3.30x (Stella Incrementality, 2025) | Upper Funnel |
| Google Performance Max | 2.98x (Stella Incrementality, 2025) | Full Funnel |
| Meta (Facebook/Instagram) | 2.92x (Stella Incrementality, 2025) | Mid Funnel |
| Branded Google Search | 0.70x (Stella Incrementality, 2025) | Bottom Funnel |
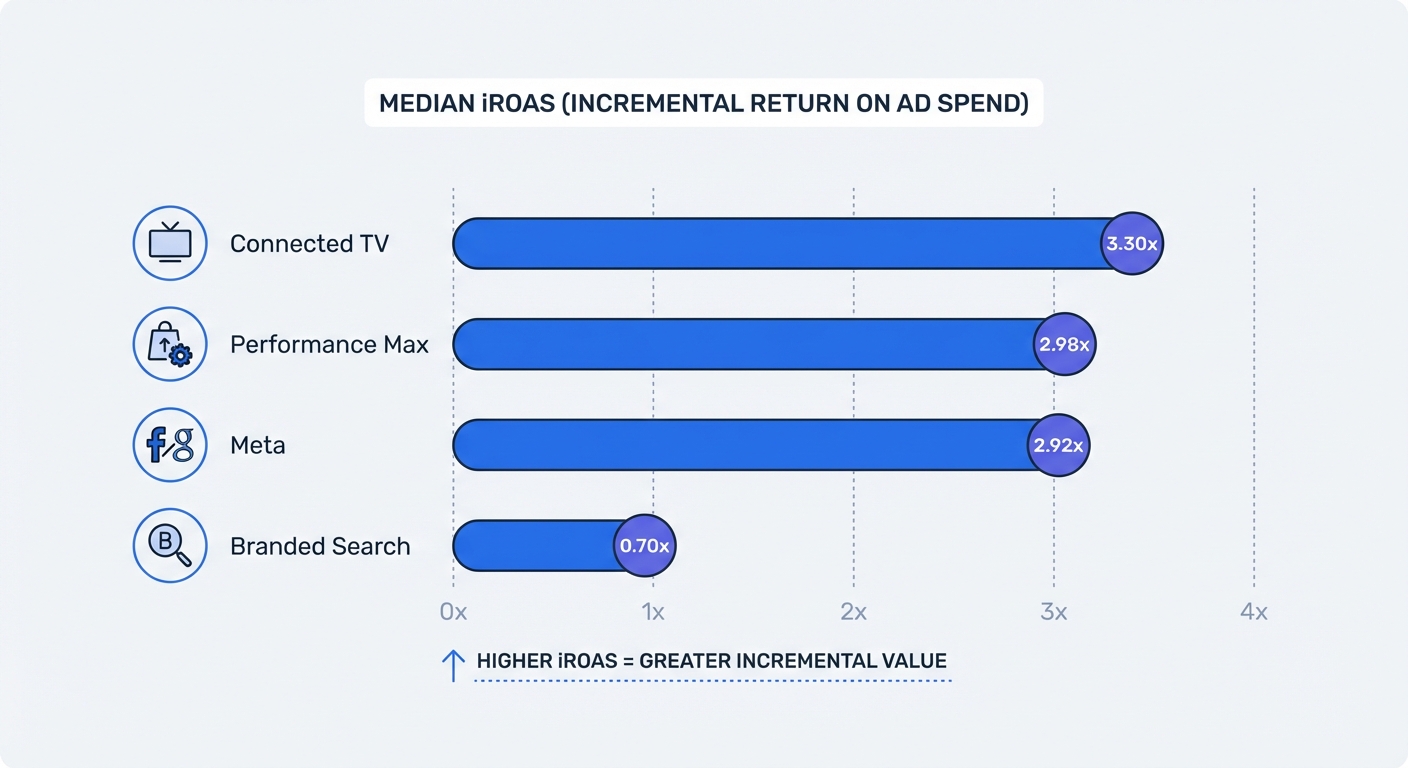
Bottom-funnel text ads capture users executing a specific search to harvest existing demand. Branded search yields a 0.70x median iROAS (Stella Incrementality, 2025) because it targets users who intend to visit your website before they see the ad.
Advertisers lose 30 cents on every dollar spent bidding on their own brand name (Stella Incrementality, 2025). The users typing your brand into Google know the company. If you pause your branded search ads, organic search results capture those clicks.
The Urgent Need for Better Measurement
Declining efficiency across core marketing channels forces brands to rethink their strategies. E-commerce companies rank this decline as their top growth challenge, with 63% seeking new solutions (Haus, 2025). Brands face a mandate to stop funding inefficient channels. Ninety percent of direct-to-consumer brands rank incrementality testing as their most trusted measurement method to solve this problem (Haus, 2025).
Audit your branded search spend by choosing two states with matching historical revenue patterns. Pause your branded search campaigns in one state and keep the campaigns running in the other. Monitor your overall website traffic and total regional revenue. If the paused state maintains its baseline sales volume, your branded search ads provide zero incremental value. End the campaign nationwide to retain the profit.
How to Run an Incrementality Test
Conducting Geo-Holdout Experiments
Geo-holdout experiments measure ad impact without requiring user-level tracking. Marketers divide geographic regions into test and control groups based on historical sales similarities. This method bypasses iOS tracking restrictions and browser cookie blocks. Over 52% of brands and agencies use these causal testing methods to measure campaign performance (eMarketer and TransUnion, 2025).
Follow these steps to run a geo-holdout test:
- Select a focus channel. Pick a channel consuming a large portion of your budget, such as Meta Ads or Google Performance Max.
- Identify comparable regions. Group states or cities with matching historical sales trends. Ohio and Michigan provide a classic comparison for US-based brands.
- Establish the control. Turn off all ad spend for the focus channel in Michigan while keeping the budget steady in Ohio.
- Run the test. Maintain the holdout for 30 days to capture a full purchase cycle.
- Analyze the regional data. Open your web analytics platform to compare the total unique visitors and total revenue from Ohio against Michigan.
The difference in revenue growth between the two states represents the causal impact of the channel. This framework allows marketers to measure marketing spend without installing a single tracking cookie.
Utilizing First-Party Audience Splits
First-party CRM data provides a framework to test retention and reactivation campaigns. Brands own their email subscriber lists and customer purchase histories. This data provides a secure foundation for creating randomized test and control groups.
Export your list of inactive customers who have not made a purchase in 90 days from your database. Randomize the list in a spreadsheet and split the rows into two equal halves to prevent algorithmic bias.
Upload the first half to your Meta Ads manager as a custom audience. Keep the second half isolated as a control group. Launch a 20% off reactivation offer to the custom audience.
Monitor the purchase behavior of both groups in your CRM database over the next two weeks. Ad platforms will try to match conversions to views. Rely on your database as the objective source of record. Compare the number of returning customers in the test group against the baseline return rate of the control group.
This comparison calculates the customer acquisition cost for reactivating a churned user. Using the Swetrix LTV calculator helps determine if the reactivation cost justifies the long-term revenue.
Building a Privacy-First Measurement Stack
The Triangulation Method
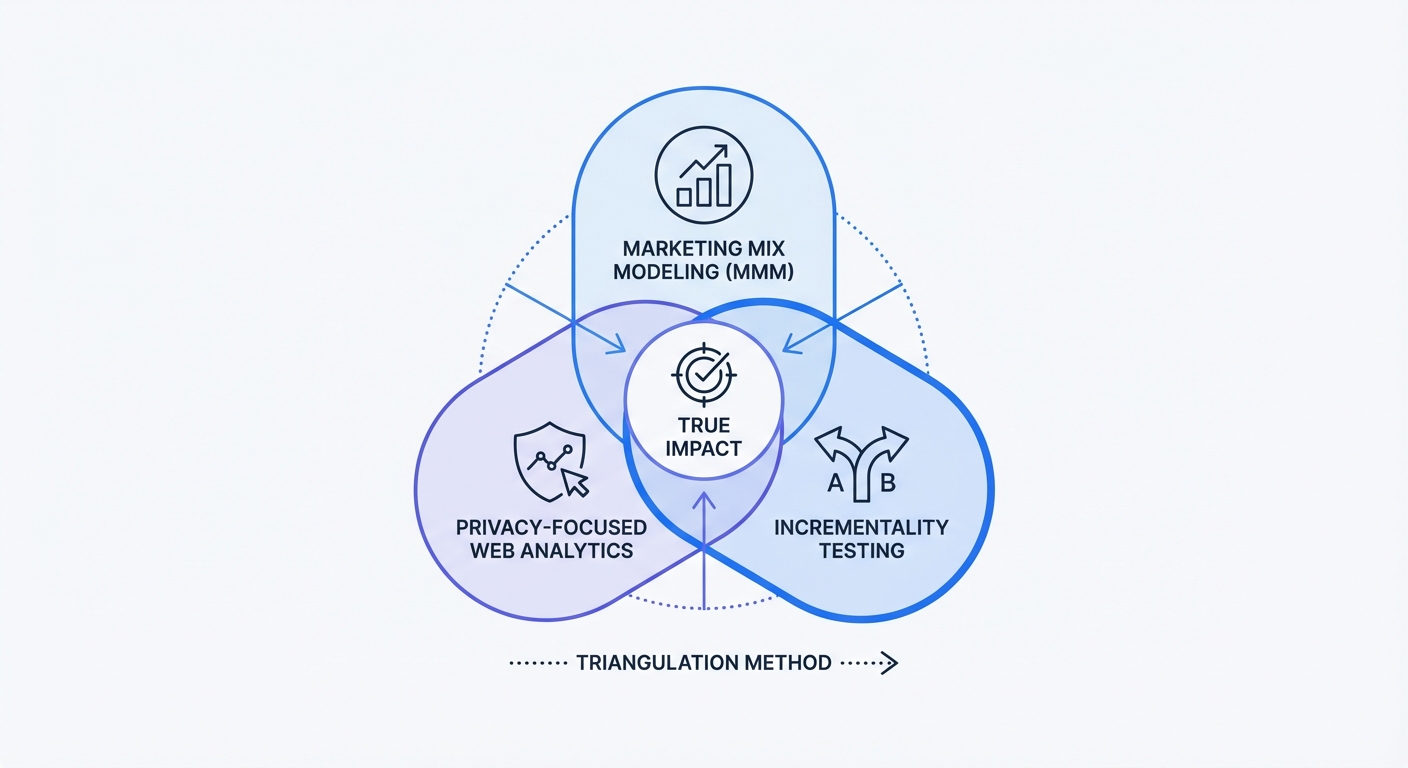
No single tool provides flawless marketing measurement. Industry leaders abandon the search for a single attribution model. Build a resilient measurement stack by combining Marketing Mix Modeling, Incrementality Testing, and Web Analytics.
Marketing Mix Modeling analyzes aggregate historical data to calculate the impact of budget changes. Marketers use MMM for long-term budget planning, but these algorithms rely on correlation and struggle to separate seasonality from ad effectiveness.
Fix this correlation problem by anchoring your MMM with causal data. Analysts use incrementality holdout tests to calibrate their MMM algorithms with real-world facts (RevelOne, 2025). Analysts reviewing the incrementality test verify the lift of a specific channel in the present moment. Feed that proven multiplier back into the MMM.
Web analytics forms the final pillar of the triangulation method. Teams need an independent dashboard to monitor day-to-day site health, regional traffic variations, and overall conversion spikes while the tests run.
Using Swetrix as Your Control Dashboard
Advertising companies record interactions on their networks and run platform-native lift tests. Relying on their self-reported numbers exposes your budget to bias. Teams need an independent source of record to validate experiments.
Swetrix serves as that independent record. As an open-source, privacy-focused Google Analytics alternative, it tracks your traffic without relying on third-party cookies. Monitor regional traffic volumes during a geo-holdout test without tracking individual users.
Navigate to the Swetrix dashboard during your next geographic holdout and open the locations report. Filter the incoming sessions by state or region. Watch the impact on total sessions and pageviews.
Compare the traffic drop in your paused Michigan region against the baseline in Ohio. Because Swetrix avoids device fingerprinting and intrusive tracking codes, your measurement stack remains compliant with GDPR and CCPA regulations. Gather aggregate data to validate your test.
Stop trusting ad platforms to report their own success, and implement a measurement strategy based on causal testing and independent data to protect your budget.
Ready to measure your marketing with confidence? Start your 14-day free trial of Swetrix to monitor your web traffic, track regional conversions, and analyze your business growth without invading user privacy.