- Date
What Are Web Analytics A Guide to Turning Data Into Decisions
 Andrii Romasiun
At its core, web analytics is the art and science of collecting, analyzing, and reporting data from your website to truly understand how people use it. Think of it as having a friendly, all-knowing manager for your online storefront. This manager watches every digital footstep to show you what’s working, what’s falling flat, and most importantly, why. It’s how you turn a stream of raw numbers into smart decisions that help your business grow.
So, What Are Web Analytics, Really?

Let's stick with that analogy of your website being a physical shop. Web analytics is the system that tells you everything happening inside. It’s not just about counting how many people walk through the door; it’s about understanding their entire journey from the moment they arrive to the second they leave.
This powerful discipline helps you answer the make-or-break questions that determine your online success. By digging into the data, you get to see your website through your audience's eyes, uncovering patterns and opportunities you’d never spot otherwise.
The Story Behind the Clicks
Every click, scroll, and form submission tells a piece of a bigger story. Web analytics tools are designed to gather all these fragments and weave them into a clear narrative about your site's performance. This isn't just dry, technical data; it's a direct reflection of real human behavior.
When you understand this story, you can stop guessing what your audience wants and start making informed, confident decisions. It shines a light on which marketing channels bring in the best visitors, what content truly connects with people, and precisely where they get stuck or lose interest.
Web analytics transforms anonymous clicks into a clear picture of your audience. It's the process of listening to what users do, not just what they say, to improve their experience and achieve your goals.
This intense focus on user behavior is fueling some serious industry growth. The web analytics market, currently valued around USD 5.37 billion, is expected to explode to USD 20.09 billion by 2032. A massive part of this surge comes from e-commerce businesses using analytics to perfect their user journeys and create more personal shopping experiences. You can learn more about the future of web analytics and market trends.
Why This Data Is Essential for Growth
Without analytics, you’re flying blind. Sure, you might see traffic numbers going up, but you won't have a clue where those visitors came from, what they were looking for, or why they left. This lack of insight makes it nearly impossible to build a strategy that actually works.
In stark contrast, putting analytics to work gives you a clear roadmap for improvement. It empowers you to:
- Identify Your Audience: Get a real sense of who your visitors are—their location, the devices they use, and what they’re interested in.
- Optimize Conversion Paths: Pinpoint the exact pages or steps where people abandon a purchase or sign-up, so you can smooth out those friction points.
- Improve Content Strategy: See which blog posts, landing pages, or product descriptions grab the most attention and keep people engaged.
- Maximize Marketing ROI: Figure out which campaigns, from social media ads to email newsletters, are actually driving valuable traffic and conversions.
Ultimately, web analytics provides the feedback loop you need to keep getting better. It closes the gap between what you think your customers want and what their actions show they want, ensuring your digital presence is not just active, but genuinely effective.
Understanding the Language of Your Website Data
Jumping into web analytics can feel like learning a new language. You're presented with a dashboard full of numbers and charts, each telling a piece of a story about your visitors. But to actually understand that story, you need to know the vocabulary first.
These core metrics aren't just abstract figures; they are direct clues about how real people behave on your site. Think of each one as a different lens. By combining these perspectives, you start to see the bigger picture—the complete journey of your audience from the moment they arrive to the moment they leave.
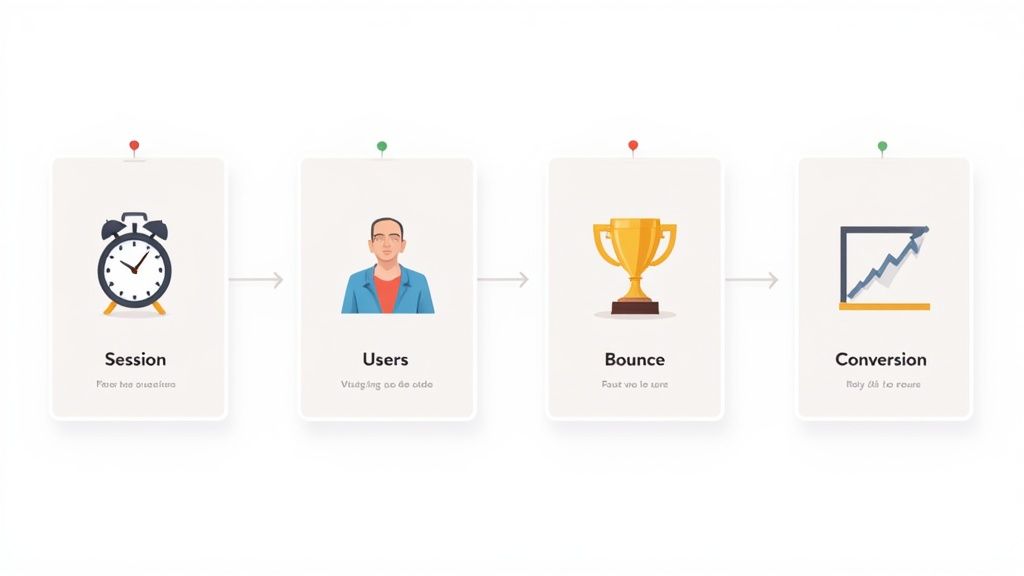
Pageviews, Users, and Sessions: The Building Blocks
Let's start with the absolute basics. These are the foundational terms you'll see in any analytics tool, and getting them right is the first step toward turning data into decisions.
Pageviews: This is as simple as it sounds—it's a raw count of how many times a page on your site has been loaded in a browser. While a big number looks good on a report, it doesn't say much on its own about user engagement. For a deeper look, check out our guide on what are pageviews.
Users: This metric counts the distinct, individual people who have visited your site over a certain period. Analytics platforms use cookies or other identifiers to tell one person apart from another, giving you a sense of your total audience size.
Sessions: A session is essentially a single visit. It kicks off when someone lands on your website and ends after a period of inactivity, which is typically 30 minutes.
Imagine a visitor lands on your blog, reads one article, then clicks to another. All of that activity counts as one session. This metric is crucial for understanding not just how many people are visiting, but the overall volume of traffic and interaction on your site.
Measuring Engagement: Bounce Rate and Conversions
Once you know who is coming to your site, the next question is: are they finding what they need, or are they leaving disappointed? That’s where engagement metrics come in. These numbers tell you how effective your content and design really are.
"Your bounce rate is like a customer walking into your store, taking one look around, and immediately walking out. It's a powerful indicator that your entryway—your landing page—isn't delivering on its promise or meeting visitor expectations."
Understanding these performance indicators is the key to improving the user journey. Let’s look at two of the most important ones.
Bounce Rate: This is the percentage of visits where a user lands on a page and leaves without doing anything else—no clicks, no form submissions, nothing. A high bounce rate isn't always a bad sign (maybe they found the phone number they needed and left), but it often points to a problem.
Conversion Rate: This is where the rubber meets the road. A conversion is any desired action a user takes, like signing up for a newsletter or making a purchase. The conversion rate is the percentage of visitors who complete that action, making it one of the most critical metrics for measuring success.
Here's a quick reference guide to help you keep these core concepts straight and understand the story each one tells.
Core Web Analytics Metrics and What They Reveal
| Metric | What It Measures | The Story It Tells |
|---|---|---|
| Pageviews | The total number of times a page is viewed. | How popular is specific content? |
| Users | The number of unique individuals visiting your site. | How large is my total audience? |
| Sessions | A single visit to your site by a user. | How much overall traffic am I getting? |
| Bounce Rate | Percentage of single-page visits with no interaction. | Is my landing page engaging or confusing? |
| Conversion Rate | Percentage of visitors who complete a key action. | Is my website achieving its primary goals? |
By looking at these metrics together, you can start asking much smarter questions and getting real answers from your data.
Putting It All Together
No single metric tells the whole story. The real magic happens when you see how these numbers connect and influence each other.
For example, a high number of pageviews coming from a small number of users could mean you have a super-engaged, loyal audience that keeps coming back for more. On the other hand, tons of traffic but a rock-bottom conversion rate is a clear signal that something in your user journey is broken. By learning to speak this language, you can stop guessing and start making informed decisions that truly improve your website.
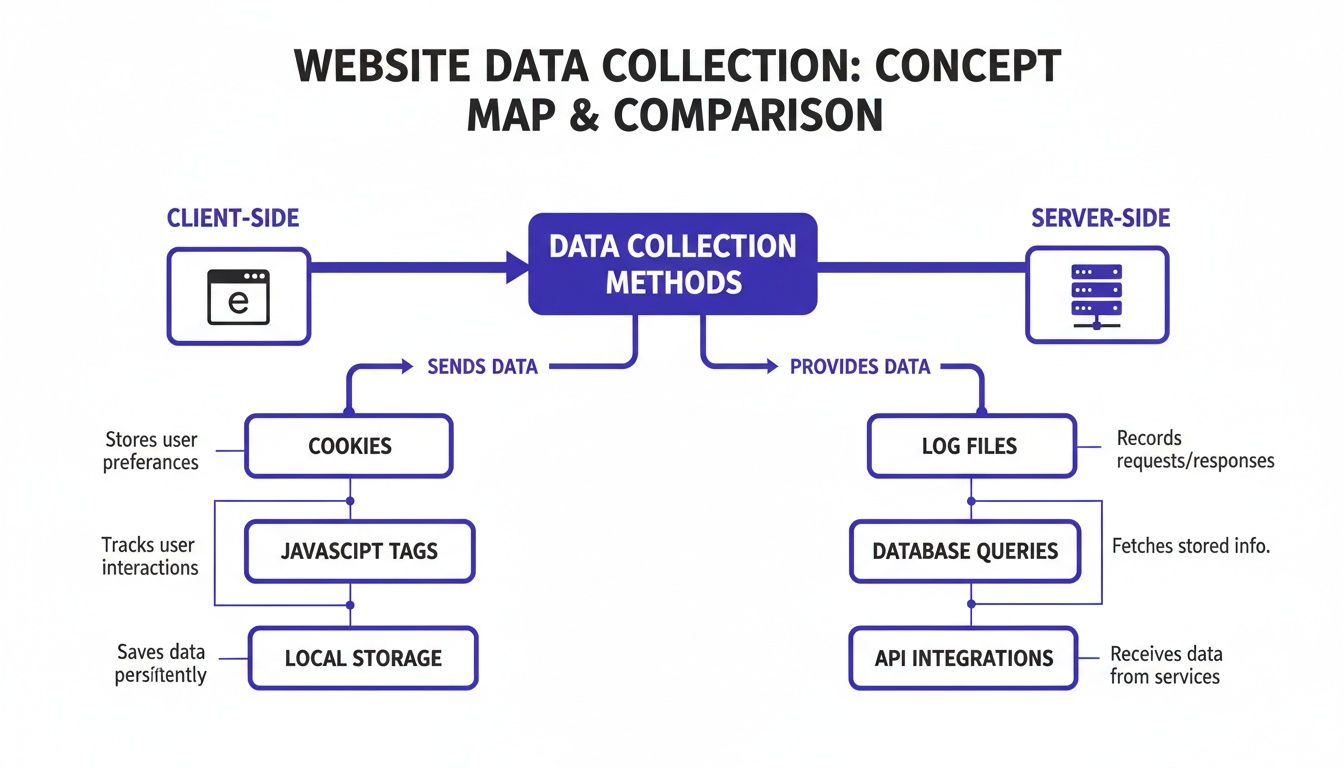
How Your Website Data _Actually_ Gets Collected
Ever wonder where all those numbers in your analytics reports come from? They don't just magically appear. Understanding how your website data is gathered is the first step to truly trusting—and using—it effectively. It's a technical process, but knowing the basics helps you see both the power and the potential blind spots in your data.
Think of your website as a physical store. To figure out what your customers are doing, you need a way to observe their behavior. In the world of web analytics, there are two primary ways to do this: client-side and server-side tracking. Each has its own job to do.
Client-Side Tracking: The In-Store Observer
The most common method by far is client-side tracking. This works by placing a small piece of JavaScript code (a "tracking script" or "tag") onto every page of your site. When a visitor loads a page, their web browser—the "client"—executes this script.
Imagine this script is like a helpful employee in your store, clipboard in hand, noting down what shoppers do. As a visitor moves around, clicks on things, or scrolls through a page, the script is right there, recording the action. This approach is fantastic for capturing rich, interactive data directly from the user's browser, like:
- Mouse clicks and movements
- How far someone scrolls down a page
- Form interactions, like when they start typing in a field but don't submit
- Screen resolution and device type
This is the technology that powers the vast majority of analytics platforms you've heard of. Take Google Analytics: it's deployed on a staggering 55.49% of all websites, which is nearly 38 million sites. Its popularity proves just how effective client-side tracking can be. You can dive deeper into these numbers by reading the full report on web analytics statistics.
But there's a catch. Just like a shopper could tell our store employee to buzz off, visitors can block these scripts. Ad-blockers and privacy-focused browsers often stop them from running, which means a chunk of your visitor activity can simply disappear into thin air.
Server-Side Tracking: The Back-Office Ledger
On the other hand, we have server-side tracking. This method logs interactions from your website's backend infrastructure (the "server") after they happen, completely skipping the user's browser.
Think of this as your store's secure, official back-office ledger. Every time a sale is finalized, an order is placed, or an account is created, the transaction is logged directly into the company’s permanent records. This is all happening behind the scenes, invisible to the customer and completely unaffected by ad-blockers.
Server-side tracking is your source of truth. Because it operates away from the user's browser, it delivers a more accurate and reliable record of critical events like purchases, sign-ups, or downloads.
Setting this up is more technically involved, no doubt. But the payoff is a much higher degree of data accuracy and control. You decide exactly what gets recorded and where it goes, a huge plus for any business dealing with strict privacy or compliance rules. It creates a clean, undeniable record of events, making it the perfect partner to the rich behavioral insights you get from client-side tracking.
Navigating Data Privacy and Cookieless Analytics
For a long time, the web ran on cookies. These tiny text files, stored in a user's browser, became the backbone of digital tracking and advertising. But as we all know, that approach created some serious privacy headaches, sparking a major backlash from users and, eventually, regulators.
Today, respecting user privacy isn't just a nice thing to do—it's a business and legal imperative. Laws like Europe's General Data Protection Regulation (GDPR) have completely changed the game, giving people real control over their data and setting strict rules for how it's collected. As a result, the old way of doing things is on its way out, pushing us all toward more honest and transparent methods.
The Rise of Cookieless Analytics
This new reality has cleared the way for cookieless analytics. It’s a modern way to understand your website traffic without relying on those old-school persistent cookies that follow people around the internet. The goal isn't to build a creepy, detailed profile of every single visitor. Instead, it’s about understanding trends and patterns across your entire audience.
This approach puts user anonymity first. It means you can still get answers to your most important questions—like which marketing campaigns are actually working or where people are getting stuck in your checkout flow—all without collecting personally identifiable information (PII). It’s a huge mindset shift: you're no longer tracking people; you're measuring actions.
"Cookieless analytics isn't about getting less data; it's about getting the right data. It shifts the focus from invasive individual surveillance to anonymous, aggregate insights that respect user trust and still drive business growth."
Ultimately, building a lasting relationship with your audience starts with trust. When people know you're not spying on them, they're far more likely to stick around.
The two main methods for collecting data—directly from the user's browser or from your server—have different implications for privacy and accuracy.
As you can see, client-side tracking is easily blocked, whereas server-side collection gives you a much cleaner, more reliable stream of data—something that's essential for any privacy-focused setup.
The table below breaks down the core differences between the traditional, cookie-heavy model and the newer, privacy-first alternative.
Traditional vs Privacy-First Analytics A Comparison
| Feature | Traditional Analytics | Privacy-First Analytics |
|---|---|---|
| Primary Identifier | Third-party cookies, persistent user IDs | Anonymized or temporary identifiers |
| Data Focus | Individual user behavior, cross-site tracking | Aggregate trends, on-site interactions |
| User Privacy | Often requires opt-out, PII collection is common | Anonymity by design, PII is not collected |
| Regulatory Compliance | Complex, requires consent banners (GDPR/CCPA) | Simpler compliance, often exempt from consent |
| Data Accuracy | Degraded by ad-blockers and cookie restrictions | More reliable data, less affected by blockers |
| Cross-Site Tracking | Core functionality | Actively avoided and blocked |
This comparison makes it clear: privacy-first isn't just a trend, but a fundamental evolution in how we measure digital experiences responsibly.
How Privacy-First Platforms Work
So, how does a tool like Swetrix deliver sharp insights without using cookies? It's not magic—it's just a smarter, more respectful way of collecting data. Here are the core techniques they use:
Data Aggregation: Instead of zooming in on one person's journey, these tools zoom out to see the big picture. You get to see how groups of users behave, which gives you the insights you need without compromising anyone's privacy.
Event-Based Tracking: The focus is on anonymous actions—a page view, a button click, a form submission. Each one is logged as a single, standalone event, completely disconnected from a permanent user profile. This tells you what happened, not who did it.
Anonymized Identifiers: To tell the difference between one person visiting ten pages and ten people visiting one page, some tools generate a temporary, anonymous hash. This is often created from a mix of the visitor's IP address, browser info, and a daily changing "salt" (a random piece of data). The resulting ID is completely anonymous, only lasts for 24 hours, and can't be reverse-engineered to identify someone.
No Cross-Site Tracking: This is a hard-and-fast rule. The data collected on your site is for your eyes only. It is never, ever used to follow your visitors once they leave.
By using these methods, you get a powerful, compliant, and complete view of your website's performance. More importantly, you prove to your users that you value their trust just as much as you value their business. That’s not just good ethics; it’s a smart strategy that will pay off for years to come.
Putting Your Analytics into Action
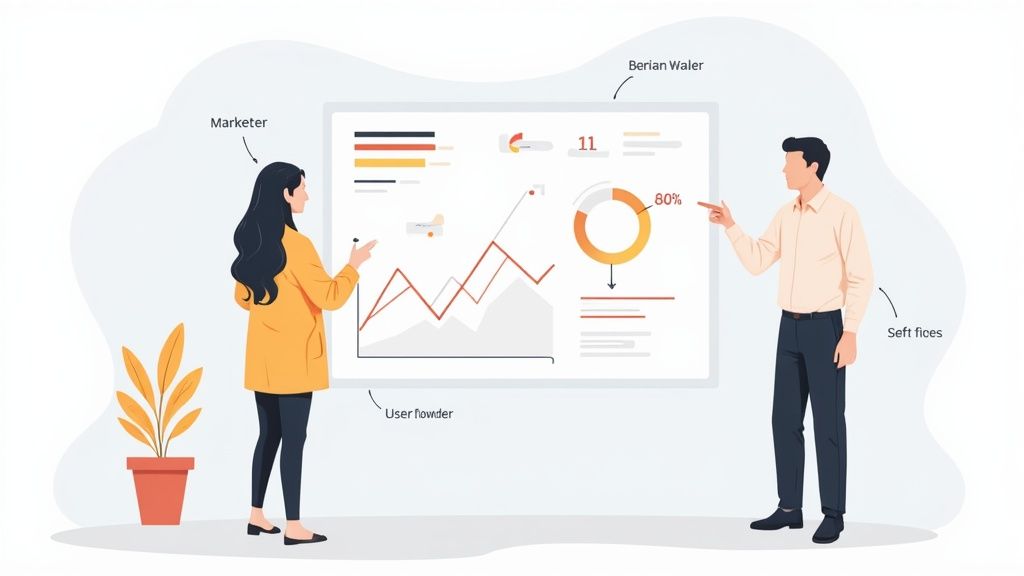
Knowing the numbers behind your website is a great start, but raw data by itself doesn't move the needle. The real magic happens when you use those insights to make smarter decisions. This is the moment web analytics goes from being a passive reporting tool to an active, strategic part of your playbook.
The thing is, different people on your team will look at the exact same data and see completely different things. They’re all looking for answers, but they’re asking different questions. A marketer needs to know if their ad budget is actually working, while a product manager is hunting for frustrating dead-ends in the user experience. When you connect analytics to these real-world jobs, data stops being abstract and starts driving real results.
How Marketers Optimize Campaigns
For any marketing team, web analytics is basically the report card for every single campaign. It gives them a brutally honest look at what’s working, what's a waste of money, and where the next big win is hiding.
Let’s say you’re running ads on three different social media platforms. Without good analytics, you might just assume the platform sending the most clicks is your winner. But when you dig in, you could discover that one channel sends fewer visitors, but those visitors convert at a 3x higher rate.
That's gold. It tells you exactly where to double down on your ad spend and which channels to either rethink or cut loose. Marketers use analytics to get straight answers:
- Which traffic sources are actually valuable? By tracking conversions by referral source, they can see which channels—like organic search, a specific email newsletter, or a paid campaign—are bringing in customers, not just clicks.
- Are our landing pages doing their job? A sky-high bounce rate on a landing page is a massive red flag. It usually means there’s a mismatch between what your ad promised and what the page delivered.
- What's the real ROI here? By assigning a value to each conversion, marketers can finally calculate the revenue generated from their campaigns and weigh it against what they spent.
How Product Teams Improve User Experience
While marketers are focused on getting people in the door, product teams are obsessed with what happens once they're inside. They use web analytics like a blueprint to understand how people actually use the product, helping them build something more intuitive and, frankly, more enjoyable.
User flow analysis is one of their most powerful tools. It literally maps out the paths people take through your site, showing you the popular routes and the places where they get stuck and leave. For instance, a product team might spot that a staggering 70% of users who add an item to their cart disappear on the shipping information page.
This isn't just a random number; it's a huge flashing sign pointing to a problem. The team can now form a hypothesis—maybe the shipping costs are a nasty surprise, or the form is a nightmare to fill out on mobile—and start testing solutions.
By digging into analytics, product teams can:
- Spot Friction Points: Pinpoint the exact pages or features where users are getting confused, frustrated, or giving up.
- Validate New Features: After launching something new, they can track adoption to see if people are using it as intended—or at all.
- Optimize Onboarding: Analyze how new users navigate their first session to make sure that initial experience is smooth and encouraging.
A well-structured web analytics dashboard is essential for keeping track of these critical user journeys.
How Founders and Owners Steer the Business
For founders and business owners, web analytics is the 30,000-foot view. It helps them swap gut feelings for hard data when making big strategic calls. They use dashboards to monitor the vital signs of the business, making sure the ship is pointed in the right direction.
Imagine a founder is thinking about expanding into a new country. Instead of just taking a wild guess, they can glance at their analytics and see if they’re already getting a trickle of organic traffic from that region. That small data point can be enough to validate market demand before they sink a ton of money into the expansion.
By keeping a close eye on the big-picture metrics, founders can track growth, understand who their customers really are, and answer the tough questions that will define the company's future. It gives them the clarity and conviction to lead with confidence.
Choosing the Right Analytics Platform for Your Needs
Picking the right web analytics tool isn't just a technical choice—it's a strategic one that defines how you handle, own, and act on your data. The decision really boils down to two main paths: using a hosted solution (often called Software-as-a-Service or SaaS) or setting up your own self-hosted platform. Each route has its own distinct pros and cons that fit different business needs.
Think of it like deciding where to live. A hosted solution is like renting a fully furnished apartment. It’s convenient, all set up, and the landlord takes care of all the maintenance. You can move in and start living right away without worrying about the pipes or wiring.
This is the perfect option for teams that want to get going quickly without needing a ton of technical work. The provider manages all the servers, security, and updates, so you can focus on one thing: digging into your data to find valuable insights.
Hosted vs Self-Hosted Analytics
On the flip side, a self-hosted platform is like building your own house from the ground up. You have total freedom over the blueprint, the materials, and every last detail. It’s a bigger project that demands more effort, resources, and expertise, but what you get in the end is a space that’s 100% yours and built to your exact needs.
This approach is a game-changer for businesses with strict data privacy requirements, specific technical setups, or the need for complete data ownership. When you run the software on your own servers, you can be certain that no third party ever touches your sensitive user data. This gives you ultimate control and a real sense of security when it comes to compliance. If you're curious to learn more, our complete guide on self-hosted web analytics covers everything you need to know.
Choosing between hosted and self-hosted analytics is a strategic decision. Hosted offers speed and convenience, while self-hosted provides unparalleled control, security, and data sovereignty.
Key Factors for Your Decision
To make the best call, you need to balance a few key factors with your company's goals and what resources you have on hand.
Cost: Hosted platforms usually come with a monthly or annual subscription fee. Self-hosting, on the other hand, involves an initial investment in servers plus ongoing costs for maintenance.
Technical Resources: Do you have people on your team who know how to set up, manage, and secure a server? If not, a hosted solution is probably the more practical and less stressful option.
Scalability: Think about where your business is headed. Hosted providers automatically handle scaling as your traffic grows. With a self-hosted setup, you have the freedom to scale your infrastructure however you see fit, but you're responsible for making it happen.
Compliance and Ownership: If you're in a field with strict regulations like healthcare or finance, the absolute data control you get from self-hosting isn't just a nice-to-have—it's often a must.
Got Questions? Let's Talk Web Analytics
If you're just getting into web analytics, you've probably got a few questions buzzing around. That's perfectly normal. Let's clear up some of the most common ones so you can feel confident in your data.
What's the Difference Between Web Analytics and SEO?
It’s easy to mix these two up, but they play very different roles. Think of them as two sides of the same coin.
- SEO (Search Engine Optimization) is all the work you do to get people to find your website on Google and other search engines. It's about making your site more attractive to get visitors in the door.
- Web Analytics kicks in once they arrive. It’s the tool that shows you what people actually do on your site—which pages they visit, how long they stick around, and where they came from.
So, SEO is your strategy to get traffic, while web analytics is the feedback that tells you if that traffic is any good. You need both to succeed.
How Quickly Will I See Data After I Install the Script?
You'll start seeing data almost instantly. Once the tracking script is live on your site, you should see real-time metrics like active users and pageviews pop up in your dashboard within minutes.
But hold on before you start making big changes.
A few minutes of data isn't enough to tell you anything meaningful. You need to let your analytics tool run for at least a few weeks to establish a baseline of what "normal" traffic looks like for your site.
This gives you a solid foundation. Once you know your baseline, you can spot unusual spikes or dips and accurately measure how your marketing campaigns are performing.
Can I Really Do Web Analytics Without Cookies?
Yes, you absolutely can. This is a huge and important shift happening in analytics. Modern, privacy-first tools are built from the ground up to operate without cookies. They focus on tracking anonymous events and aggregated data, not individuals.
This way, you still get the essential insights you need—like which pages are most popular or where your visitors are coming from—without compromising anyone's privacy or getting tangled up in GDPR headaches.
Is Google Analytics My Only Option?
Not by a long shot. While Google Analytics is the big name everyone knows, there's a growing world of fantastic alternatives, especially if you care about user privacy.
Tools like Plausible, Fathom, and of course, Swetrix, provide powerful insights without collecting personal data or relying on cookies. The right tool for you really comes down to what you value most, whether it's privacy, simplicity, or owning your own data.
Ready to get clear, actionable insights without compromising user privacy? Swetrix offers a powerful, cookie-free analytics platform designed for modern businesses. Start your 14-day free trial and see your website data in a whole new light.