- Date
What Are Page Views and How Do They Work
 Andrii Romasiun
At its core, a page view is the simplest metric you'll find in web analytics. It's counted every single time a page on your website is loaded or reloaded by a browser.
Think of it this way: your website is like a popular museum. A page view is like the clicker a guard uses at the entrance to each exhibit room. Every time someone walks into a room, click. It doesn't matter if it's the same person walking in and out of the same room 10 times, or 10 different people walking in once. The clicker counts every single entry.
What a Page View Really Is
That simple click—the page view—is the foundation of measuring website traffic. It's a raw, unfiltered count of how many times your content has been requested and loaded for a visitor.
This might seem basic, but it's the starting point for almost every deeper analysis.
How a Page View Gets Counted
So, what happens behind the scenes? When a visitor clicks a link to your site or types in the URL, their browser sends a request to your server. The server then sends back all the files needed to build the page (like HTML, CSS, and images).
The final piece of the puzzle is your analytics tracking script, whether it's from a tool like Google Analytics or a privacy-focused one like Swetrix. As soon as that script loads, it fires off a signal that says, "Hey, this page was just viewed!" and a page view is officially logged.
A page view is recorded the moment the tracking script on a webpage executes. This is why every single load—including hitting the refresh button or using the "back" button to return to a page—counts as a brand new page view.
This is a crucial distinction to make. A page view is purely a count of page loads, not a count of the people visiting your site. Grasping this helps you avoid common misinterpretations of your data.
For example, if you see a page has a really high number of views, it could mean several different things:
- It's a hit! Lots of different people are flocking to see that popular piece of content.
- Something is happening. A user might be reloading the page over and over, maybe to check for live sports scores or updates on a news feed.
- They're stuck. A visitor could be confused, repeatedly returning to a page because they can't figure out where to go next.
A page view tells you what pages are being seen. It's the first clue in your investigation, but to get the full story, you need to pair it with other metrics that tell you more about the who, how, and why behind the traffic.
Page Views vs. Sessions vs. Unique Users
This is where web analytics can start to feel a little fuzzy. Page views, sessions, and unique users all sound similar, but they measure completely different things. Getting them mixed up is a common mistake, and it can seriously skew your understanding of how your site is actually performing.
Think of it this way: these three metrics work together to tell a story about your website's traffic. Let's use an analogy to make it crystal clear.
Imagine your website is a local library.
The Library Analogy Explained
In our library, each metric tracks a specific type of activity:
- Unique User: This is simply one person who walks into the library. Even if they leave for lunch and come back later, they are still just one person.
- Session: This is one complete visit. A person comes in, reads for a while, and leaves—that's one session. If they return a few hours later, that kicks off a brand new session.
- Page View: This is every single book they pull off the shelf to look at. During one visit (a single session), they might look at 10 different books. That translates to 10 page views.
So, one unique user can start multiple sessions over time, and each of those sessions can contain many page views. Want to dive deeper into this? We have a whole guide on how to track unique visitors in web analytics.
This simple flow chart helps visualize how it all connects, from the big picture of your website down to a single page view event.
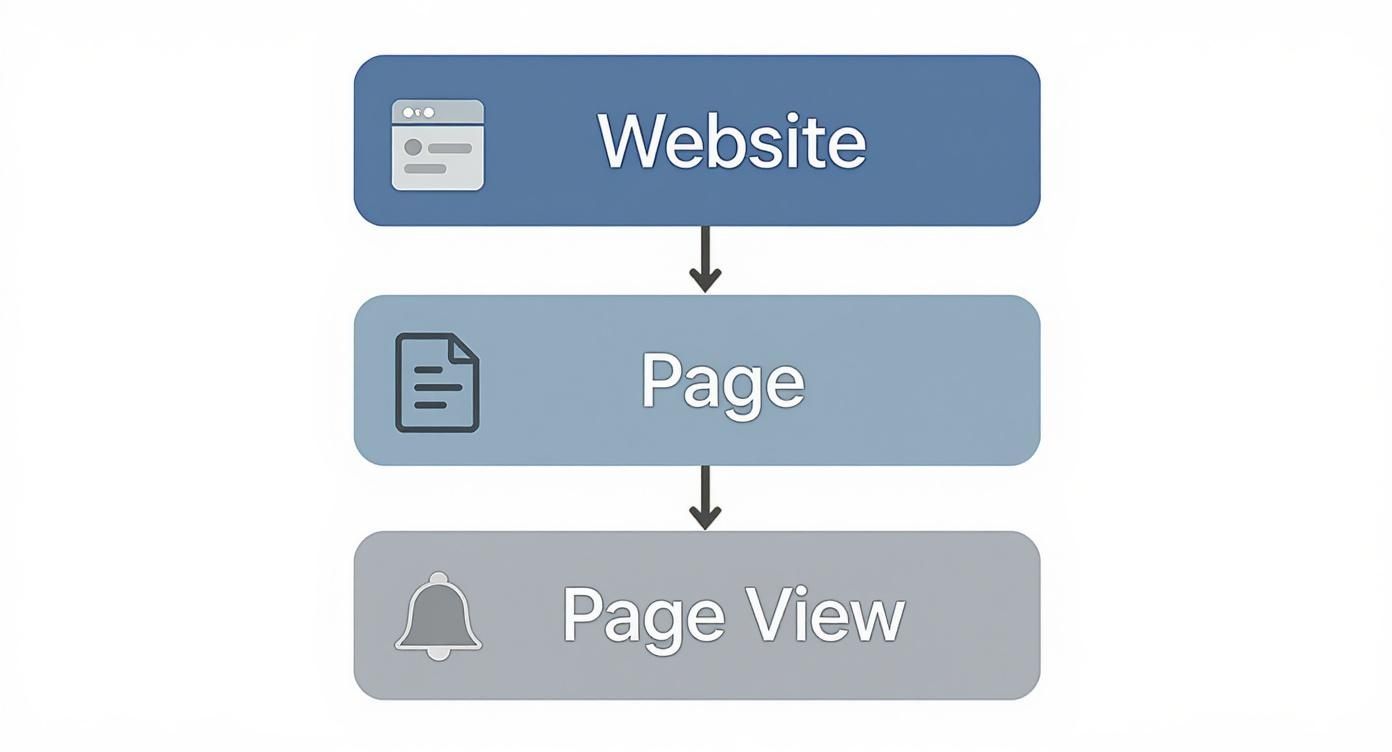
As you can see, the page view is the most basic action someone takes on a page. It's the fundamental building block of all their activity.
To make these distinctions even clearer, here’s a quick side-by-side comparison.
Key Metrics Comparison
| Metric | What It Measures | Library Analogy |
|---|---|---|
| Page View | A single instance of a page being loaded in a browser. | A person looking at one book. |
| Session | A group of user interactions within a given time frame. | A single, complete visit to the library. |
| Unique User | An individual person visiting your site during a specific period. | One individual person who visits the library. |
Seeing them laid out like this really helps highlight how each one provides a different piece of the puzzle.
Putting It All Together
Let's walk through a quick, practical example. Say someone finds your blog on Google. They read your latest article, click an internal link to a related post, and then check out your "About Us" page before leaving.
Here’s the final tally for that interaction:
- 1 Unique User
- 1 Session
- 3 Page Views
It's pretty straightforward, right? But when you start looking at these numbers at a massive scale, they become truly mind-boggling. Take Google.com, for example. It racked up an estimated 168.67 billion page views in 2023 alone. What's even more telling is that a whopping 83.64% of those views came from mobile devices—a powerful reminder of where user attention is today.
Once you can clearly distinguish between these metrics, you can start moving beyond just counting clicks and begin to actually understand user behavior. A high number of page views from one user in a single session might signal they're deeply engaged. Or, it could mean they're totally lost and can't find what they're looking for. The context is everything.
Why Your Page View Data Might Be Wrong
So you're looking at your page view count and feeling pretty good. It's a big number, and big numbers are great, right? Well, maybe. It’s a common trap to think that your total page views perfectly mirror your audience size, but the raw data often tells a skewed story.
The truth is, not every "view" comes from a potential customer or an avid reader. A whole host of things can pump up those numbers, giving you a distorted picture of how your website is really performing. When your analytics tool says a page was loaded, it counts everything—legitimate visitors, sure, but also automated bots, your own team clicking around, and even a single user hitting refresh over and over.
Getting a grip on these sources is the first step toward cleaning up your data and making decisions based on reality, not just vanity metrics.

Common Sources of Inflated Page Views
Let's pull back the curtain on the usual suspects that mess with your analytics. If you ignore them, you might think a marketing campaign is a smashing success when it's not, or that a particular blog post is way more popular than it actually is.
By far the biggest source of non-human traffic comes from bots. These are just automated scripts, crawling the web 24/7 for all sorts of reasons.
- Search Engine Crawlers: Think of the bots from Google and Bing. They have to "view" your pages to index them for search results. They’re essential for SEO, but every visit they make gets logged as a page view.
- Malicious Bots: On the shadier side, some bots scrape your content for spam or other sketchy purposes, creating "ghost" traffic that offers zero value.
- Monitoring Services: Even helpful tools, like uptime monitors that ping your site to make sure it’s online, add to the page view count.
Another huge culprit? Internal traffic. This is simply all the activity from you and your team. Every time a developer tests a new feature, a writer proofs an article, or a designer checks a layout, another page view is generated. If you have a large team or folks who are constantly working on the site, this can add up fast.
Finally, don't forget about user reloads. Picture a visitor repeatedly refreshing a page to see live sports scores, track an auction, or wait for a product to come back in stock. While this is genuine user engagement, it doesn't mean you have a wider audience—it just means one person is generating dozens of page views in a single session. To get a better sense of the mechanics, you can learn more about how a web analytics tracking script logs these events.
By filtering out bot and internal traffic, you can move from a vanity metric to an actionable one. The goal isn't just a bigger number—it's a clearer understanding of genuine visitor engagement.
How Page Views Inform Your Business Strategy
Knowing what a page view is is one thing. Knowing what to do with that information is where the real magic happens. Page views aren't just a number to brag about; they're a compass for your entire business, pointing you toward what your audience loves and where they're losing interest. This data is the raw material for smarter marketing and better product decisions.
For anyone in marketing, page views are the first, most immediate sign of life for any campaign. Did you just launch a new ad or send out an email blast? A jump in page views on your landing page tells you, in no uncertain terms, that people are showing up.
Using Page Views for Marketing Insights
By keeping an eye on page views, marketing teams can get a feel for the content that truly connects with their audience. It's less about guessing and more about listening to what the numbers are telling you.
- Which blog posts are taking off? A sudden spike in traffic to an article is a clear sign you've hit on a hot topic that people are excited to share.
- Is our new ad campaign actually driving traffic? Watch the page views on the product page you linked to. If they’re climbing, your ad is doing its job and getting people to click.
- What should we write about next? If posts about a certain subject consistently pull in high numbers, you’ve found a topic your audience craves. It's time to give them more of it.
This feedback is almost instant. It lets you quickly double down on what’s working and rethink what isn’t, making sure your time and money are spent where they'll make the biggest difference.
Guiding Product Development and User Experience
It’s not just for marketers. Product teams lean on page view data to see how people actually interact with a website or app. It’s a simple way to see which features get all the attention and which ones are collecting dust, which helps prioritize what to build or improve next.
Imagine you run an e-commerce store. If one particular product page is getting tons of views day after day, that's a powerful signal. That insight can drive decisions about stocking inventory, creating a special promotion, or even tweaking the page layout to make buying even easier.
Page views are the digital footprints your users leave behind. By following these trails, you can create better user journeys, identify popular features, and discover hidden opportunities for growth.
Think about a SaaS company that notices a help page for a major feature is getting almost no traffic. That’s not just a low number—it's a warning sign. Maybe the link is buried, maybe it's broken, or maybe users have no idea the feature even exists. That single metric can kick off an investigation that leads to a simple UI fix, boosting feature adoption and making customers happier.
The scale of this online activity is staggering. In 2025, Google is expected to hit 111.9 billion page views every month, with platforms like YouTube and Amazon also pulling in tens of billions. These aren't just vanity stats; they show that page views are a core measure of how people engage with just about everything online. You can discover more about the world's most visited websites to see just how big the numbers get.
Moving Beyond Page Views to Measure Real Engagement
Seeing a high page view count can feel like a big win, but let's be honest: on its own, it’s often just a vanity metric. Real insight comes from figuring out what people are doing on your pages, not just that they landed there. To get the full story, you have to look beyond this single number and pair it with metrics that show genuine engagement.
Think of yourself as a chef. Knowing that a hundred people ordered your signature dish (the page view) is great news. But did they finish it? Did they love it? Or did they take one bite and leave? Without that extra context, you're just guessing whether the dish is actually a hit.
Key Metrics for Deeper Context
To tell the difference between a fleeting click and real interest, you need to look at page views alongside other key performance indicators. These metrics add crucial layers of understanding to your raw traffic data.
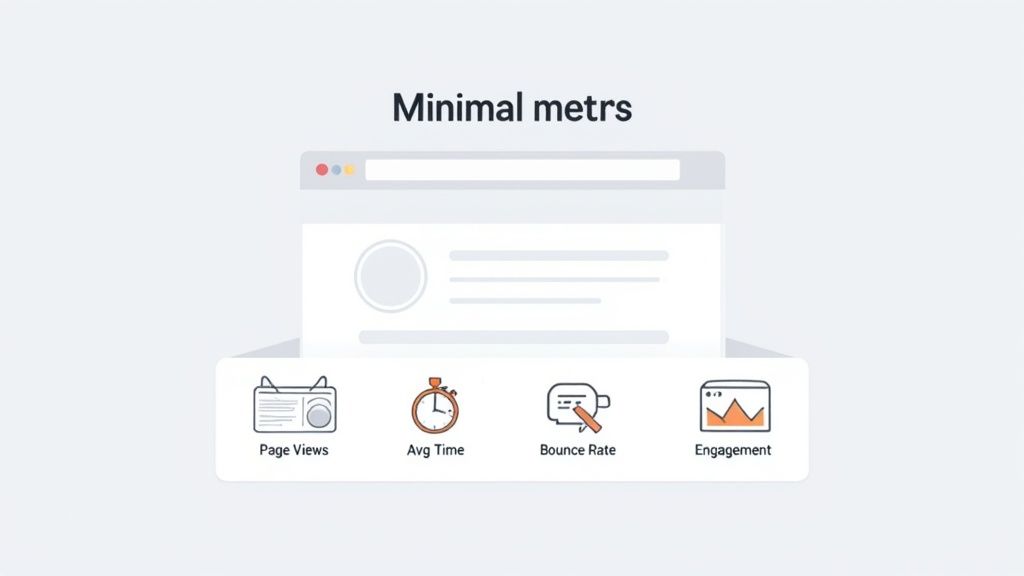
Here are the essential ones to watch:
- Average Time on Page: This tells you how long, on average, someone spends on a specific page. A longer time usually means the content is compelling and has grabbed their attention.
- Bounce Rate: This is the percentage of people who land on a page and then leave your site without taking any other action, like clicking a link or moving to another page. A high bounce rate can be a red flag.
- Exit Rate: This shows the percentage of visitors who leave your entire site from a particular page. It helps you pinpoint the last thing a user sees before their session ends.
Let's face it, a page with 10,000 views, an average time on page of five seconds, and a 90% bounce rate isn't a success story. It’s a massive signal that the page isn't meeting visitor expectations, even if it's great at attracting clicks.
True engagement isn't just about attracting eyeballs; it's about holding attention. Combining page views with metrics like time on page and bounce rate transforms your data from a simple headcount into a powerful narrative about user experience.
Telling a Complete Story with Data
When you start combining these metrics, a much clearer picture emerges. For instance, you might see that your homepage gets tons of page views but also has a high exit rate. This could mean visitors are finding exactly what they need immediately, or it could mean your navigation is confusing and they're just giving up. The next step is to dig in and figure out why.
Similarly, a blog post with moderate page views but a very high average time on page is a hidden gem. This tells you that the people who do find it are deeply engaged with what you've written. That’s solid gold information that can guide your future content strategy.
Consider that the average time spent on a single page view is between 52 and 54 seconds, and websites with videos see users stick around 88% longer. This shows just how much rich content can impact these numbers. You can explore more about website engagement statistics to see how this plays out on a larger scale.
By weaving these data points together, you move from simply counting page views to truly understanding user behavior. This is what allows you to make smart decisions that actually improve the user experience and help you hit your goals.
How Privacy Changes Are Shaking Up Page View Tracking
For a long time, the world of web analytics ran on a simple, powerful tool: the third-party cookie. These little text files, stored right in a user's browser, were the workhorses behind tracking page views, connecting a user's journey across different visits and even different websites.
But that era is quickly coming to an end. With landmark privacy laws like GDPR and CCPA now in effect, and browsers like Safari and Firefox already blocking these cookies, the old way of doing things is officially broken. This shift makes it much harder for traditional analytics platforms to link page views to a single user over time, creating gaps in the data.
The New Standard: Cookieless Tracking
This privacy-first reality has opened the door for a new generation of analytics tools. Instead of depending on cookies that follow users around the internet, these modern solutions find clever ways to count page views and measure traffic without compromising user privacy.
The fundamental change is moving from tracking people to tracking events. A page view is simply recorded as an anonymous event—a page was loaded. That's it. It’s not tied back to a detailed, persistent profile of an individual, allowing you to get the crucial traffic data you need without crossing any privacy lines.
By focusing on the event itself (the page load) rather than the individual behind it, privacy-first analytics provides accurate page view counts without compromising user trust. This is the future of responsible data measurement.
So, How Does It Actually Work?
Privacy-focused tools use a few different techniques to pull this off. Some might use session-based identifiers that disappear after a short period, or they might create anonymous IDs that can't be used to follow someone from one website to another. This lets them accurately measure sessions and page views without collecting or storing personal data.
These methods aren't just about compliance; they're about building trust with your audience. If you want to dive deeper into the technical side, you can learn more about how cookieless web tracking works and see why it’s becoming the go-to approach. Ultimately, this evolution means you can still get a clear answer to the question "what are page views" for your site, all while putting your visitors' privacy first.
Still Have Questions About Page Views?
Even after you get the hang of the basics, some specific questions always seem to pop up once you start digging into your own analytics. Let's tackle a few of the most common ones to clear up any confusion about what page views are really telling you.
Does Reloading a Page Count as Another Page View?
Yes, it absolutely does. Every single time a browser asks the server to load a page, it's counted as one page view. This includes hitting the refresh button, using the back button to return to a page you just left, or even clicking the same link twice in a row.
This is a crucial point to remember: page views measure page loads, not the number of unique people visiting your site.
Is a Higher Page View Count Always a Good Thing?
Not necessarily. While a big page view number often looks great and can mean you have strong traffic, the context behind that number is what truly matters. A rising count isn't automatically a win, and you need to understand the "why" behind it.
For instance, a sudden spike in page views could be a fantastic sign:
- Viral Content: Your latest blog post or landing page is taking off and being shared everywhere.
- Effective SEO: Your hard work is paying off, and more people are finding you through search engines.
On the other hand, it could also signal a problem:
- Poor Navigation: Users are getting lost and clicking around in circles, reloading pages because they can't find what they're looking for.
- Broken Features: Someone is repeatedly refreshing a page, hoping a broken button or form will finally start working.
The real story isn't in the page view count alone, but in how it connects with other metrics. A page with tons of views but an average visit time of only 5 seconds is a warning sign, not a victory lap.
How Can I Get More Page Views on My Website?
If you want to increase your page views in a meaningful way, your goal should be to boost user engagement—not just to inflate a number. You want people to explore your site because they're genuinely finding value in what you're offering.
Here are a few strategies that actually work:
- Improve Your Internal Linking: Make it easy for readers to discover other relevant content. If they love one article, guide them directly to another one they'll find just as useful.
- Create Outstanding Content: Publish articles, guides, and resources that solve your audience's problems so well that they can't help but stick around to learn more.
- Speed Up Your Website: A faster, smoother experience encourages visitors to click through to more pages instead of bouncing out of frustration.
At the end of the day, a well-designed site packed with compelling content naturally encourages people to view more pages per session. That gives you a much healthier and more accurate picture of how engaged your audience really is.
Ready to get clear, actionable insights without compromising user privacy? Swetrix provides powerful, cookie-free analytics that help you understand your traffic and make smarter decisions. Start your 14-day free trial today.