- Date
Mastering User Retention Metrics for Sustainable Growth
 Andrii Romasiun
User retention metrics are how you measure your ability to keep customers coming back. They're the key performance indicators (KPIs) that tell you whether people see real, ongoing value in your product long after the initial novelty wears off.
Think of these metrics as a health report for your customer relationships.
Why Retention Metrics Are Your True North for Growth
It's tempting to focus all your energy on getting new users. That initial rush is exciting, but it’s a costly battle if you can't get them to stick around.
Picture your business as a bucket you're trying to fill with water (users). If that bucket is riddled with holes, you'll be running back and forth with more water just to keep the level from dropping. You're working hard but never actually making progress. This is the classic "leaky bucket" problem that trips up so many businesses.
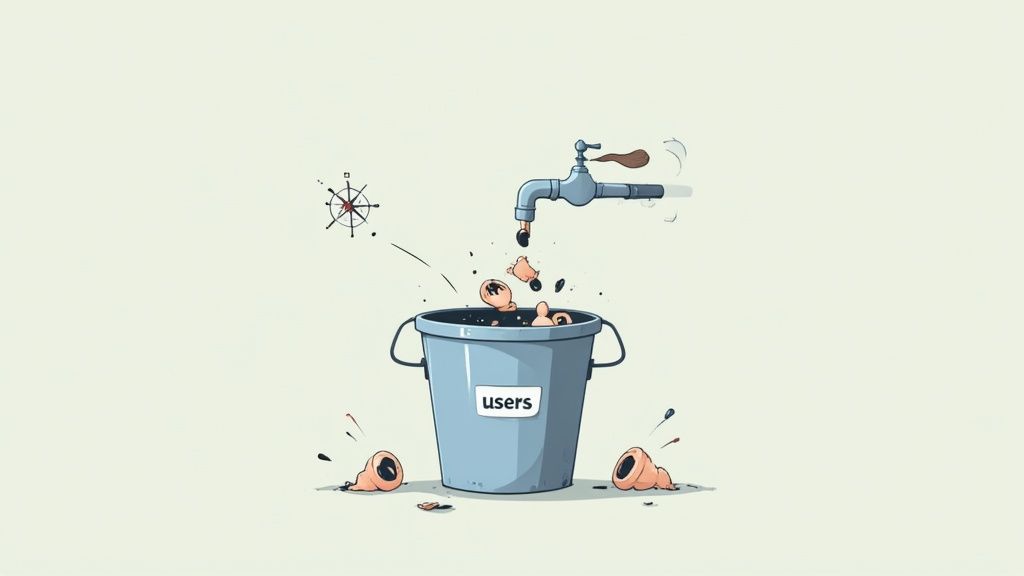
This is where user retention metrics become so important. They aren't just abstract numbers on a dashboard; they’re the tools you use to find and patch those leaks.
Shifting Focus from Acquisition to Value
For too long, the startup world has equated growth with acquisition. Getting new people through the door is obviously important, but real, sustainable growth comes from the customers who decide to stay. After all, retaining an existing customer is 5 to 25 times more cost-effective than acquiring a new one.
Shifting your mindset from pure acquisition to retention is a game-changer for several reasons:
- Predictable Revenue: A stable user base gives you a reliable, recurring revenue stream. For any subscription business, this is everything.
- Increased Profitability: Loyal customers do more than just stick around. They spend more over time and are often the first to buy new products or upgrade their plans, which directly increases their lifetime value (LTV).
- Organic Growth: Happy, long-term users become your best marketers. They tell their friends, write reviews, and bring in high-quality new customers—all for free.
In essence, user retention metrics don't just measure loyalty; they measure the true health and long-term viability of your product. They tell you if you've built something that people genuinely need, not just something they were curious enough to try once.
By tracking these critical numbers, you stop guessing why users leave and start knowing exactly where your product experience needs work. This guide will walk you through the essential metrics that provide this clarity, helping you turn that leaky bucket into a strong foundation for real, lasting growth.
The Four Retention Metrics You Can't Ignore
Once you're sold on why retention is so important, the next question is always, "How do I actually measure it?" While you can slice and dice user data in countless ways, a few core metrics will give you the clearest, most honest look at your product's health. These are the vital signs that tell you if users are sticking around for the long haul or quietly heading for the exits.
Think of these four metrics as the essential gauges on your product's dashboard. Each one tells a different part of the story, from overall user loyalty to the real-world financial impact of keeping a customer. Let's break them down, minus the confusing jargon.
1. Retention Rate: Your Product's Loyalty Score
This is the big one. Your Retention Rate is the single most important metric for understanding user loyalty. It answers one simple but powerful question: "Of all the people who signed up in a specific timeframe, how many are still around later?" It's a direct reflection of your product's ability to create and sustain value.
A high retention rate is a clear signal that you've built something people genuinely need. A low one? It's a flashing red light telling you there's a gap between what you promised and what you're delivering.
To calculate it, you just need three numbers:
- The number of users you had at the start of the period (S).
- The number of users you had at the end of the period (E).
- The number of brand-new users you picked up during that period (N).
The formula is pretty straightforward: Retention Rate = [ (E - N) / S ] * 100
Let's run through a quick example. Imagine you start the month with 1,000 active users. Over the next 30 days, you acquire 200 new ones, and by the end of the month, your total user count is 950.
Your calculation would look like this: [ (950 - 200) / 1,000 ] * 100 = 75%
That 75% means you successfully held onto three-quarters of your original user base. This number is your baseline for loyalty.
2. Churn Rate: Your Product's Breakup Rate
If retention is about who stays, Churn Rate is all about who leaves. It’s the other side of the same coin, measuring the percentage of users who stop using your product over a set period. While looking at retention feels good, looking at churn is what forces you to get honest about why people are walking away.
Understanding your churn rate is absolutely critical because it points directly to friction and dissatisfaction. A rising churn rate is your earliest warning that something’s off—maybe a buggy new feature, a poorly communicated price change, or a savvy new competitor.
Calculating churn is even simpler:
- The number of users who left during the period (L).
- The number of users you had at the start of that period (S).
The formula is just: Churn Rate = ( L / S ) * 100
So, if you started the month with 500 users and 25 of them either cancelled their subscription or went inactive, your churn rate would be: ( 25 / 500 ) * 100 = 5%
A 5% monthly churn might not sound like much, but don't be fooled. It compounds fast. Over a year, that small leak can turn into a major drain on your user base and revenue. For a deeper look, check out our complete guide on how to calculate and reduce your churn rate.
The Retention and Churn Relationship: Think of these two as a seesaw. In the simplest terms, they are inversely related. If your monthly retention rate is 90%, your churn rate is 10%. Tracking both gives you a complete picture of who's coming, who's going, and who's staying.
3. DAU/MAU Ratio: The "Stickiness" Factor
Are people just popping in once a month, or is your product a part of their daily routine? The Daily Active Users (DAU) to Monthly Active Users (MAU) ratio—often just called the "stickiness ratio"—tells you exactly that. It reveals just how frequently your active users are coming back.
- DAU: The number of unique users who open your app or site on a single day.
- MAU: The number of unique users who show up at least once over a 30-day period.
The formula is: Stickiness Ratio = ( DAU / MAU ) * 100
A higher ratio is a great sign; it means a bigger chunk of your monthly users are returning daily, which is how habits are formed. A low ratio suggests people only engage sporadically. That might be perfectly fine for something like a tax-filing app, but it's a huge red flag for a social media platform or a team collaboration tool.
For instance, if you have 1,000 DAU and 5,000 MAU, your stickiness ratio is 20%. This tells you the average user is active on roughly 6 days out of the month (30 days * 20%). It's a metric that helps you see the *intensity* of engagement, not just the raw numbers.
4. Customer Lifetime Value (LTV): The Total Worth of a User
Let's talk money. Customer Lifetime Value (LTV) is a predictive metric that estimates the total revenue you can expect from a single customer over the entire course of their relationship with you. It takes you beyond short-term engagement and quantifies the long-term financial payoff of great retention.
Knowing your LTV is a game-changer. It tells you exactly how much you can afford to spend to acquire a new customer (your Customer Acquisition Cost, or CAC) and still run a profitable business. A healthy LTV to CAC ratio is often cited as 3:1 or higher—meaning a customer is worth at least three times what you paid to get them.
A simple LTV calculation uses two key inputs:
- Average Revenue Per User (ARPU) over a specific time (like a month).
- Average Customer Lifetime (how long a customer typically sticks around).
The formula is: LTV = ARPU * Average Customer Lifetime
If your average user pays $30 per month and stays with you for an average of 24 months, their LTV would be $720. That means every new customer you bring in is worth $720 in revenue over time. When you improve retention, you directly increase customer lifetime, which sends your LTV soaring.
In the software and SaaS world, these metrics tell a particularly stark story. Globally, software companies typically retain only about 39% of users after one month, and that number drops to 30% after just three months. This sharp decline highlights the massive challenge of keeping users engaged past that initial "wow" phase. You can find more insights in these user retention rate benchmarks on Pendo.com. These four metrics are your best tools for fighting that drop-off and building a product that people can't live without.
Uncovering Deeper Insights with Advanced Analysis
Once you’ve got a handle on the foundational metrics, you have a solid picture of what’s happening with your user base. But to understand why it's happening, you need to dig a bit deeper. Advanced analysis techniques move past the simple averages to pull back the curtain on the nuanced stories hidden in your data.
Think of it as switching from a standard camera to a high-speed one. Suddenly, you can see all the subtle movements and critical moments that truly define the user journey. By segmenting users and tracking meaningful actions, you can diagnose problems with surgical precision and build an experience that genuinely connects.
This diagram shows how all the core retention metrics are interconnected—retaining users directly impacts churn, active user counts, and lifetime value.
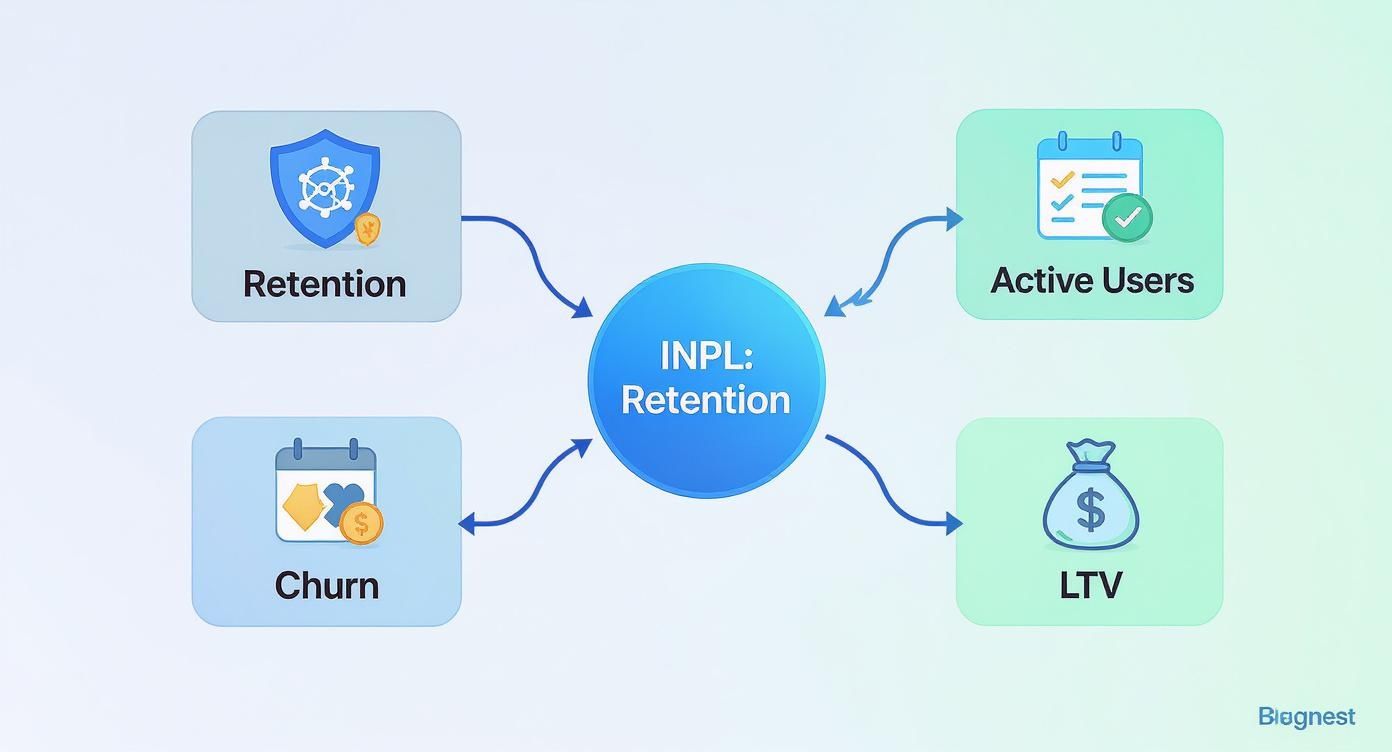
As you can see, a strong retention strategy creates a positive feedback loop, fueling a cycle of sustainable growth across the board.
Pinpointing Trends with Cohort Analysis
Imagine your users are like different graduating classes. The class of 2022 had a unique experience—different professors, campus events, and curriculum—than the class of 2023. You wouldn't just lump them all together to measure their success, right?
Cohort analysis applies that exact same logic to your user base. It groups users into "cohorts" based on a shared starting point, usually the week or month they signed up. You might have a cohort for everyone who joined in January, another for February, and so on.
Tracking these groups separately allows you to see how your product changes actually affect long-term retention. Did that big feature you launched in March really make new users stick around longer than the ones who signed up in February? Cohort analysis gives you the answer.
A cohort retention table is your best friend here. It visually lays out the data, showing the percentage of users from each cohort who are still active over time. This format makes it incredibly easy to spot trends and measure the real impact of your product updates.
Moving Beyond Logins with Event-Based Retention
Just knowing a user logged in doesn't tell you much. Did they find value? Or did they open your app, get confused, and leave immediately? Event-based retention cuts through the noise by focusing on what truly matters: tracking whether users perform specific, value-driving actions again and again.
Instead of just asking, "Did the user come back?" this method asks, "Did the user complete a key action again?" These "events" are the milestones that signal a user is getting real value from your product.
- For an e-commerce app: It's making a second purchase.
- For a project management tool: It's creating a third project board.
- For a music streaming service: It's building another playlist.
Basing retention on these specific actions gives you a far more accurate measure of "real" engagement. It helps you see if users are adopting the core loop of your product and achieving what they came for. This method is even more powerful when combined with other tools; for instance, you can see how it works with funnel analysis in our detailed guide.
Measuring Habit Formation with Product Stickiness
Is your product a daily habit or a monthly chore? The DAU/MAU ratio, which we call Product Stickiness, tells you exactly that. As we touched on earlier, this metric calculates the percentage of your monthly active users who are engaging with your product on a daily basis.
The formula is straightforward:
Stickiness Ratio = (Daily Active Users / Monthly Active Users) * 100
A high stickiness ratio is the gold standard for many products, especially in social media, communication, or productivity. It’s a clear sign that you've become an indispensable part of your users' daily routine. A ratio of 20% or higher is generally considered good for many SaaS products, while elite social platforms can hit 50% or more.
Think of it like a local coffee shop. Some customers might pop in once a month, but it's the regulars who come in every single morning that are the foundation of the business. The stickiness ratio helps you measure just how many of those daily, habitual users you've managed to create. It’s a powerful lens for viewing your user retention metrics through the crucial context of genuine user habits.
How to Measure and Benchmark Your Metrics
Knowing your user retention metrics is one thing. Actually using them to drive real growth is a completely different ballgame. To get from theory to practice, you need a smart way to measure what’s happening and a clear understanding of what "good" even looks like for your industry. Without that context, your data is just noise.
The right tools make all the difference here. A privacy-first analytics platform like Swetrix lets you track user behavior, map out customer journeys with funnels, and analyze cohorts without creepy data practices. This ethical approach is a win-win: you get the insights you need while building the kind of trust that keeps users coming back.
Setting Up Your Measurement Framework
To really get a handle on retention, you need a system that captures the entire user journey. This starts by pinpointing the key actions—or events—that tell you a user is actually getting value from your product. These are the "aha!" moments that turn a casual visitor into a loyal fan.
Once you’ve identified these critical events, you can build funnels to see exactly where people are getting stuck and dropping off. A funnel is just a visual map of the steps a user takes to reach a goal, whether that's signing up, completing onboarding, or making a purchase. It’s a dead-simple way to see where the friction is.
For example, this funnel shows the path a new user takes to sign up.
A quick glance tells you exactly where most people are giving up. Now you know precisely which part of the process needs fixing. You can keep an eye on all these user paths from a single web analytics dashboard, so your most important metrics are always front and center.
Understanding Industry Benchmarks
Your retention rate doesn't exist in a vacuum. A 40% retention rate might be phenomenal in one industry but a massive red flag in another. This is where benchmarking comes in. It provides the context you need to set realistic goals and see how you’re doing compared to everyone else.
Benchmarking turns raw data into strategic intelligence. It helps you distinguish between a problem unique to your product and a challenge inherent to your market, guiding you to make smarter decisions about where to invest your resources.
Customer retention rates swing wildly from one sector to the next, mostly because of how often customers need a service. For instance, financial services typically see an average retention rate of around 78%, while the hospitality and travel industries hover closer to 55%. Media and professional services lead the pack at roughly 84%, thanks to recurring content or ongoing client needs. The mobile app world, however, is a brutal battlefield; the average 24-month retention for social apps is a tiny 8.7%. You can dig deeper into these varying customer retention rates on ExplodingTopics.com.
Here are a few general benchmarks to keep in your back pocket:
- SaaS Products: For established companies, a good monthly retention rate is anywhere from 92-95%. If you’re an early-stage startup, hitting 85-90% monthly retention is a fantastic sign that you’ve found product-market fit.
- E-Commerce: Here, the game is all about the repeat purchase rate. A rate of 25-30% is a healthy target, showing that a solid chunk of your customers are coming back for more.
- Mobile Apps: This is one of the toughest arenas. If you can keep more than 20% of your users around after the first 90 days, you’re doing something right. Most apps see a massive drop-off after just one or two sessions.
By consistently measuring your key retention metrics and stacking them up against the right industry benchmarks, you can set meaningful goals, spot your weaknesses, and build a clear roadmap for creating a product that people don’t just try, but stick with for the long haul.
Proven Strategies to Improve User Retention
Understanding your user retention metrics is like getting a diagnosis from a doctor; it tells you what’s wrong. But to actually get healthy, you need a treatment plan. Let's move past the diagnosis and into the cure—actionable strategies that can turn those numbers around.

Each strategy we'll cover links directly back to the metrics we've discussed. The goal is to give you a clear path to boosting retention, cutting churn, and increasing the lifetime value of every single user you bring on board.
Create a Flawless Onboarding Experience
You only get one chance to make a first impression, and for your product, that happens during onboarding. A clunky, confusing, or overwhelming first few moments is a surefire way to kill retention before it even gets a chance to breathe.
The goal isn't to show off every shiny feature you've built. It's about getting the user to their first "aha!" moment as fast as humanly possible. What's that small, early win that makes them realize your product can solve their problem? For a project management tool, it might be creating their first task. For a design app, it could be exporting a simple graphic.
Focus on these principles to nail your onboarding:
- Guide, Don't Tour: Ditch the long, boring product tours nobody remembers. Use interactive walkthroughs that nudge users to complete a meaningful first action themselves.
- Segment New Users: A few simple questions at sign-up can reveal a user's goals. Use that information to tailor the entire onboarding flow to what they need to accomplish.
- Celebrate Small Wins: When a user completes a key step, pop up a quick in-app message to congratulate them. This kind of positive reinforcement creates momentum and makes them feel successful.
A smooth onboarding process has a direct and immediate impact on your early cohort retention curves. When users find value right away, they have a powerful reason to come back.
Personalize Communication and Engagement
Generic, one-size-fits-all emails and notifications make your users feel like just another number in your database. To build real, lasting loyalty, you have to talk to them like the individuals they are. This goes way beyond just plugging their first name into an email template.
True personalization is about sending the right message to the right person at the right time, based on what they're actually doing in your product. Did they suddenly stop using a key feature? Send them a helpful tip or a short tutorial video. Did they just reach a new milestone? Congratulate them and suggest a logical next step.
True personalization isn't about clever marketing tricks; it's about demonstrating that you understand a user's journey and are invested in their success. It's a proactive way to show value and prevent churn before a user even considers leaving.
Implement a Powerful Loyalty Program
Rewarding people for sticking with you is one of the oldest and most effective retention plays in the book. A well-designed loyalty program gives customers a compelling reason to stay with you instead of jumping to a competitor, which directly boosts repeat business and lifetime value.
The data backs this up. A deep dive into insights from over 130,000 US sales leaders found that loyalty programs are the single most effective retention strategy, with 59% of leaders endorsing them. You can see it in action with giants like Starbucks, where loyalty members drive an incredible 60% of total revenue. On the flip side, 41% of lost accounts were blamed on poor follow-up, showing just how much ongoing engagement matters. You can dig into more of these customer retention statistics from The Sales Collective.
Leverage User Feedback for Product Improvement
Your most engaged users are your single greatest source of product insight. They know what’s working, what’s broken, and what’s missing. Creating a system to actively collect, organize, and act on their feedback is a retention powerhouse. It doesn't just help you build a better product—it makes your users feel heard, valued, and invested in your success.
Here’s how to create a continuous feedback loop:
- Use In-App Surveys: Trigger short, contextual surveys right after a user interacts with a specific feature. Keep it simple and relevant.
- Create a Feedback Portal: Set up a dedicated place where users can submit ideas, vote on other suggestions, and see a public roadmap of what you're working on.
- Close the Loop: This is the most important step. When you ship a feature that a user requested, reach out to them personally to let them know. That small act builds an immense amount of goodwill.
When you turn user feedback into your product roadmap, you’re basically guaranteeing that you’re building something people actually want and will stick around for. This fundamental alignment is what drives product stickiness and healthy user retention metrics.
Frequently Asked Questions About User Retention
Even with a solid plan in place, you're bound to run into questions once you start digging into the nitty-gritty of user retention. Let's tackle some of the most common ones that pop up.
What Is a Good User Retention Rate?
This is the million-dollar question, and the honest answer is: it depends. A "good" number is completely tied to your industry. What looks fantastic for a mobile game would be a five-alarm fire for a B2B SaaS company.
That said, we can look at some general benchmarks to get our bearings.
For most SaaS businesses, holding onto 35% of your users after three months is a pretty strong signal. In e-commerce, it's all about repeat buyers; if you can get 25-30% of your customers to come back, you're building a healthy base. The mobile app space? It's a tough world out there. If you're keeping more than 20% of users around after 90 days, you're doing something right.
The real key is to stop chasing a universal number. Benchmark against your industry, sure, but more importantly, benchmark against yourself. The goal is steady, incremental improvement month over month.
How Often Should I Check My Retention Metrics?
The right frequency for checking your metrics really depends on the natural pulse of your business. If you're running a fast-paced mobile game where users come and go quickly, you should be looking at weekly cohorts. This lets you react fast to any sudden drops in engagement.
On the other hand, if you have a mature B2B SaaS product with long-term contracts, a monthly review of your cohort performance and churn rate makes more sense. It gives you a much cleaner signal without the daily noise. Daily or weekly check-ins are perfect for metrics like DAU/MAU to catch immediate trends, while the big-picture stuff like Customer Lifetime Value (LTV) is best reviewed quarterly or twice a year.
What Is the Difference Between Churn and Retention?
Think of retention and churn as two sides of the same coin. They measure the same thing from opposite perspectives, and that shift in perspective is surprisingly important.
- Retention Rate is the percentage of users who stuck around. It’s your success metric—it tells you how many people are still finding value in your product.
- Churn Rate is the percentage of users who walked away. This is your feedback metric—it points to friction, dissatisfaction, or a failure to deliver on your promise.
So, if your monthly retention is 85%, your churn is 15%. You need to track both because they prompt different, equally vital questions. Retention asks, "Why do our loyal users love us?" Churn asks, "Why did these users leave, and what could we have done differently?"
Can I Improve Retention Without a Big Budget?
Absolutely. Some of the most effective retention tactics have nothing to do with a big marketing spend. They're about being smart, empathetic, and focused.
The best place to start is by finding the biggest leaks in your user journey. For most products, that’s the onboarding process. Fix that, and you've solved a huge piece of the puzzle.
Here are a few low-cost, high-impact ideas:
- Smooth out your onboarding: Guide new users to that "aha!" moment as quickly and painlessly as possible.
- Send a personal welcome email: Make it genuinely helpful, not just another sales pitch.
- Ask for feedback (and act on it): Use simple in-app surveys to find out what your users are thinking.
- Create helpful content: Write tutorials, guides, or case studies that help people get more out of your product.
These aren't expensive initiatives. They're about building a relationship on a foundation of trust and value, which is what great retention is all about.
Ready to get a clear, ethical view of your own user retention metrics? Swetrix provides privacy-first web analytics to help you understand user behavior, build funnels, and track cohorts—all without compromising user trust. Start your 14-day free trial today.