- Date
How to Calculate Churn Rate and What It Reveals
 Andrii Romasiun
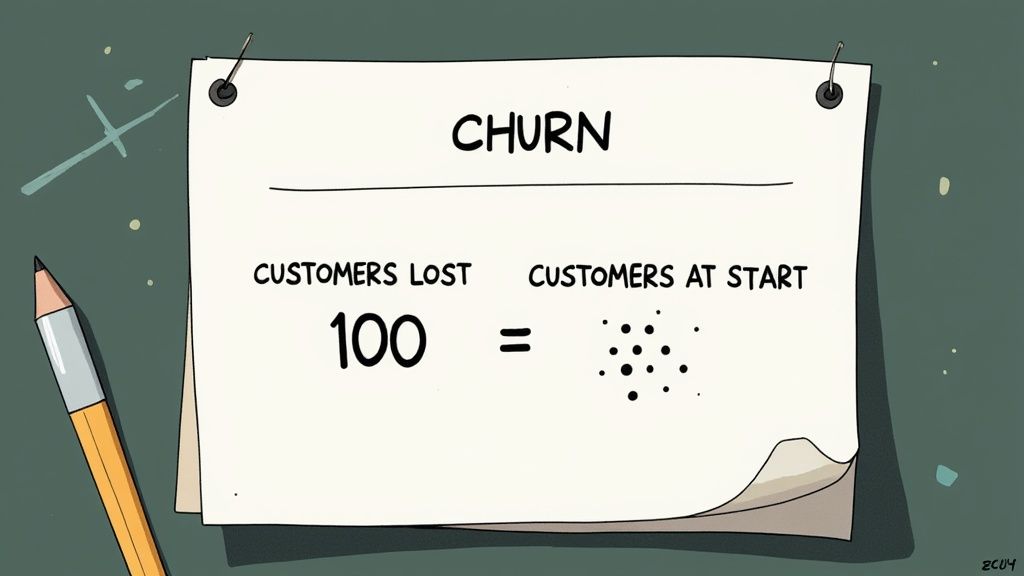
At its core, calculating your churn rate is straightforward. You take the number of customers who left during a specific timeframe, divide it by the number of customers you had at the start of that period, and then multiply by 100. The result is a simple percentage that tells a powerful story.
Why Mastering Churn Rate Is Non-Negotiable

Getting a handle on your churn rate is far more than a simple math problem—it’s a health check for your entire business. This isn't just another number to track; it's the narrative of your customer relationships, written in data. When you track churn accurately, you start to see the real reasons customers decide to leave, whether it's a gap in your service, a missing product feature, or a problem with your pricing.
The financial hit from ignoring churn is genuinely staggering. Projections show that by 2025, the worldwide cost of customer churn could balloon to $782 billion in lost revenue. That number alone should make it clear just how vital managing churn has become.
Mastering your churn rate is the first step toward understanding your customer base, improving your business performance, and creating lasting relationships that drive sustainable growth.
This metric provides the hard data you need to strengthen customer retention and safeguard your revenue. But let's move past the theory. The real goal is to turn this calculation into strategies that actually drive growth. By digging into who is leaving and when, you can uncover invaluable **user insights** that directly inform your product roadmap and marketing campaigns.
Ultimately, this foundational knowledge empowers you to:
- Improve Customer Retention: Pinpoint the real reasons for churn and roll out targeted solutions to keep your customers happy.
- Protect Revenue Streams: Even a small dip in your churn rate can have an oversized, positive impact on your bottom line.
- Build a Sustainable Business: A loyal customer base is the bedrock of long-term, predictable growth.
Let's Break Down the Basic Churn Rate Calculation
Before you can tackle customer churn, you need to know how to measure it. The good news is that the foundational formula is refreshingly simple. While you can certainly get more granular later on, this core calculation gives you the essential insight needed to understand customer attrition.
Here’s the classic formula I always start with:
(Customers Lost During Period ÷ Total Customers at Start of Period) x 100
This calculation produces a simple percentage, showing you how quickly you’re losing customers over a set timeframe. But before you can just plug numbers in, you have to be crystal clear on what those numbers actually mean for your specific business.
Nailing Down Your Core Metrics
The two variables that can trip people up are defining what a “lost customer” is and choosing the right “period” to measure. Getting this right from the start is absolutely critical for accurate and consistent tracking.
So, what counts as a lost customer? It really depends on your business model.
- For a SaaS business, it's usually straightforward: someone who actively cancels their subscription.
- In e-commerce, it’s a bit fuzzier. It might be a customer who hasn't bought anything in the last six or twelve months.
- With a mobile app, a lost customer could be someone who uninstalls the app or hasn't logged in for 90 days.
The time period you select is just as important. Most companies I've worked with track churn monthly because it provides a regular, actionable pulse on customer health. However, looking at it quarterly or even annually can help you see past minor monthly blips and identify more significant, long-term trends.
My Pro Tip: Before you calculate a single thing, get your team in a room (virtual or otherwise) and agree on a concrete definition for a "lost customer" and the standard time period for your reports. Document it.
This simple step is the key to reliable data. It ensures that when you compare churn month-over-month, you're always comparing apples to apples, not apples to oranges. A solid framework is everything.
To make this even clearer, let's break down each part of the formula.
Key Components of the Churn Rate Formula
This quick reference table demystifies each element of the churn calculation, making it easy to see how they all fit together.
| Component | Definition | Example |
|---|---|---|
| Customers Lost During Period | The number of customers who canceled or stopped using your service within the defined time frame. | 150 customers canceled their subscriptions in May. |
| Total Customers at Start of Period | The total number of active customers you had on the very first day of that same time frame. | You had 3,000 total customers on May 1st. |
| Churn Rate (Result) | The final percentage representing the proportion of customers you lost during that period. | (150 / 3,000) x 100 = 5% churn for May. |
With these components clearly defined, you have a repeatable process for calculating churn that anyone on your team can follow.
Putting the Churn Formula to Work: A Real-World Example
Let's move from theory to practice. Seeing the numbers in action makes the concept click and helps you spot the most common mistake people make when calculating churn.
Picture this: you run a subscription box service. On January 1st, you have 5,000 active subscribers. That’s your starting customer count for the month. By January 31st, you see that 250 people have cancelled.
Plugging these numbers into our formula is simple:
(250 Customers Lost ÷ 5,000 Starting Customers) x 100
The result? Your customer churn rate for January is 5%. This is a clean, straightforward metric that tells you exactly how many of your existing customers you lost that month.
The #1 Mistake That Skews Your Churn Rate
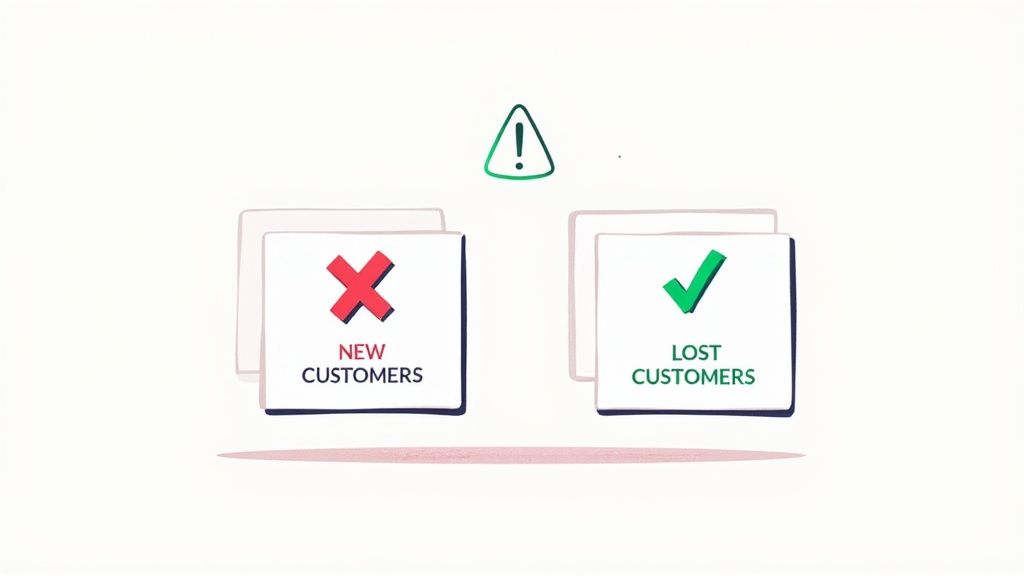
But wait, what about new sign-ups? Let's say your marketing team had a great month and brought in 300 new subscribers. It’s incredibly tempting to factor them into your calculation, but this is where the math goes wrong.
Adding new customers to your starting number will artificially lower your churn rate and hide potential problems with customer retention.
Your churn rate calculation should only focus on the customers you had at the beginning of the period. It's a measure of how well you're retaining your existing customer base, not a reflection of overall growth.
Think about it—those 300 new subscribers just got here. They haven't had a chance to decide whether to stick around or not, so they can't be part of the group that "churned" in January. They'll be part of the starting customer count for February's calculation.
To get a clear picture of your business health, you need to keep your metrics separate.
- Churn Rate: Tells you how well you're holding onto the customers you already have.
- Acquisition Rate: Tracks how effective you are at bringing in new customers.
Keeping these two things distinct is crucial. It gives you an honest look at both sides of the coin: retention and acquisition. You get the clarity needed to make smarter decisions, like figuring out if you need to focus more on customer loyalty or ramp up your marketing efforts.
What a Good Churn Rate Actually Looks Like
https://www.youtube.com/embed/r_9owDBHbAU
So you’ve crunched the numbers and have your churn rate. Now what? Is that percentage a reason to pop the champagne, or a sign that you have a leaky bucket? The honest answer is almost always: it depends.
Context is absolutely everything when it comes to churn. A 5% monthly churn rate might be perfectly acceptable—even great—for a B2C mobile app in a crowded market. But if you're running an enterprise SaaS platform with massive customer acquisition costs, that same 5% is a full-blown emergency.
There’s no universal "good" churn rate. It’s a moving target that shifts based on your industry, business model, and the type of customers you serve. The first step to setting realistic goals is understanding the benchmarks for your specific field.
Benchmarks Across Different Industries
Every industry has a different pulse when it comes to customer loyalty. A streaming service, for example, might see a churn spike right after a hit show's season finale. An e-commerce store might see a dip in returning customers after the holiday rush. It's all part of the natural business cycle.
To give you a clearer picture, here’s a general breakdown of what's often considered "good":
- SaaS: For companies selling to small and medium-sized businesses (SMBs), a monthly churn rate between 3-5% is a common goal. For enterprise-level SaaS, the bar is set much, much lower—ideally well under 1%.
- B2C Subscription: Think subscription boxes, streaming services, or membership sites. Here, churn can be a bit higher, typically landing somewhere between 5-10% each month.
- E-commerce: This one's tricky. If you define a churned customer as someone who hasn't made a purchase in a year, the rate can look alarmingly high. This reflects the more transactional, less sticky nature of online retail.
This simple infographic breaks down the core process: you start with your total user base, identify how many left, and then calculate the final churn percentage.
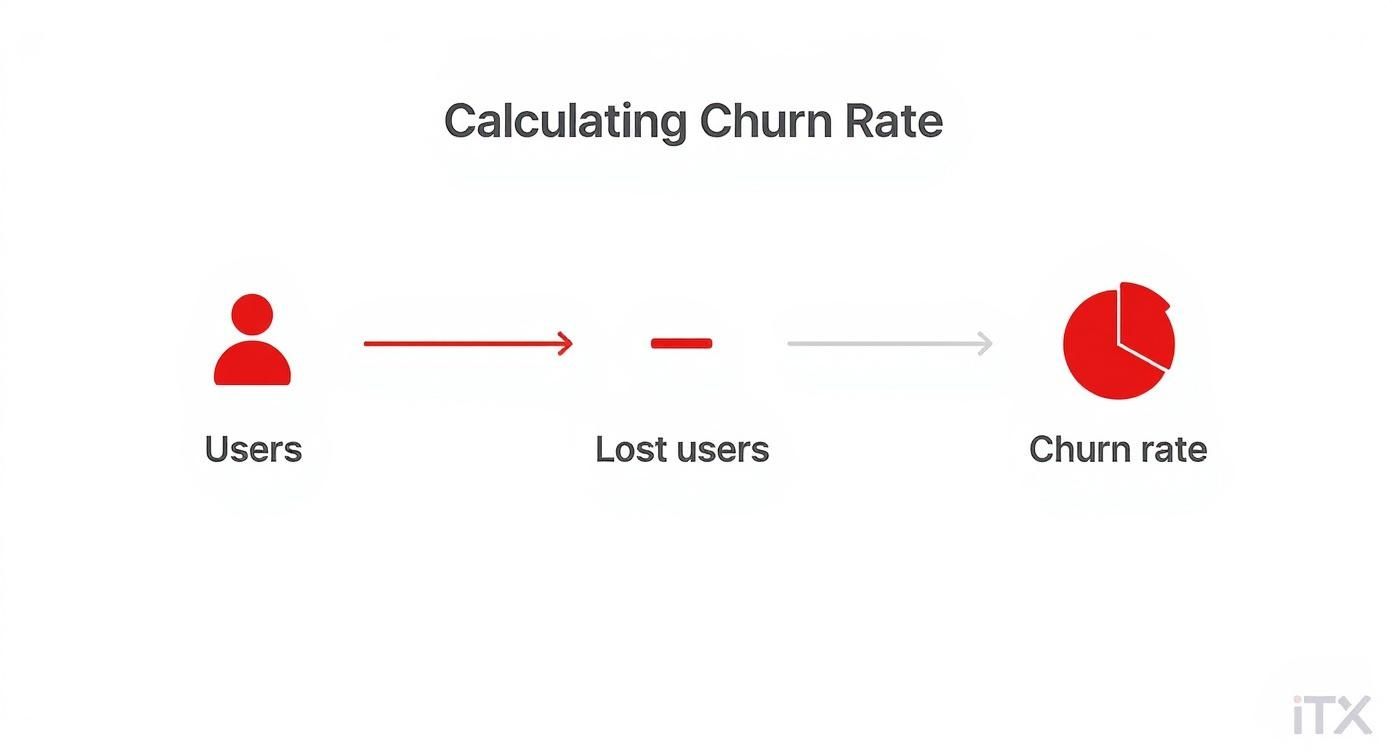
It’s a straightforward flow, but it clearly shows how even seemingly small losses can erode your customer base over time.
If you zoom out, the average monthly churn rate across all industries hovers around 3.27%. You can dive deeper into these numbers by checking out the detailed churn rate benchmarks on Recurly.com to see how your business compares.
Ultimately, knowing your number is just the beginning. The real work is in figuring out why customers are leaving. Understanding where they drop off is the key to improving their experience and keeping them around longer. A great starting point for this is to look at our guide on customer journey mapping examples for some actionable ideas.
Common Mistakes That Skew Your Churn Data
Calculating your churn rate seems straightforward, but a few common mistakes can give you a number that's not just wrong, but dangerously misleading. An inaccurate churn rate can send you chasing phantom problems while real issues go unnoticed, so getting it right from the start is critical.
The most common trap I see people fall into is including new customers acquired during the period in their churn calculation. This will always make your churn rate look better than it actually is. Remember, churn is about retention—how well you're holding on to the customers you already have. Mixing in new sign-ups just muddies the water.
Another classic mistake is not having a clear, company-wide definition of what "churn" even means. Is it a canceled contract? A user who hasn't logged in for 90 days? If your sales and marketing teams have different answers, you don't have a reliable metric; you have a data headache.
Digging Deeper Than the Top-Level Number
Just knowing your overall churn rate is like knowing the final score of a game without watching any of it. It tells you if you won or lost, but it doesn't tell you why. The real insights are hidden in the details.
For example, are customers on your basic plan leaving more often than those on your premium tier? Do users who adopt a certain feature tend to stick around longer? You can only answer these questions by segmenting your data. This kind of detailed investigation is the foundation of effective user analysis and is what separates generic retention efforts from targeted strategies that actually move the needle.
By not segmenting, you're missing the story behind the number. You might have a "healthy" overall churn rate of 4%, but a specific, high-value customer segment could be churning at 15%, signaling a major problem you're completely blind to.
Once you start slicing up the data, you can uncover powerful trends. Consider looking at churn by:
- Customer Cohort: Are customers who signed up in January churning at a different rate than those who joined in June?
- Pricing Tier: Is your entry-level plan a leaky bucket, or are enterprise clients quietly slipping away?
- Demographics: Do you see higher churn in specific regions or industries?
Context is everything. Analyzing SaaS churn rates shows just how much these numbers can vary by industry. A company selling enterprise software might have a monthly churn as low as 0.25%, while an ed-tech platform could see a rate closer to 9.6%. You can see a full breakdown of these 2025 SaaS industry benchmarks on wearefounders.uk.
Steering clear of these common pitfalls will ensure the number you calculate is a true reflection of your business's health.
A Few Common Questions About Churn
Once you've got the basic churn formula down, a few practical questions always seem to pop up. Moving from theory to real-world application means dealing with the nuances of your specific business. Let's tackle some of the most common hurdles people face when they start calculating churn.
Should I Calculate Churn Rate Monthly or Annually?
For most subscription businesses, especially in the SaaS world, monthly churn is the way to go. Think of it as your business's real-time health monitor. It lets you catch troubling trends fast, so you can react before a small issue becomes a massive problem. If you see a sudden jump in your monthly churn, that's your cue to dig in and figure out what’s going on—right now.
An annual calculation serves a different purpose. It's more of a big-picture, strategic tool that helps you see long-term customer loyalty. By smoothing out the month-to-month noise, it’s great for businesses with yearly contracts or for reporting on overall trends to investors.
My advice? Use both. Keep a close eye on your monthly churn for day-to-day operational decisions. Then, use quarterly and annual views to inform your long-term strategy and stakeholder reports.
This hybrid approach gives you the best of both worlds: tactical agility and strategic clarity.
What’s the Difference Between Customer Churn and Revenue Churn?
This is a huge one, and getting it wrong can paint a dangerously misleading picture of your business's health. They might sound similar, but they tell two very different stories.
- Customer Churn is pretty straightforward. It’s the percentage of customers you've lost. This number answers the question, "How many of our clients left us?"
- Revenue Churn tracks the percentage of monthly recurring revenue (MRR) you've lost from those departing customers. It answers the more critical question, "How much money did we lose?"
Imagine your customer churn is a tidy 2%. Looks great on a slide deck, right? But what if those few customers were your biggest enterprise accounts? Suddenly, your revenue churn could be a gut-wrenching 15%. You have to track both to get an honest, complete view of how churn is truly impacting your bottom line.
Can I Calculate Churn Before I Have an Automated Tool?
You absolutely can, and you absolutely should. You don’t need to invest in a sophisticated analytics platform right out of the gate. Honestly, starting out by calculating churn manually in a spreadsheet is one of the best ways to get a real feel for the data.
It’s simpler than you think. Just export a list of your active customers on day one of the month, and do it again on the last day. The difference gives you the numbers you need to plug into the basic formula.
Down the road, a tool like **Swetrix** can automate everything and give you much richer insights. But that initial hands-on experience of crunching the numbers yourself builds a deep understanding that makes any tool you eventually adopt far more powerful.
Ready to hang up your spreadsheet and get automated, actionable insights? Swetrix is a privacy-first analytics platform that turns your user data into a clear path for growth. **Start your free 14-day trial today** and see what you've been missing.