- Date
What Is Funnel Analysis and How Does It Work
 Andrii Romasiun
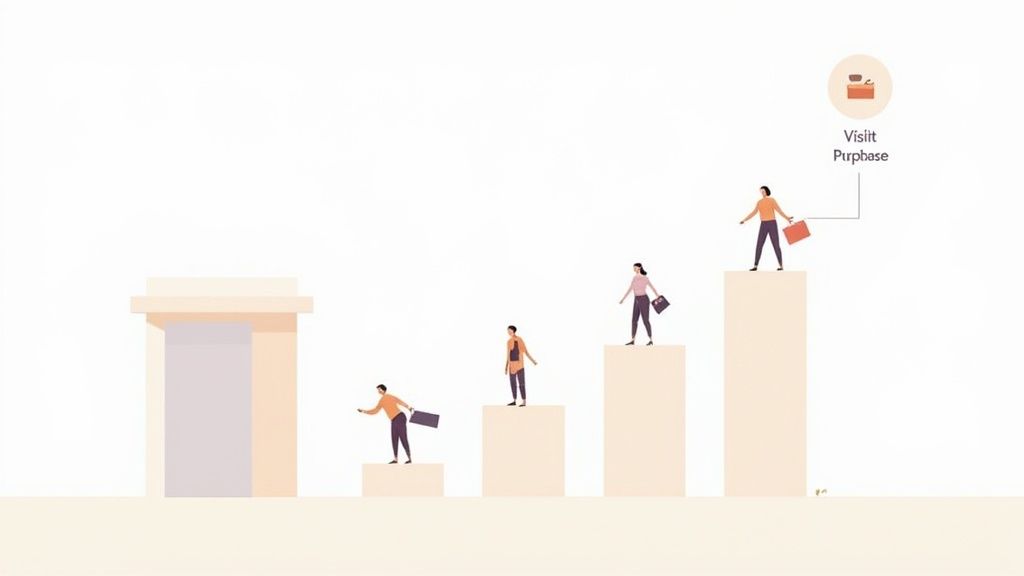
Funnel analysis is all about understanding the path people take on your website or app to reach a specific goal. Think of it like a trail of breadcrumbs that shows you exactly how users move from one step to the next, whether that’s signing up for a newsletter, starting a free trial, or making a purchase.
The real power of funnel analysis is that it shows you where people get stuck or drop off. It helps you pinpoint the exact spots in your user journey that are causing friction, so you can fix them.
Understanding Your Customer Journey
Let's use a simple analogy. Imagine you're baking a cake with a five-step recipe: mix dry ingredients, mix wet ingredients, combine, pour into a pan, and bake. If you stop after just one step, you're not getting a cake. Funnel analysis is the same idea; it tracks the "recipe" your users follow to achieve a goal on your site.
This concept is borrowed from the classic sales funnel, where you start with a wide pool of potential customers at the top. As they move through each stage—from awareness to consideration to purchase—some will inevitably drop off, narrowing the group until only the most committed customers make it to the end. For a deeper dive, check out these insights on funnel charts from Atlassian.com.
Breaking Down the Basics
At its heart, funnel analysis is surprisingly straightforward. You start by defining the ideal path you want users to take, and then you measure how many people actually make it through each step. The goal is to spot the biggest "leaks"—the stages where you're losing the most people.
By understanding where users drop off, you can move from guessing what's wrong to knowing exactly which part of your user experience needs improvement. This data-driven approach is key to boosting conversions.
This process removes the guesswork. Instead of just knowing your sales are down, a funnel can tell you that 70% of users abandon their cart the moment they see the shipping costs. Now that's a specific, actionable insight. Armed with that knowledge, you can test solutions like offering free shipping or displaying costs earlier in the process.
By smoothing out these friction points, you create a clearer, easier path for your users, which ultimately helps turn more visitors into loyal customers.
To make sure we're all on the same page, let's break down the key terms you'll run into when setting up a funnel analysis.
Core Components of Funnel Analysis at a Glance
This table breaks down the fundamental terms you'll encounter in funnel analysis, providing simple explanations to build a strong foundation.
| Term | Simple Explanation | Example |
|---|---|---|
| Funnel | The series of steps you want a user to take to reach a goal. | Homepage → Product Page → Add to Cart → Checkout → Purchase Complete |
| Step | An individual action or page view within your funnel. | Visiting the "Pricing" page is one step. |
| Conversion | When a user successfully completes a step or the entire funnel. | A user clicking "Buy Now" and completing the purchase. |
| Conversion Rate | The percentage of users who complete a step or the entire funnel. | If 100 people visit the checkout page and 30 buy, the conversion rate is 30%. |
| Drop-off | When a user leaves the funnel before completing all the steps. | A user adds an item to their cart but leaves the site without buying. |
Having a solid grasp of these core components is the first step toward building funnels that give you real, meaningful insights into your user behavior.
Why Funnel Analysis Matters for Your Business
It's one thing to know the path your users take, but it's another thing entirely to understand why that path is so critical for your bottom line. This is where funnel analysis really shines. Think of it as a diagnostic tool for the health of your business—it swaps out expensive guesswork for hard data, letting you make smarter decisions that actually move the needle on growth.
Without it, you might see that sales are down, but you're left guessing why. Are people ditching their carts when they see shipping fees? Is your sign-up form just too long and confusing? Funnel analysis answers these questions by putting a spotlight on the exact moments where users lose interest or run into a wall.
From Confusion to Clarity
The real magic of funnel analysis is how it turns vague problems into specific, solvable ones. Instead of just staring at a low conversion rate and feeling overwhelmed, you can pinpoint the exact step where most people are dropping off. That focus is everything; it means you can put your resources where they’ll make the biggest difference.
Imagine a SaaS company discovers that a whopping 60% of trial users bail before finishing the very first onboarding step. Armed with that knowledge, they can zero in on redesigning their tutorial or simplifying the setup process. This directly tackles user activation and has a real shot at improving long-term subscription rates.
Funnel analysis turns your user journey into a story told by data. It reveals the plot twists where your users get lost, empowering you to rewrite the ending for better conversions and customer satisfaction.
Optimizing Your Resources
Funnel analysis is also a lifesaver for managing your budget. It helps you keep a close eye on crucial metrics like Customer Acquisition Cost (CAC)—basically, what you spend on average to get a new customer. Historically, if CAC starts creeping up without a similar rise in customer value, it’s a huge red flag for inefficiency in your marketing and sales process. You can dig deeper into how funnel analysis optimizes customer acquisition at Funnel.io.
By figuring out which channels bring in users who actually convert, you can stop throwing money at campaigns that just attract window shoppers. Your marketing spend gets channeled into strategies that deliver real, measurable results.
Ultimately, this whole process gives you a clear roadmap for what to improve next. It helps you spot high-impact opportunities to make the user experience better, which in turn leads to tangible business outcomes:
- Increased Revenue: When you patch the leaks in your funnel, more users make it to the finish line—whether that’s a purchase or a sign-up. That means more money in the bank.
- Higher Customer Satisfaction: Removing friction points creates a smoother, more pleasant journey for your users, which is key to building loyalty.
- Improved Product Development: Seeing exactly where users get stuck is invaluable feedback that can guide your next feature updates and product improvements.
Exploring Different Types of Funnels
Funnel analysis isn't a single, rigid process. It's more like a flexible blueprint you can adapt to track just about any goal you set for your users. Because different businesses care about different actions, you’ll find all sorts of specialized funnels out there.
By looking at a few common types, you can get a feel for how versatile this tool is and figure out which models make the most sense for your own projects. Each one is built to answer specific questions and uncover the story hidden in your user behavior data.
The whole point is to turn those user actions into insights, which then fuel optimizations that ultimately drive revenue.
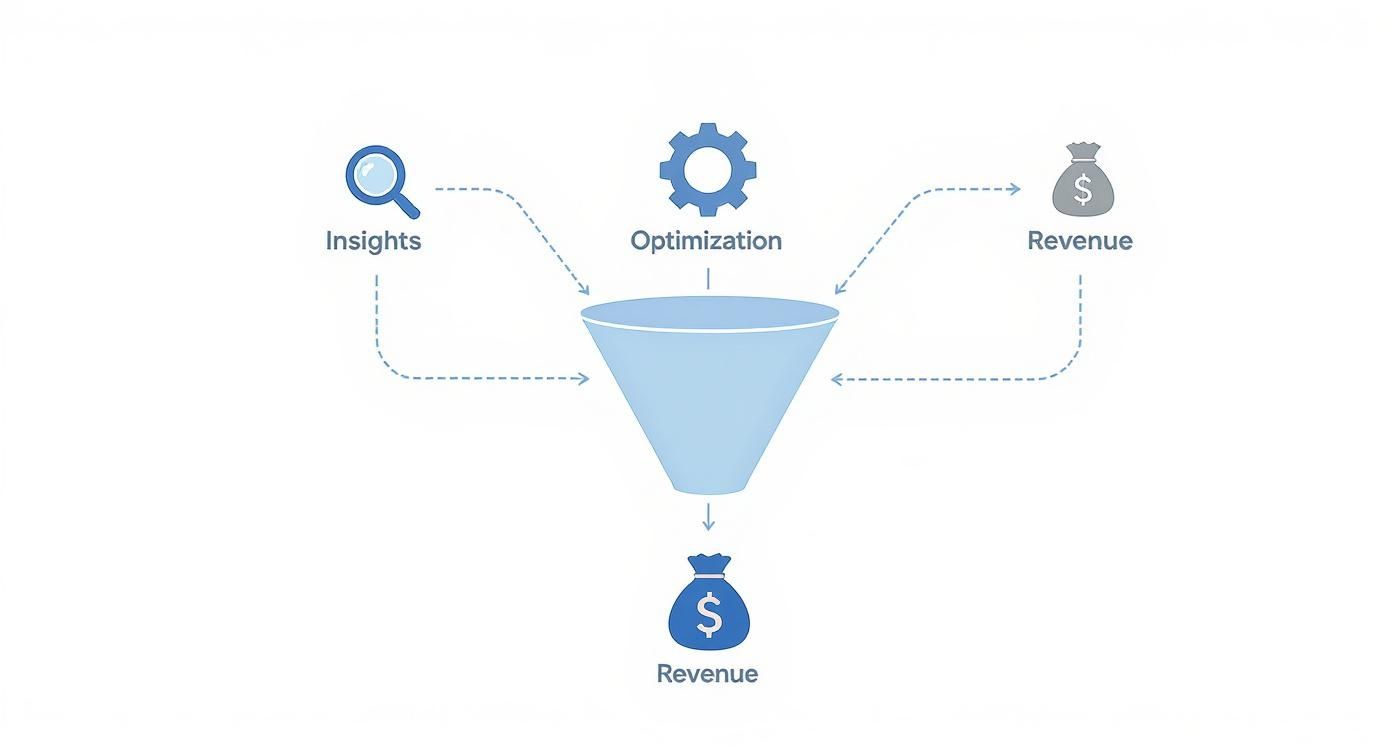
This cycle shows a clear path from understanding what people do on your site to improving your bottom line. Let's dig into a few real-world examples.
E-commerce Purchase Funnel
If you run an online store, the purchase funnel is your bread and butter. It maps out the classic shopping journey, from a customer's first glance at a product to the final click of the "buy" button. More importantly, it shows you exactly where you're losing people along the way.
A typical e-commerce funnel usually includes these steps:
- Product Page View: A user lands on a specific product page, showing interest.
- Add to Cart: They take the next step and put the item in their basket.
- Initiate Checkout: They move from browsing to buying and start the payment process.
- Purchase Confirmation: Success! They complete the transaction and land on the confirmation page.
This funnel gives you direct answers to critical questions like, "What's our cart abandonment rate?" or "Are people bailing during payment?" For instance, if you see a huge drop-off between "Add to Cart" and "Initiate Checkout," it might be a massive red flag that unexpected shipping costs are scaring customers away.
SaaS Onboarding Funnel
For a SaaS company, getting someone to sign up is just the beginning. The real challenge is making sure they stick around and actually use the product. This is where an onboarding funnel is essential—it tracks the steps a new user takes to find that "aha!" moment and see your product's value.
This type of funnel is less about a one-time sale and more about building long-term engagement and retention. It measures the critical actions a new user must complete to become a happy, active customer.
An onboarding funnel for a SaaS product might look like this:
- User Signup: The person registers for a free trial or a freemium account.
- Create First Project: They take the first major step by using a core feature.
- Invite a Teammate: They start using collaborative features, showing deeper commitment.
- Upgrade to Paid Plan: The final conversion goal that proves they’re hooked.
By watching this funnel, a SaaS team can quickly spot if their welcome tutorial is falling flat or if a key feature is just too confusing for newcomers. These insights are pure gold for reducing churn. Nailing this process is a huge part of building a great customer experience, and you can learn more by exploring different customer journey mapping examples.
How to Build Your First Funnel Analysis
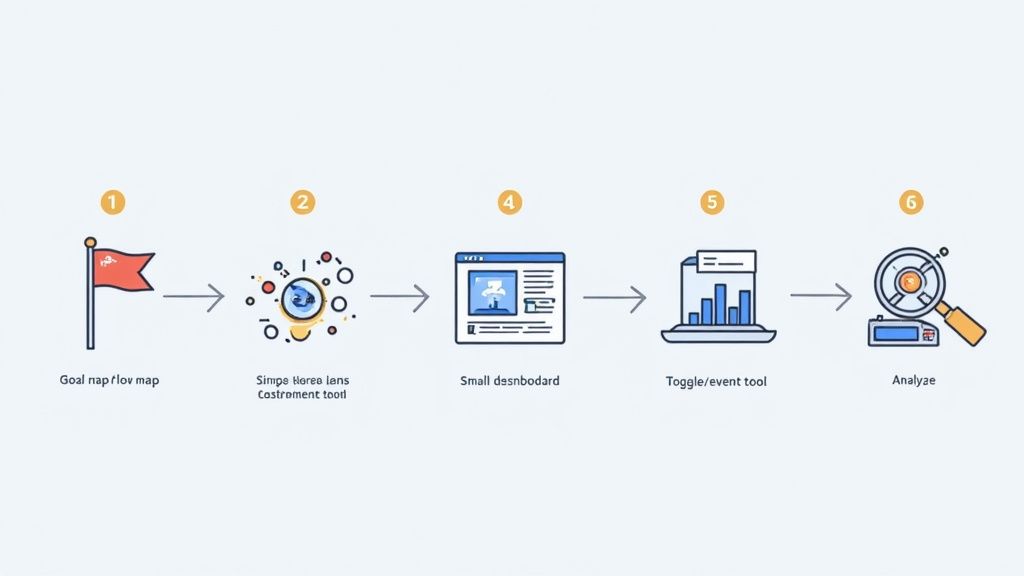
Alright, let's move from theory to action. This is the fun part—where you get your hands dirty and start turning raw user behavior into a clear, visual story. Building your first funnel doesn't have to be some overly complicated technical task. At its heart, it’s just about breaking down a user journey into logical, trackable steps.
This whole process is about taking an abstract goal, like "more signups," and turning it into a concrete map. You'll see exactly where users are following the path you laid out and, more importantly, where they're getting lost.
Step 1: Clearly Define Your Conversion Goal
Before you can track a single click, you need to know what success looks like. What's the one action you ultimately want a user to take? That final, critical action is your conversion goal, and it's the finish line of your funnel.
Your goal has to be specific and measurable. Vague objectives like "increase engagement" won't cut it here. You need to focus on tangible outcomes.
- For an e-commerce site: The goal is a completed purchase.
- For a SaaS product: It might be upgrading to a paid plan.
- For a content blog: It could be signing up for the newsletter.
Having a crystal-clear objective from the start keeps your entire analysis focused and ensures the insights you get are actually useful.
Step 2: Map the Critical User Steps
Once you know the destination, it’s time to draw the map. What are the absolutely essential, non-negotiable steps a user must take to reach that conversion goal? Think of this as the "golden path" you wish everyone would follow.
The trick is to keep it simple. Focus only on the most critical touchpoints. For an online store, a typical path might look like this:
- User lands on a product page.
- User clicks "Add to Cart."
- User proceeds to the checkout page.
- User completes the purchase.
Each of these points becomes a stage in your funnel. This sequence is the backbone of your analysis, letting you measure how many people successfully move from one stage to the next.
Step 3: Choose and Set Up Your Analytics Tool
With your goal and steps defined, you need a tool to do the heavy lifting. Modern analytics platforms like Swetrix are designed to make this process incredibly straightforward, even if you’re new to this. The most important feature to look for is custom event tracking, because that’s how you'll tell the platform which specific actions to watch.
Setting up events is the technical part, but it's not as scary as it sounds. For each step you mapped out in the previous stage, you’ll create a corresponding event in your analytics tool. If you need a hand with this, our complete guide to event tracking walks you through the entire process.
This setup is the bridge between your strategy and your data. By translating each user step into a trackable event, you're giving your analytics platform the exact instructions it needs to visualize your funnel and measure performance.
Step 4: Analyze the Results and Find the Leaks
Once your tool has had some time to collect data, you can finally generate your first funnel report. It will show each step as a bar, visually representing how many users made it to that stage. Now, your job is to play detective and find the biggest "leaks"—the points where the most significant number of users are dropping off.
Don't be shocked if these drop-offs are huge. Research from platforms like Amplitude shows that, on average, only about 2-3% of e-commerce visitors actually complete a purchase. That means most funnels have a staggering 97-98% drop-off rate. Your analysis will break this down, showing you that while 40% of users might go from a landing page to a product view, perhaps only 10% of those actually buy.
When you find a step where you lose 60% of your users, you've just found a clear, high-impact problem to solve. And that, right there, is the true power of funnel analysis.
Turning Funnel Data Into Actionable Insights
https://www.youtube.com/embed/GSEhWVXd5eY
Collecting all this funnel data is great, but it's only half the battle. The real magic happens when you translate those numbers into a concrete plan of action. Think of your funnel report as a treasure map—it shows you exactly where the gold is buried, but you still need to know how to read it and start digging.
The first, and most important, skill is learning to spot the biggest drop-off points. When you look at your funnel, your eyes should immediately be drawn to the steepest cliffs. These are the steps where you're losing the highest percentage of users, and they’re screaming at you that something is broken.
A high drop-off isn't a failure. It's a specific, data-backed clue telling you exactly where to focus your energy. It turns a vague problem like "low conversions" into a precise mission.
For example, let's say you see a massive 70% drop-off between the "Add to Cart" and "Checkout" steps. That’s a huge red flag. This isn't just random chance; it's a clear signal that something in that specific transition is causing serious friction. Now, your job is to play detective and form a hypothesis about what’s going wrong.
Diagnosing the Leaks in Your Funnel
Once you’ve found a major leak, you need to figure out why it's happening. This means putting yourself in your users' shoes and imagining what could possibly make them give up at that exact moment.
Some of the usual suspects behind high drop-off rates include:
- Unexpected Costs: Surprise shipping fees or taxes that pop up at the last minute are notorious conversion killers.
- Technical Glitches: A button might not work on certain browsers, or maybe a page is taking forever to load.
- Confusing UI: A form with a dozen fields or unclear instructions is a surefire way to frustrate someone into leaving.
- Lack of Trust: No security badges? A design that looks unprofessional? People get hesitant when it's time to pull out their credit cards.
Brainstorming these potential reasons gives you a solid list of hypotheses to test. You've now moved from simply knowing where the problem is to having a good idea of what the problem might be.
To help you get started, here's a quick cheat sheet for diagnosing common issues.
Common Drop-Off Points and Potential Causes
This table helps you diagnose issues by matching common funnel drop-off points with likely underlying problems, guiding your optimization efforts.
| Funnel Stage | Potential Cause of Drop-Off | Actionable Next Step |
|---|---|---|
| Landing Page -> Sign-Up | Vague value proposition, confusing call-to-action (CTA), slow page load speed. | A/B test headlines and CTAs. Optimize images to improve load times. |
| Add to Cart -> Checkout | High or unexpected shipping costs, required account creation, lack of guest checkout. | Display shipping costs upfront. Offer a guest checkout option. |
| Checkout -> Payment | Limited payment options, security concerns (no trust badges), overly complex form. | Add more payment methods (PayPal, Apple Pay). Display security seals. |
| Onboarding Step 1 -> Step 2 | Confusing instructions, too many steps, asking for too much information at once. | Simplify the instructions. Break down the process into smaller, more manageable steps. |
By matching the drop-off point to potential causes, you can quickly move from analysis to action.
Segment Your Data to Uncover Hidden Patterns
Here’s a pro-tip: not all your users are the same. Their behavior can be wildly different, which is why user segmentation is such a powerful tool. Instead of looking at your entire audience as one giant blob, you can slice and dice your data to compare funnels for different groups. This is often where the real insights are hiding.
For instance, you could compare funnel performance for:
- Mobile vs. Desktop Users: You might find that mobile users are converting at a much lower rate, which immediately points to a poor mobile experience.
- New vs. Returning Visitors: Maybe new visitors bail during the onboarding process, while your loyal users get stuck at a new feature.
- Users from Different Traffic Sources: Are the people coming from your email campaign converting better than the ones from your social media ads?
Analyzing these segments is often what leads to that "aha!" moment. If you see that your checkout abandonment rate is 80% on mobile but only 20% on desktop, you’ve just pinpointed a huge problem with your mobile payment form.
Validate Your Hypotheses with A/B Testing
Okay, you’ve identified a drop-off, diagnosed some potential causes, and used segmentation to get more specific. Now what? It's time to prove your theory. The best way to do this is with A/B testing.
A/B testing is pretty straightforward: you create two versions of a page. There's the control (Version A, the original) and a variation with your proposed fix (Version B). You then show these different versions to different groups of users and see which one performs better.
For example, if you think hidden shipping costs are the culprit, your Version B might show those costs directly on the product page. By measuring which version leads to a higher conversion rate, you get definitive proof of what actually works. This systematic approach closes the loop, turning your funnel analysis into a repeatable engine for growth.
To dive deeper into this, check out our guide on conversion rate optimization best practices.
Common Questions About Funnel Analysis
As you start wrapping your head around funnel analysis, you’ll probably find a few questions bubbling up. That's completely normal. Let's walk through some of the most common ones that people ask when they're getting started.
Think of this as a quick Q&A to clear up any lingering confusion and help you put all this theory into practice.
What Is a Good Funnel Conversion Rate?
This is the big one, isn't it? Everyone wants to know the magic number. The honest-to-goodness answer, though, is that it completely depends on your industry, where your traffic is coming from, and what you're asking users to do.
For an e-commerce store, a checkout funnel converting at 3% could be fantastic. But if you’re looking at a simple newsletter sign-up, you might reasonably expect something closer to 30%. They're just different beasts.
Instead of hunting for some universal benchmark, your best bet is to look at your own numbers. Figure out your baseline conversion rate right now. That’s your starting line. From there, the goal is simply to get better, week by week. Your only real competition is who you were last month.
The only benchmark that truly matters is your own. A "good" conversion rate is one that's always getting better because you're actively finding and fixing the snags in your user's journey.
How Is Funnel Analysis Different from User Journey Mapping?
This is a great question because the two concepts feel very similar. Both are about understanding how people interact with your product, but they come at it from two different angles.
- Funnel Analysis is quantitative. It’s all about the hard numbers. It tells you exactly how many users made it from Step A to Step B and precisely where the rest bailed. It answers the question, “What are people doing?”
- User Journey Mapping is qualitative. This one is all about the experience. It’s a broader, more empathetic look at the entire process from the customer's point of view, including their frustrations, motivations, and "aha!" moments—even stuff that happens offline. It answers the question, “Why are they doing it?”
Here’s a simple way to think about it: Funnel analysis tells you that 70% of users are abandoning their cart. A user journey map helps you dig into why—maybe they got hit with unexpected shipping costs, or the payment form felt sketchy.
They’re a perfect pair. Use your funnel analysis to pinpoint the leaks, then use user journey mapping to understand the story behind those numbers.
How Many Steps Should a Funnel Have?
There's no single right answer here, but my best advice is to keep it simple. Really. A focused funnel with somewhere between three and six key steps is usually the sweet spot.
If you find yourself building a funnel with ten or more steps, you’re probably getting bogged down in the tiny details. That just creates noise and makes it harder to see the big, meaningful drop-offs you actually need to fix.
Your funnel should only track the absolute must-do, non-negotiable actions a person has to take to get to the finish line. Tossing in a bunch of optional, "nice-to-have" steps will only muddy your data. Stick to the "golden path" first, and only add more steps later if you have a very specific question you're trying to answer.
Ready to stop guessing and start seeing exactly where your users drop off? Swetrix provides powerful, privacy-first funnel analysis tools that turn complex user behavior into clear, actionable insights. Start your 14-day free trial today and build your first funnel in minutes.