- Date
Master Tracking Visitor Metrics On Webflow Sites For Growth
 Andrii Romasiun
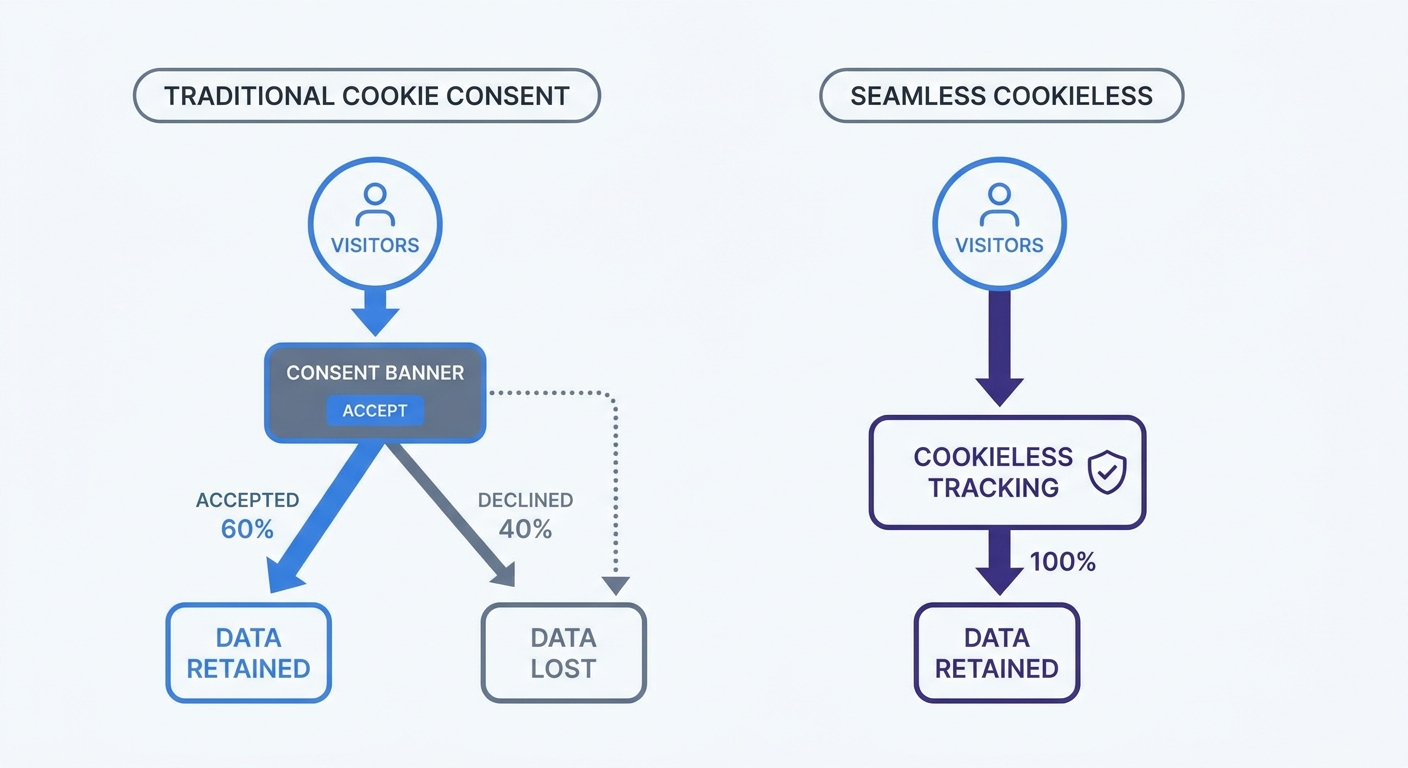
Most Webflow sites leak data before the page finishes loading. When a visitor lands, sees a giant consent banner blocking the hero section, and clicks "Decline" to clear their view, traditional analytics tools drop that session entirely. Because of this, your dashboard shows lower traffic, fewer conversions, and broken user journeys, even though those visitors are actively browsing your site.
You built your site in Webflow to control the visual experience, but a mandatory cookie pop-up ruins that aesthetic immediately. Relying on legacy tracking pixels forces you to trade user experience for incomplete data.
Swapping heavy, cookie-based trackers for privacy-first platforms like Swetrix closes this gap. Instead of forcing users to opt in, cookieless analytics process data anonymously, restoring total visibility to your reporting. Once the script fires, the platform logs each visit so your dashboard reflects reality.
Why Tracking Visitor Metrics on Webflow Sites Matters
The Data Behind User Engagement
People spend less time reading web content than they did three years ago, which means your Webflow site has a narrower window to capture attention and drive an action. While the cross-industry average bounce rate sits at 47%, this figure varies heavily depending on whether you publish e-commerce product pages or long-form blogs. The benchmark report shows visitors abandon pages quickly when friction gets in the way.
For B2B websites, average session duration hovers around two minutes and seventeen seconds—though this range varies based on specific industry niche and content format—requiring accurate data to understand user behavior within that window. If traffic drops off immediately, the page speed or layout requires adjustment, whereas visitors who stay without converting usually indicate a problem with the copy or call-to-action button. Tracking metrics across your Webflow CMS collection pages reveals which specific blog topics or case studies hold attention longest.
Content structure directly impacts these metrics, as long-form content exceeding 1,500 words naturally generates more time on page compared to shorter posts. Adding custom visuals keeps users scrolling further down the page, and tracking these variations helps you allocate your marketing budget to the formats that perform best.
The Shift Toward Privacy-First Analytics
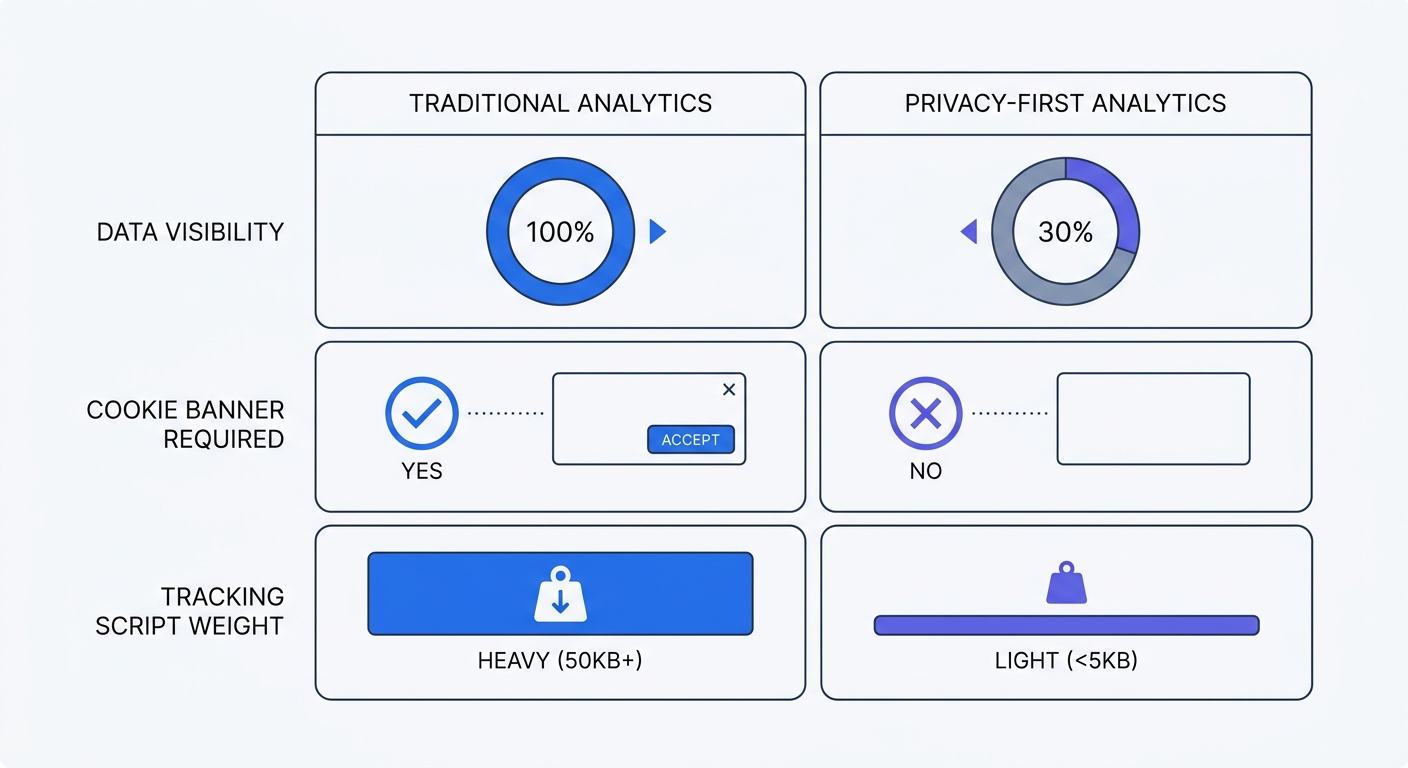
Heavy trackers like Google Analytics 4 require explicit user consent to drop cookies in a browser, which causes a data loss between 30% and 50% when visitors ignore or reject these banners. Making business decisions based on half the picture means that if a successful ad campaign drives traffic that rejects cookies, your acquisition reports will look like a failure.
Shifting toward privacy-first platforms closes this data gap, allowing you to track visitor metrics on Webflow sites without ever asking for consent. Tools like Swetrix hash IP addresses and discard personal identifiers immediately, providing a completely accurate view of your traffic volume, referral sources, and pageviews without violating user trust.
| Feature | Traditional Analytics | Cookieless Analytics (Swetrix) |
|---|---|---|
| Data Visibility | 50-70% (due to opt-outs) | 100% (no consent required) |
| Cookie Banner Required | Yes | No |
| Script Weight | Heavy (50KB+) | Lightweight (<5KB) |
| Impact on Load Speed | High (delays rendering) | Low (asynchronous loading) |
| Data Ownership | Shared with ad networks | Owned by site owner |
Audit your current analytics setup this week by comparing your total backend form submissions or Stripe payments to the conversion numbers in your tracking dashboard. The difference between those two figures represents the exact volume of data lost to cookie opt-outs.
How to Install Cookieless Analytics on Webflow
Adding the Tracking Script
While Webflow makes it easy to inject external code, loading an entire suite of marketing pixels drags down your performance score. Swetrix offers a streamlined alternative that integrates by pasting a single asynchronous script directly into the Custom Code settings of your project.
Follow these steps to deploy the script site-wide:
- Navigate to your Webflow Project Settings.
- Open the Custom Code tab from the top menu.
- Paste the provided lightweight snippet into the Head code section.
- Save the changes and publish your site to your custom domain.
Placing the script in the <head> ensures the tracker fires as soon as the document begins loading, capturing visitors who bounce quickly. Because the script loads asynchronously, it runs in the background without blocking the rest of your page from rendering, allowing the browser to continue building visual elements while the tracker initializes silently.
Preserving Site Speed and Performance
Mobile devices generate the majority of total global blog traffic, making mobile load times a priority for any publisher. Traditional tracking scripts often exceed 50KB, which forces mobile browsers on 3G networks to stall while processing JavaScript and spikes your bounce rate before the user sees your headline.
By using a script smaller than 5KB, Swetrix tracks page views, referrers, and user flow without penalizing your site speed. Fast pages retain users longer, and search engines reward responsive sites with better placement in search results. When a script requires a fraction of a millisecond to execute, your complex Webflow animations and scroll interactions trigger exactly when they should.
To check your current script weight in Chrome DevTools, open your live Webflow site and right-click to Inspect. Navigate to the Network tab, filter by "JS", and sort by size so you can replace any bloated analytics trackers with a lean alternative.
Setting Up Custom Event and Form Tracking
Tagging Buttons with Custom Attributes
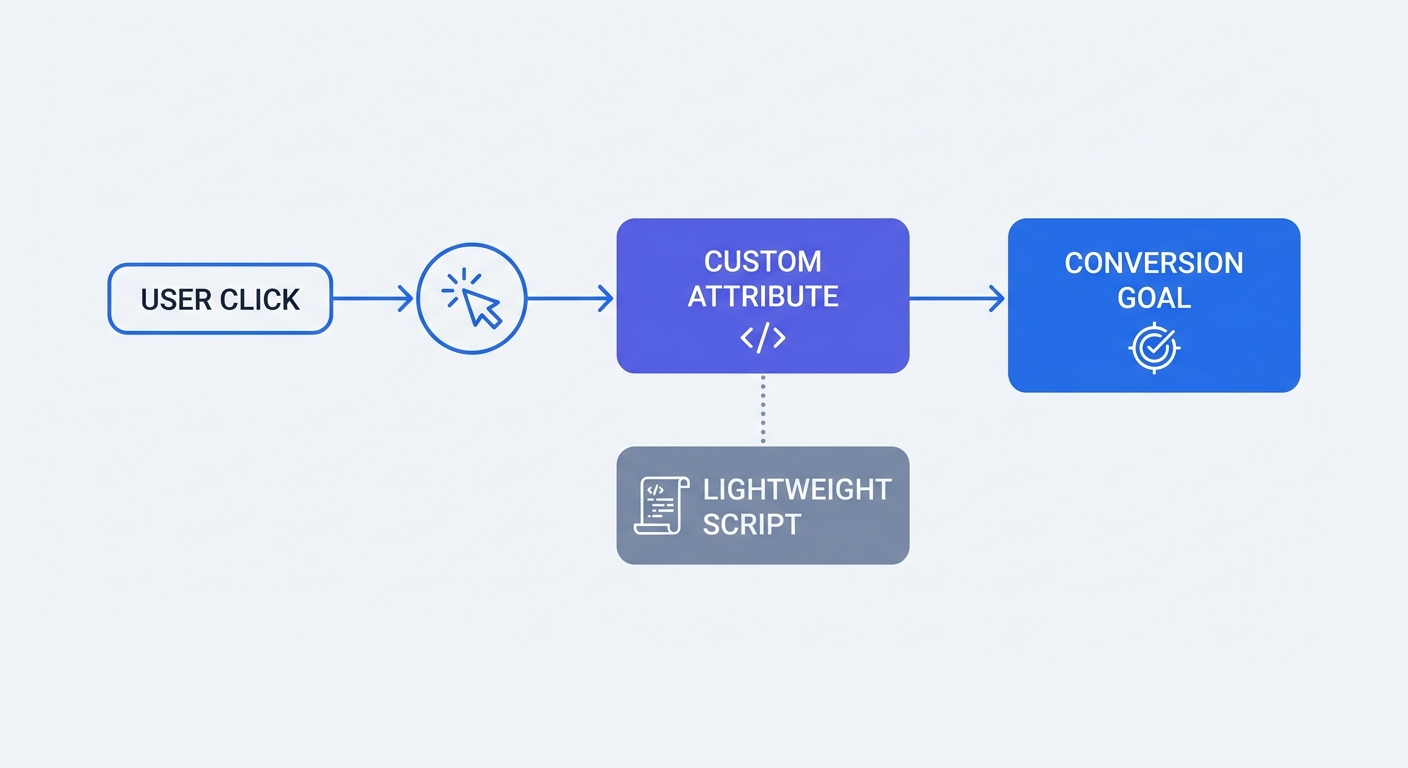
Tracking pageviews tells you a visitor arrived, but custom events tell you what they did next. Instead of relying on complex third-party tag managers to monitor clicks on your Webflow site, you can use the native custom attributes feature built directly into the Designer interface.
Select any element on your canvas, such as a "Buy Now" button or a pricing toggle, and open the Element Settings panel on the right side of the screen. After scrolling down to Custom Attributes, add a name like data-swetrix-event and assign a value like clicked_pricing_button. The Swetrix script listens for these specific tags automatically, logging the event and attributing it to the active session whenever a visitor clicks that button.
Applying this technique to CMS collection lists works similarly; if you have a grid of blog posts, add the attribute to the parent link block so your reports show exactly how many visitors interact with your content feeds.
Tracking Form Submissions Effectively
Lead generation relies on accurate form tracking to measure campaign success. While Webflow forms generate unique IDs by default, targeting those IDs with custom JavaScript breaks your tracking if you duplicate or rename a form later. Instead, apply custom attributes directly to the form block or the submit button.
Map these events to conversion goals inside your dashboard so that when someone submits a contact request, the system ties the conversion back to the original traffic source. This setup shows exactly which UTM-tagged campaigns generate the most qualified leads, eliminating the need to guess whether a Facebook ad or an organic search drove the final inquiry.
Open your Webflow Designer, select your primary call-to-action button, and add a custom attribute for event tracking. Publish the site and click the button on your live domain to verify the event registers in your dashboard.
Analyzing User Flow and Drop-Off Rates
Mapping the Visitor Journey
Understanding how visitors navigate your Webflow site carries equal importance to knowing how they arrived, because traffic volume means nothing if users abandon the journey before reaching your conversion point.
User flow analysis visualizes the path visitors take from their landing page to their exit. If a significant percentage of traffic lands on your home page and immediately navigates to your pricing page, that pathway requires optimization. Conversely, visitors consistently dropping off on a specific CMS template page indicate that the content likely fails to answer their search query.
Mapping these pathways in your analytics dashboard lets you track session flow without identifying individual people. Reviewing aggregate trends shows which navigation links get the most clicks and which pages serve as dead ends. When you identify a page with an unusually high exit rate, audit the content by checking if the call-to-action is clear and whether the page loads fast enough to retain attention.
Building Conversion Funnels
Build a basic funnel report for your primary conversion path by tracking the volume of users moving from your landing page, to your pricing page, and finally to your checkout form. Once you identify the stage with the highest drop-off rate, test a new Webflow layout for that specific step.
- Review your top entrance pages.
- Track the exact sequence of clicks through the funnel.
- Highlight the exact step where users abandon the flow.
- Deploy an A/B test on that specific Webflow page to improve retention.
Going Beyond Basic Traffic Data
Monitoring Real-User Performance (RUM)
Simulated lab data from tools like Google Lighthouse only shows how your site performs under perfect testing conditions, whereas Real-User Monitoring captures how fast your pages load for visitors across different devices and network speeds.
When tracking visitor metrics on Webflow sites, combine traffic data with active performance monitoring. Because Swetrix tracks Core Web Vitals directly from the visitor's browser, you see exact measurements for Time to First Byte (TTFB) and DNS resolution. Webflow hosts sites on Fastly and AWS, guaranteeing fast baseline delivery, but large unoptimized images or heavy custom fonts still ruin load times in practice.
If you notice a sudden spike in bounce rate on a specific landing page, check the performance tab. A heavy Webflow interaction triggering on scroll often causes the page to stutter for mobile users. Addressing these bottlenecks keeps visitors engaged and prevents your ad spend from going to waste on pages that fail to load.
Filtering Out Bot Traffic and Errors
Webflow sites frequently attract automated crawlers and spam referrers that skew engagement metrics. If your dashboard shows thousands of visits with a zero-second average session duration, bots are inflating your numbers, preventing you from calculating an accurate conversion rate.
Modern platforms include built-in bot filtering that blocks known crawlers automatically so your reports only display interactions from human beings. Integrating website error tracking helps catch broken custom code; if a third-party script conflicts with Webflow's native JavaScript, Swetrix logs the exact error and the browser where it occurred, allowing you to fix the issue before it affects the next visitor.
Navigate to your analytics settings and confirm bot exclusion is active, then review your referral sources report weekly to blacklist any suspicious domains sending high volumes of zero-second traffic.
Ensuring GDPR and CCPA Compliance
Ditching the Cookie Banner for Better UX
Legal compliance dictates how you collect data from visitors located in the European Union and California. Because traditional analytics store personal identifiers inside browser cookies, they trigger strict data privacy requirements that force you to interrupt the user experience with consent pop-ups.
Operating entirely without cookies means you collect zero personal data. The system hashes IP addresses instantly with a rotating salt to ensure the original IP cannot be reconstructed, which allows you to legally remove the cookie banner from your Webflow site as long as you avoid running other tracking pixels. Maintaining a cleaner interface keeps visitors focused on your content and accelerates their path to conversion without interruptions.
Data Ownership and EU Hosting
While many free analytics platforms monetize by sharing aggregate user data with advertising networks, privacy-first tools keep your data siloed, secure, and entirely under your control.
Swetrix is an open-source alternative to Google Analytics that stores all cloud data on EU-based servers to meet strict cross-border data transfer regulations out of the box. For teams wanting absolute control, self-hosting options ensure data never leaves your own servers. You own your metrics completely, allowing visitors to browse without the threat of persistent cross-site tracking.
Review your Webflow project's privacy policy today to update the language reflecting your shift to cookieless analytics. State explicitly that you do not track personal identifiers, and delete the consent banner script from your global site settings.
Measuring your Webflow site's growth requires a privacy-first approach. Swetrix provides accurate, cookieless analytics without bloated scripts, offering Cloud plans starting at $19/month for 100,000 events.
Start your 14-day free trial today and uncover the traffic missing from your current reports.