- Date
Lightweight Analytics Scripts for Fast Websites: Complete Guide
 Andrii Romasiun
A website loads in 1.2 seconds. The owner adds Google Analytics to track visitors. Load time jumps to 2.8 seconds. Conversion rate drops from 3.1% to 2.4%. The analytics tool meant to measure performance killed it.
Traditional analytics scripts carry hundreds of kilobytes of JavaScript that browsers must download, parse, and execute before rendering your content. Google Analytics adds 135KB of compressed JavaScript to every new visitor's first page load. Lightweight alternatives weigh 1-2KB. That 67x size difference translates into faster pages, higher conversion rates, and better search rankings.
Why Traditional Analytics Scripts Are Killing Your Website Performance
The Hidden Cost of Google Analytics
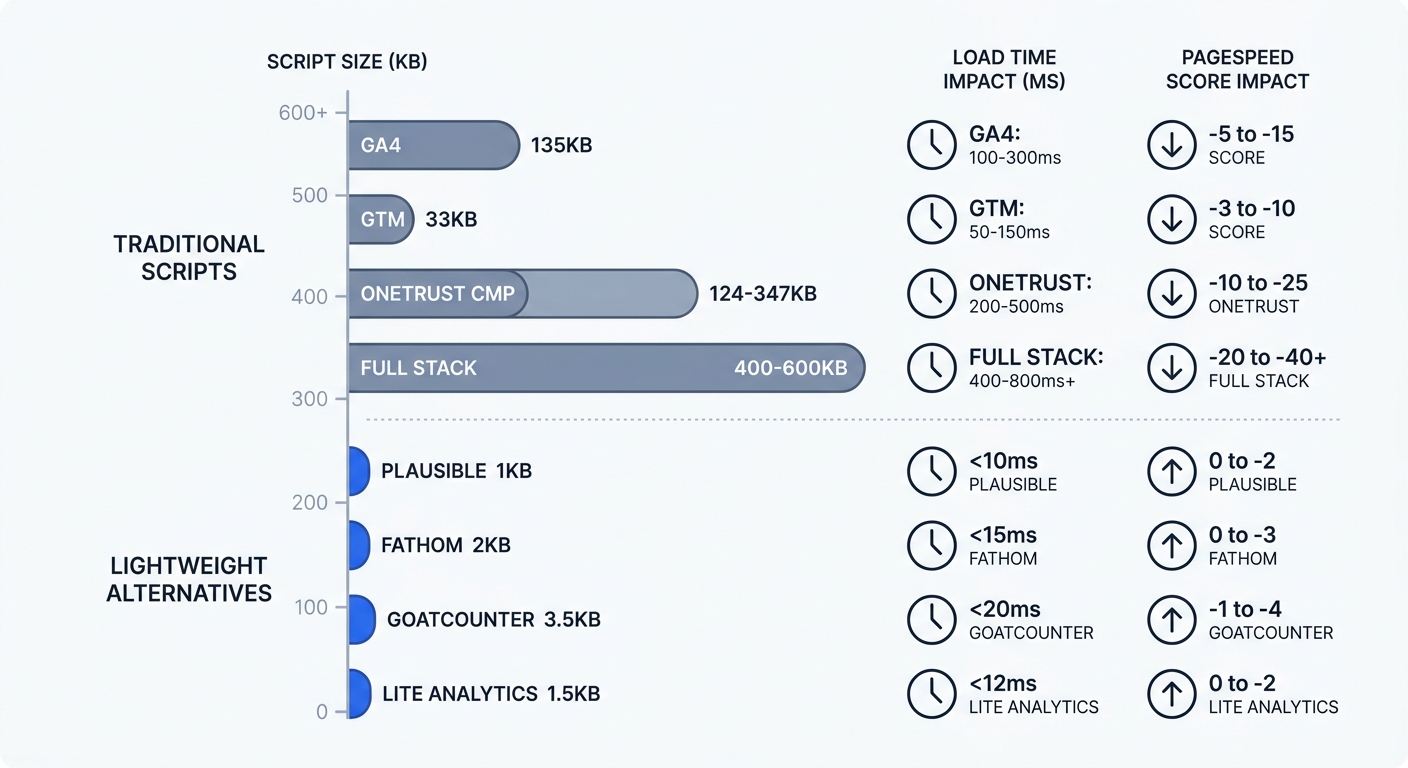
Open your browser's developer tools and load a page running Google Analytics 4. The network tab reveals the full payload: gtag.js weighs 134KB compressed and expands to 371KB uncompressed in browser memory. GA4 doesn't stop at one request. It fires multiple network calls to Google servers, adding latency beyond raw script weight.
Add Google Tag Manager to the stack and you're loading another 33KB for the library plus a median 50KB container. Throw in a consent management platform like OneTrust, which adds 124-347KB depending on configuration, and the total tracking stack reaches 400-600KB of JavaScript.
Most website owners never use the features that justify this weight. GA4 ships with cross-site audience building, remarketing pixels, demographic profiling, and machine learning models. If you only check page views and traffic sources, you're paying the performance cost for capabilities you ignore.
How Analytics Scripts Impact Core Web Vitals
Google ranks pages using Core Web Vitals: Largest Contentful Paint (LCP) under 2.5 seconds, Interaction to Next Paint (INP) under 200 milliseconds, and Cumulative Layout Shift (CLS) under 0.1. Third-party scripts are the most common cause of poor Core Web Vitals scores because they compete for network bandwidth and main-thread processing time.
Every 100KB of gzipped JavaScript decodes to roughly 400KB and adds 100-150ms of main-thread work on average mobile hardware. GA4's 135KB payload blocks the main thread for 150-200ms while the browser parses and executes the code. During that window, the page can't respond to user input.
When 8 tracking tags were added to a GTM container, page speed slowed by 3 seconds on Fast 3G and 10 seconds on Slow 3G. Mobile users in emerging markets or rural areas with slower connections wait longer for every tracking script to load.
Consent banners compound the problem. In one documented case, a consent banner became the LCP element, increasing LCP from 1.43s to 3.61s. The banner's JavaScript loaded before page content, delaying the largest visual element by 2.18 seconds.
Real Conversion Rate Impact of Slow Loading
Page speed affects revenue. A 0.1-second improvement in mobile load time increases retail conversion by 8.4%. Travel sites see a 10.1% conversion lift from the same improvement. Luxury brands converting users from product pages to cart see a 3.6% increase in conversions and a 40.1% increase in add-to-basket actions.
The relationship between load time and conversion rate follows a steep curve. Pages loading in 1 second convert at 40%. At 2 seconds, conversion rate drops to 34%. At 3 seconds, it levels off at 29%. For ecommerce, sites loading in 1 second achieve 3.05% conversion rates versus 1.08% at 5 seconds.
Calculate the impact on your business: if your site generates $500,000 monthly revenue at a 2.5% conversion rate with 3-second load times, reducing load time to 1.5 seconds could lift conversions to 3.0% and revenue to $600,000. The analytics script slowing your site costs $100,000 per month.
Open GTmetrix and run a speed test on your homepage. Check the Waterfall chart under the "Waterfall" tab. Locate each analytics script by name (gtag.js, analytics.js, gtm.js, consent banner scripts). Note the compressed size and load time for each. Add up the total weight of all tracking scripts. If the total exceeds 50KB, you have optimization opportunities.
Comparing Lightweight Analytics Alternatives: Script Sizes and Features
Top Privacy-First Analytics Platforms
Lightweight analytics platforms strip out invasive tracking and ship minimal JavaScript. Plausible Analytics delivers its tracking script in under 1KB. Fathom Analytics weighs roughly 2KB gzipped. GoatCounter's script measures 3.5KB. Lite Analytics compresses to 1.5KB over the network. Even the heavier options like Infobits at 6KB remain 22x smaller than GA4.
Swetrix follows the same privacy-first approach: no cookies, no personal data collection, and a script size measured in single-digit kilobytes. The platform tracks page views, referrers, traffic sources, and conversions without fingerprinting or cross-site tracking.
Each platform makes different tradeoffs. Plausible and Fathom offer hosted solutions with automatic updates and managed infrastructure. GoatCounter provides a free tier for personal projects. Umami and Swetrix support self-hosting for teams that want full data control. All share the same core principle: collect only what you need, ship minimal code, respect user privacy.
Script Size Benchmarks That Matter
Raw script size tells part of the story. Network transfer time depends on compression, server location, and connection speed. A 1KB script on a CDN loads in 10-20ms on a fast connection. GA4's 135KB payload takes 500-800ms on the same connection and over a second on 3G.
Parsing and execution time matter more than download time on modern networks. Browsers must decode the compressed script, parse the JavaScript syntax, compile it to bytecode, and execute the initialization code. GA4 adds at least 100 milliseconds to first page view, often reaching 500ms on slower devices.
Compare this to lightweight alternatives: a 1.5KB script downloads in 15ms, parses in 5ms, and executes in under 10ms. Total overhead stays under 30ms, imperceptible to users and invisible in Core Web Vitals metrics.
The performance gap widens on repeat visits. GA4 caches some resources but fires multiple network requests to update configuration and send events. Lightweight platforms make a single request per page view, often to a first-party domain that avoids DNS lookup overhead.
Core Features vs Analytics Bloat
GA4 ships with features most websites never use: cross-device user tracking, predictive metrics powered by machine learning, integration with Google Ads for remarketing, demographic and interest reports, and funnel visualization with segment comparison. These capabilities require extensive data collection, complex client-side logic, and continuous server communication.
Lightweight platforms focus on core metrics: page views, unique visitors, referrer sources, geographic distribution, device and browser breakdown, and custom event tracking. Most add goal tracking for conversions and basic funnel analysis. None include remarketing pixels, audience building, or demographic profiling.
Ask what you check in your analytics dashboard. If you review traffic sources, top pages, and conversion rates weekly but never touch audience reports or predictive metrics, you're paying a performance penalty for unused features.
The feature gap matters for some use cases. Ecommerce sites running dynamic remarketing campaigns need GA4's integration with Google Ads. Publishers monetizing through programmatic ads benefit from audience data. SaaS companies tracking complex user journeys across multiple sessions may need GA4's user-ID tracking.
For content sites, small businesses, and early-stage products, lightweight analytics provide everything needed to make decisions: which pages attract traffic, where visitors come from, and which campaigns drive conversions.
List every GA4 feature you've used in the past 90 days. Open your GA4 property, check the reports you've viewed, and note which data points informed decisions. Compare this list against the feature set of Plausible, Fathom, or Swetrix. If the lightweight platform covers 90% of your usage, the performance tradeoff favors switching.
GDPR Compliance Without Consent Banners
Why Lightweight Analytics Don't Need Cookie Consent
GDPR requires consent for processing personal data. If your analytics tool collects no personal data, consent requirements may not apply depending on implementation and jurisdiction. Plausible is often designed to avoid personal data collection through no cookies or personal data storage, but consent requirements depend on configuration and local law. The same conditional approach applies to Fathom, Swetrix, and similar platforms that aggregate traffic data without identifying individuals.
These tools achieve compliance through technical design: no cookies, no persistent identifiers, no cross-site tracking, IP address anonymization, and no data sharing with advertising networks. The data they collect (page URL, referrer, browser type, device category) typically cannot identify a specific person.
GA4 can be configured for GDPR compliance, but it requires active effort: implementing a consent banner, enabling IP anonymization, signing a data processing agreement with Google, and documenting your legal basis for processing. Several EU data protection authorities have ruled against GA4 implementations that transfer data to US servers without adequate safeguards. Consult legal counsel to ensure your analytics implementation complies with applicable privacy regulations in your jurisdiction.
The Real Cost of Consent Management Platforms
Consent management platforms add their own performance overhead. OneTrust loads 124-347KB of JavaScript depending on configuration. Cookiebot, Usercentrics, and similar tools add 50-200KB. The banner itself often becomes the largest element on initial page load, degrading LCP scores.
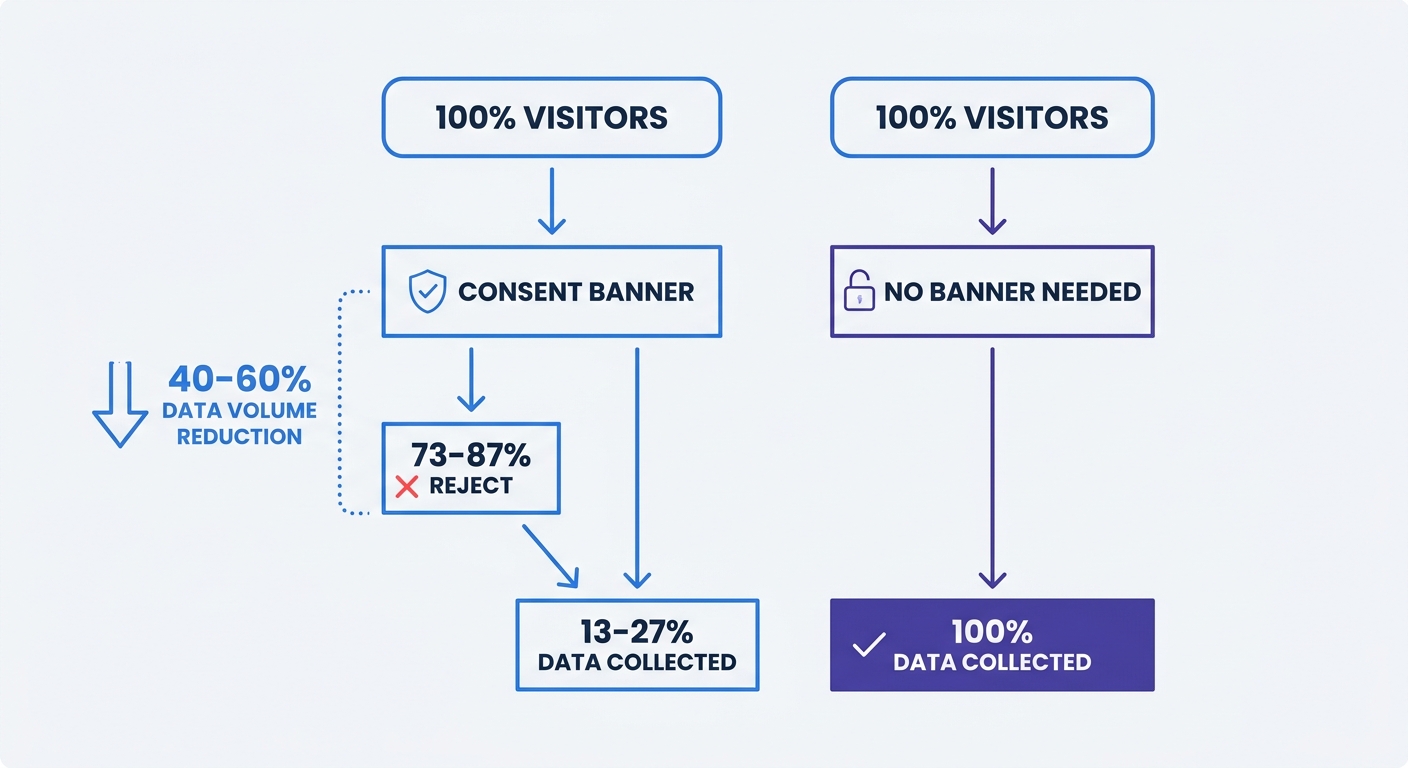
Beyond script weight, consent banners introduce user friction. 87% of German users and 73% of French users reject cookie consent banners. Each rejection means lost data. In consent-fatigued markets, using the strictest GDPR standard reduces data volume by 40-60%.
Calculate the cost: if your site receives 100,000 monthly visitors and 70% reject cookies, you lose data on 70,000 visits. Your analytics dashboard shows 30,000 visits and you make decisions based on incomplete information. Campaigns targeting the 70% who rejected cookies appear to fail when they may be working.
Cookieless analytics eliminate this data loss. Every visitor contributes to your metrics because no consent is required. You see 100% of traffic, not a biased sample of users who accept tracking.
Data Loss from Cookie Rejection
Cookie rejection rates vary by geography and industry. Privacy-conscious markets like Germany and France show the highest rejection rates. Younger users reject cookies more frequently than older demographics. Mobile users, facing smaller screens and faster browsing patterns, dismiss banners without reading them.
The users who reject cookies aren't random. They're often your most privacy-aware, tech-savvy audience. Losing their data skews your metrics toward less privacy-conscious users, potentially missing insights about your most engaged segments.
Cumulative GDPR fines reached €5.88 billion by January 2025, with individual penalties reaching €20 million or 4% of global annual revenue for serious violations.
The regulatory risk of misconfigured GA4 exceeds the cost of switching to a compliant alternative. A single GDPR violation can cost more than a decade of analytics subscriptions.
Check your current cookie rejection rate. If you run a consent banner, your CMP dashboard shows acceptance and rejection percentages. Calculate how many visitors you lose data on each month. Multiply monthly visitors by rejection rate. If you're losing data on more than 10,000 visits per month, cookieless analytics recover that visibility without regulatory risk.
Implementing Lightweight Analytics: Step-by-Step Migration
Pre-Migration Performance Baseline
Measure current performance before changing anything. Open GTmetrix and run a test on your homepage and top three landing pages. Record these metrics for each page: PageSpeed score, total load time in seconds, total page size in megabytes, LCP in seconds, INP in milliseconds, and CLS score.
Download the Waterfall chart as a reference. Locate your current analytics scripts and note their position in the loading sequence. If GA4 loads early and blocks other resources, you'll see the impact.
Run the same test from multiple geographic locations. GTmetrix offers server locations in North America, Europe, Asia, and Australia. A site that loads fast from New York might crawl from Mumbai if your analytics scripts route through distant servers.
Check mobile performance separately. GTmetrix's mobile test simulates a mid-range Android device on a 4G connection. Mobile scores run 10-20 points lower than desktop due to slower processors and network conditions.
Script Loading Best Practices
Remove your existing GA4 and GTM scripts from the site header. If you use a CMS like WordPress, disable the analytics plugin. If scripts are hardcoded in your theme, delete the relevant code blocks.
Add your new lightweight analytics script in the HTML <head> section with the defer attribute: <script defer src="https://your-analytics-domain.com/script.js"></script>. The defer attribute tells the browser to download the script in parallel with page parsing but execute it only after the DOM is ready.
Avoid async for analytics scripts. Async executes scripts as soon as they download, potentially before the DOM is ready. Defer guarantees execution order and prevents race conditions where the script tries to track a page element that hasn't loaded yet.
For Swetrix, follow the installation guide at swetrix.com to get your unique tracking code. The platform provides a single-line script tag that includes your project ID. Copy it into your site's <head> section, save, and deploy.
Test the implementation by visiting your site and checking the network tab in browser developer tools. You should see a single request to your analytics domain with a 200 status code. Visit a few different pages to confirm tracking fires on each page load.
Testing and Validation
Wait 24 hours for data to accumulate, then check your new analytics dashboard. Verify that page views, referrers, and traffic sources appear correct. Compare the data to your final day of GA4 data to confirm tracking accuracy.
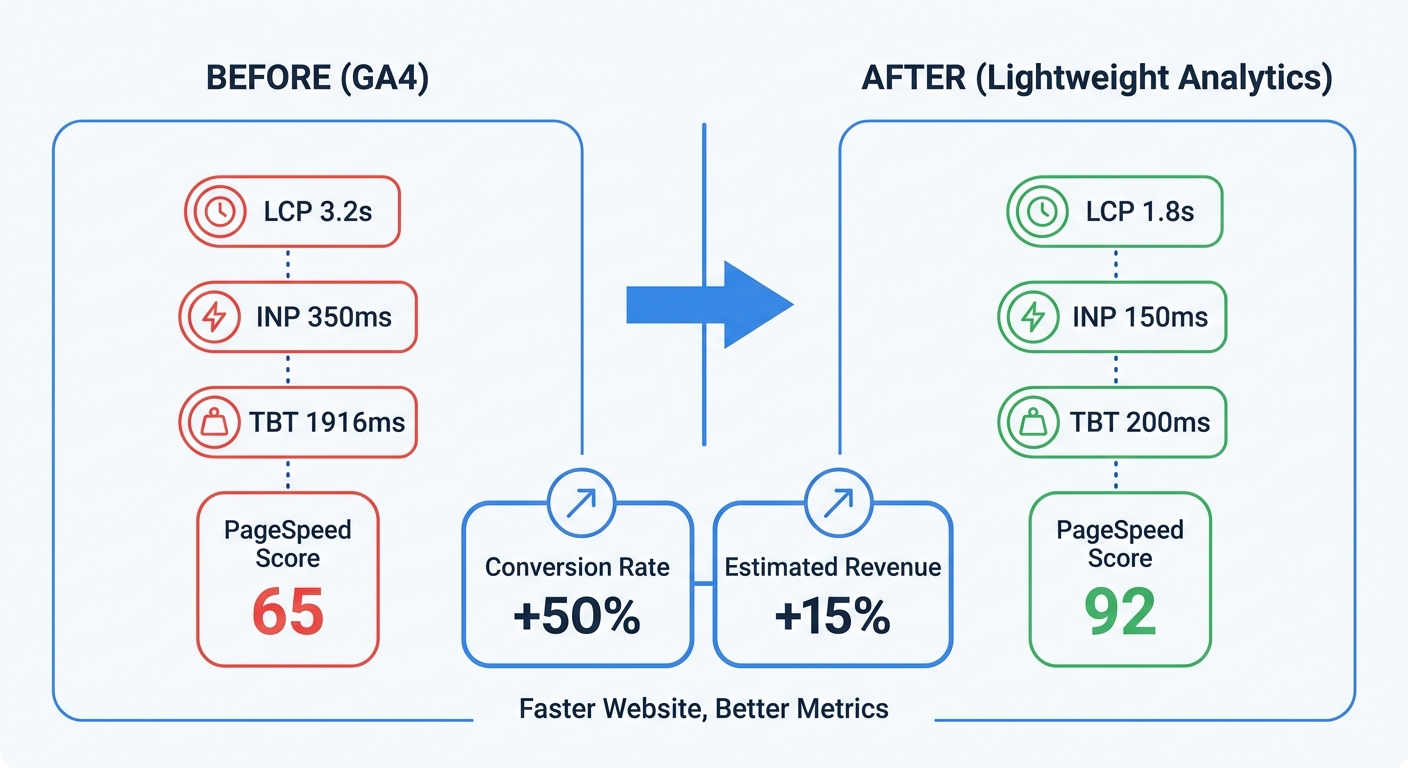
Run a new GTmetrix test on the same pages you tested before migration. Compare the results: PageSpeed score should increase by 10-15 points, total page size should drop by 100-200KB, LCP should improve by 200-500ms, and Total Blocking Time should decrease by 100-200ms on mobile.
If scores don't improve, check for leftover tracking scripts. Search your site's HTML source for "google-analytics.com", "googletagmanager.com", and "gtag". Remove any remaining references.
Monitor Core Web Vitals in Google Search Console over the next 28 days. Search Console updates CWV data based on real user measurements, so improvements take time to appear. After a month, you should see LCP and INP scores shift toward the "Good" threshold.
Follow the five-step migration checklist: (1) Record baseline performance metrics in GTmetrix, (2) Choose a lightweight platform based on feature requirements and script size, (3) Install the new tracking script with defer attribute, (4) Remove all old GA4/GTM scripts and consent banners if no longer needed, (5) Validate with GTmetrix Waterfall chart and confirm 100-200KB reduction in total page weight.
Advanced Optimization: Server-Side Tracking and Hybrid Approaches
Server-Side Tracking Considerations
Server-side tracking moves data collection from the browser to your web server. A user loads a page, your server logs the request and sends analytics data to your platform from the backend. The user's browser never loads an analytics script.
This approach eliminates client-side JavaScript, removing all performance overhead. It also bypasses ad blockers, which block client-side scripts but can't prevent server-to-server communication. Many B2B companies adopt server-side tracking, achieving notable data quality improvements.
Server-side tracking can improve data accuracy significantly compared to client-side tracking. Ad blockers, browser privacy features, and network issues cause client-side scripts to fail. Server-side logging captures every request that reaches your infrastructure.
The tradeoff is implementation complexity. You need server access, backend development skills, and infrastructure to process and forward analytics events. For teams running custom web applications, the effort pays off. For teams using hosted CMS platforms, client-side lightweight scripts offer better ROI.
Hybrid Analytics Architectures
Combine lightweight client-side tracking for real-time metrics with server-side logging for detailed analysis. The client-side script provides immediate feedback in your dashboard: current visitors, active pages, and conversion events. Server-side logs feed into data warehouses for deeper analysis without browser overhead.
This architecture works well for high-traffic sites where analytics data feeds into business intelligence tools. The lightweight client-side script keeps pages fast while server logs provide the raw data for custom reports, cohort analysis, and attribution modeling.
Set up the hybrid approach by installing a lightweight analytics script for real-time tracking, configuring server logs to capture page requests with referrer and user agent data, and forwarding server logs to a data warehouse or analytics API for batch processing. Query the data warehouse for complex analysis that doesn't need real-time updates.
Ongoing Performance Monitoring
Performance degrades over time as teams add features, third-party integrations, and marketing tools. Set up quarterly performance audits to catch script bloat before it impacts users.
Create a performance budget: maximum total page size of 1.5MB, maximum JavaScript weight of 300KB, maximum number of third-party requests of 10, LCP under 2.5 seconds, and INP under 200 milliseconds. Reject any change that violates these thresholds without explicit approval.
Audit third-party scripts every quarter. Chat widgets, social embeds, marketing tools, and analytics all add weight. Each script you remove or replace with a lighter alternative improves load time for every visitor on every page. In 90% of audits, unused tracking scripts are found: scripts nobody remembers adding, scripts that track data nobody reads.
Monitor Core Web Vitals after adding any tracking script. Keep an eye on site performance, especially LCP, INP, and CLS. If metrics degrade after a deploy, roll back the change and investigate alternatives.
Set up quarterly performance audits with specific thresholds: total JavaScript under 300KB, fewer than 10 third-party requests, LCP under 2.5s. Use GTmetrix to measure these metrics every three months. Document any violations and create a remediation plan before the next quarter.
Measuring ROI: Performance Gains and Business Impact
Quantifying Speed Improvements
Calculate the exact script weight reduction from your migration. If you replaced GA4's 135KB with a 1.5KB alternative, you eliminated 133.5KB, a 90x reduction. Multiply this by monthly page views to see total bandwidth savings.
A site serving 100,000 page views per month saves 13.35GB of bandwidth monthly. At $0.10 per GB for CDN bandwidth, that's $1.34 in direct hosting costs. The real savings come from faster load times and higher conversion rates.
Measure load time improvement by comparing pre-migration and post-migration GTmetrix results. If LCP dropped from 3.2 seconds to 1.8 seconds, you saved 1.4 seconds per page load. Multiply by monthly page views to calculate total time saved: 100,000 page views × 1.4 seconds = 140,000 seconds (38.9 hours) of cumulative load time eliminated monthly.
Conversion Rate Lift Calculations
Use the 8.4% conversion increase per 0.1-second improvement to project revenue impact. If your site converts at 2.5% with a 3-second load time and you reduce load time to 1.5 seconds, you've saved 1.5 seconds or 15 increments of 0.1 seconds.
Calculate the compound conversion lift: 2.5% × (1.084^15) = 8.4% conversion rate. At 100,000 monthly visitors and $100 average order value, the original conversion rate generates $250,000 monthly revenue. The improved conversion rate generates $839,000, a $589,000 monthly increase.
This calculation assumes the full 8.4% lift per 0.1s applies across the entire range, which overstates the impact. Real-world results show diminishing returns: the first second of improvement matters more than the second. A more conservative estimate applies the 8.4% lift to the first 0.5 seconds and 4% to the remaining second, yielding a 5.1% final conversion rate and $510,000 monthly revenue, a $260,000 increase.
Industry-specific data provides more accurate projections. Retail sees 8.4% conversion lift per 0.1s. Travel sees 10.1%. Luxury brands see 3.6% conversion lift but 40.1% increase in add-to-basket actions. Use the metric that matches your business model.
SEO and Ranking Benefits
Google uses Core Web Vitals as ranking signals. Improving LCP, INP, and CLS can lift your position in search results, driving more organic traffic. The impact varies by query competitiveness and existing ranking position.
A study of 5,000 websites found that pages in the "Good" range for all three Core Web Vitals ranked an average of 2.3 positions higher than pages in the "Needs Improvement" range. For a keyword with 10,000 monthly searches, moving from position 5 to position 3 increases click-through rate from 5.1% to 11.4%, adding 630 monthly clicks.
Calculate the SEO value by identifying your top 10 keywords by traffic volume, checking your current ranking position for each, and estimating the CTR increase from a 2-position improvement using industry CTR curves. Multiply the additional clicks by your conversion rate and average order value to project revenue impact.
Companies using first-party data strategies achieve 2.9x better customer retention rates and 1.5x higher marketing ROI compared to those dependent on third-party cookies. Switching to cookieless analytics positions you for the post-cookie future while improving performance today.
Build a business case calculator using your current traffic, conversion rate, and average order value. Input your current load time and target load time. Calculate projected conversion lift using the 8.4% per 0.1s improvement for retail or 10.1% for travel. Multiply the conversion rate increase by monthly revenue to show the dollar impact of faster analytics scripts. Present this calculation to stakeholders when proposing the migration.
Lightweight analytics scripts deliver measurable performance improvements: 90x smaller file sizes, 10-15 point PageSpeed increases, 100-200ms reduction in Total Blocking Time, and 8.4% conversion lift per 0.1s load time improvement. The migration takes hours. The benefits compound with every page view.
Swetrix provides privacy-first, cookieless analytics without the performance penalty of traditional tools. Start a 14-day free trial to see your data without slowing your site.