- Date
How To Monitor Website Uptime Free For Better Performance
 Andrii Romasiun
Your server drops offline five minutes after launching a new ad campaign. Visitors hit a 502 Bad Gateway page, which drains your marketing budget while search engines crawl the broken domain and flag it as unreliable, damaging months of SEO work. Setting up free uptime monitoring prevents this cascade of failures. Because you catch outages before customers notice them, you can pause ad spend instantly and keep your analytics data pristine.
Why Website Uptime Matters (And What It Costs)
The Hidden Financial Cost of Downtime
A single hour of downtime costs small stores and content blogs around $1,000 in direct revenue loss, but you must multiply that figure by the time it takes to notice the crash. For enterprise operations, the financial bleed depends heavily on the industry and transaction volume—with finance and healthcare often exceeding $5 million per hour—though forty-one percent of large enterprises report losing over $1 million per hour during an outage. Altogether, unplanned downtime costs Global 2000 companies a combined $600 billion per year.
New server architectures make perfect uptime harder to maintain because pushing processing to the edge creates new single points of failure. Although the overall frequency of data center outages is dropping, the severity of individual crashes is rising. Since you cannot assume your host will maintain complete availability, you need an independent system watching the server.
Impact on SEO, Marketing, and Analytics
When your site goes down, analytics platforms record a data blackout. If paid marketing campaigns keep running, you pay networks to send users to error pages, which spikes your bounce rate and destroys campaign conversion metrics. Search engines notice the failure as well: Googlebot encounters a 500-level server error, halts the crawl, and eventually deprioritizes the domain if the unreliability persists.
Audit your tracking scripts to prevent self-inflicted outages. Heavy, cookie-based third-party trackers often load synchronously, meaning your site hangs trying to load their code if their external server struggles. To fix this perceived downtime, swap bloated trackers for a lightweight, cookie-free analytics tool like Swetrix. Because the script is tiny, it never becomes the bottleneck that takes your pages offline.
Understanding Metrics: Uptime vs. Real Availability
Deciphering the 'Nines' of Uptime
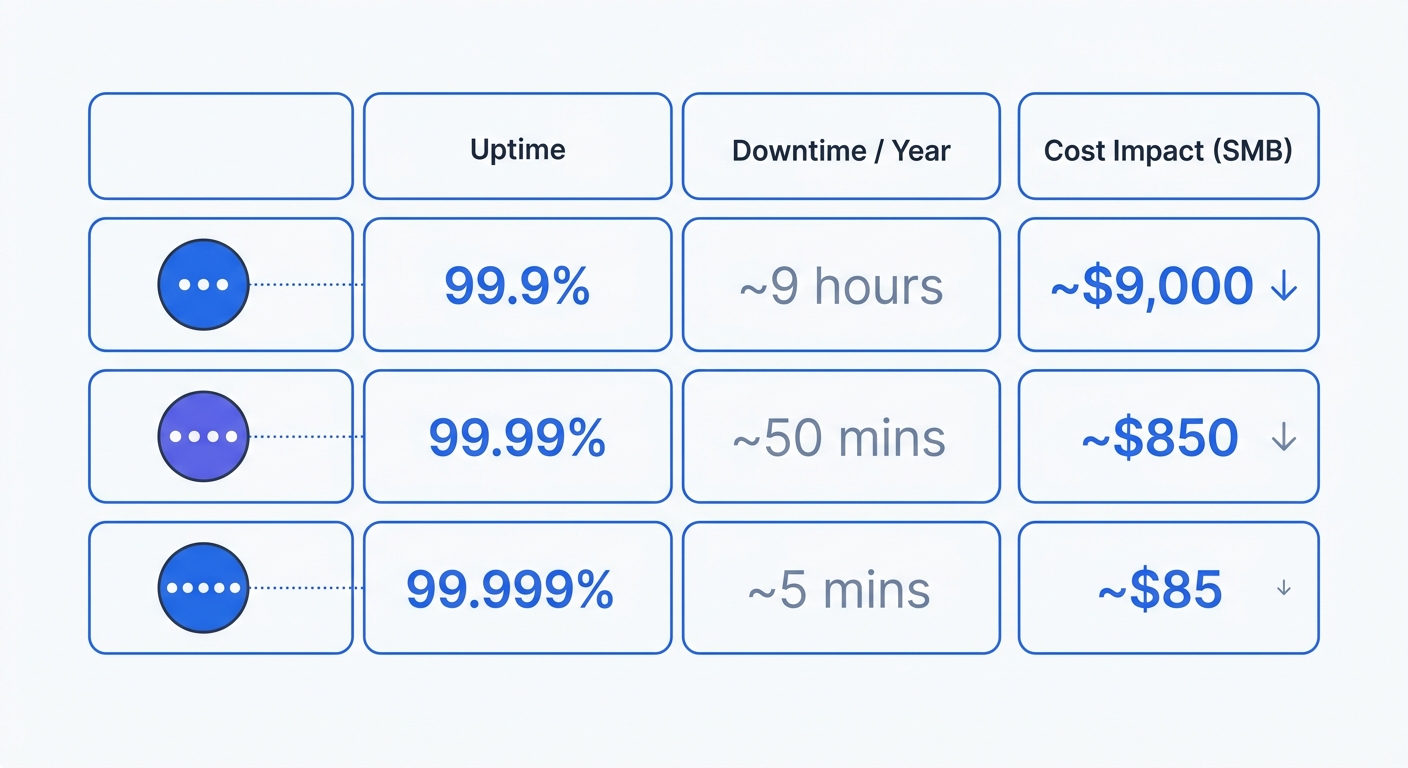
Hosting providers sell reliability using the concept of nines. Achieving 99.999% availability leaves room for only 5.26 minutes of downtime per year, requiring massive redundant infrastructure. For typical blogs or small ecommerce sites, targeting 99.9% availability is much more practical. This standard allows about 8.7 hours of downtime annually, balancing high availability with reasonable server costs.
Define explicit Service Level Objectives instead of vague availability goals. Chasing absolute zero downtime produces diminishing returns unless you run a payment gateway or emergency service, so set a realistic target of 99.9% for your primary domain. You can then allocate your budget to monitoring tools that verify you stay above that specific threshold.
The Watermelon Effect and False Positives
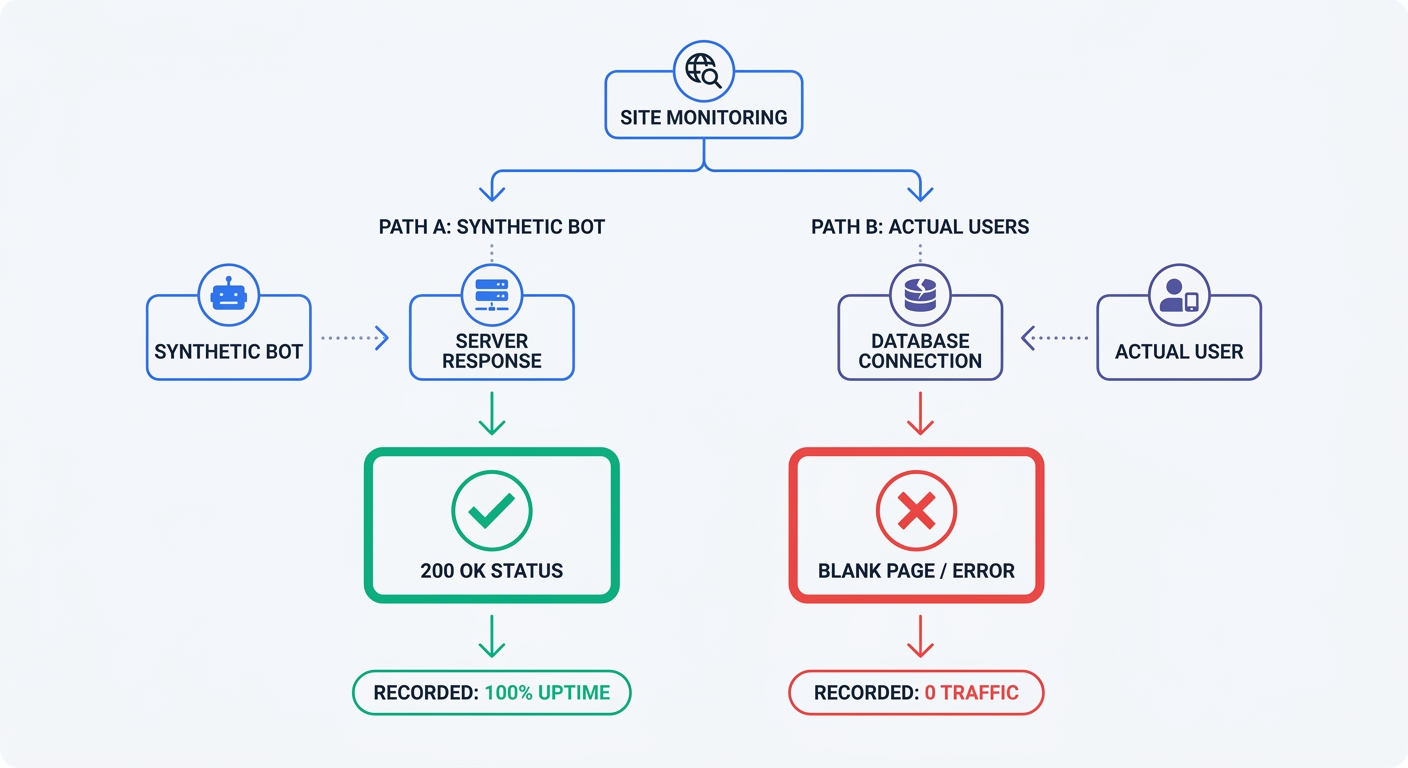
Do not trust a server ping blindly. The Watermelon Effect occurs when your free uptime monitor reports a green status while the live user experience remains red. This happens when your server returns a 200 OK status to the automated bot, making the dashboard look fine, even though a database query error leaves the frontend rendering a blank page for human visitors.
Cross-reference your synthetic monitor with live human behavior by keeping your real-time analytics dashboard open alongside your uptime tool. If the server status reads positive but Swetrix shows zero active users during peak hours, the site is functionally broken. Seeing this discrepancy tells you to investigate the database or application layer instead of restarting the web server.
Top Methods for Free Uptime Monitoring
HTTP/HTTPS vs. Keyword Content Checks
The most basic monitoring relies on HTTP and HTTPS checks, where the tool requests your homepage every few minutes to verify a 200 OK status code. These tools often track your SSL certificate expiration date alongside the server response. While this baseline coverage is helpful, catching database-driven failures requires additional configuration.
Configure keyword or content checks within your monitor to scan the loaded HTML for a specific string of text. Target an element that requires a database query, like a dynamic product price or a unique username in the header. If the server responds with a 200 OK but the database fails to populate that specific text, the monitor correctly triggers an outage alert.
Because external connections fail frequently, you must monitor them closely. Since third-party API reliability often fluctuates, integration failures can add significant annual downtime even if your primary server remains stable. Set up secondary HTTP checks to monitor these critical API endpoints alongside your main domain.
Synthetic Ping Testing vs. Real User Monitoring (RUM)
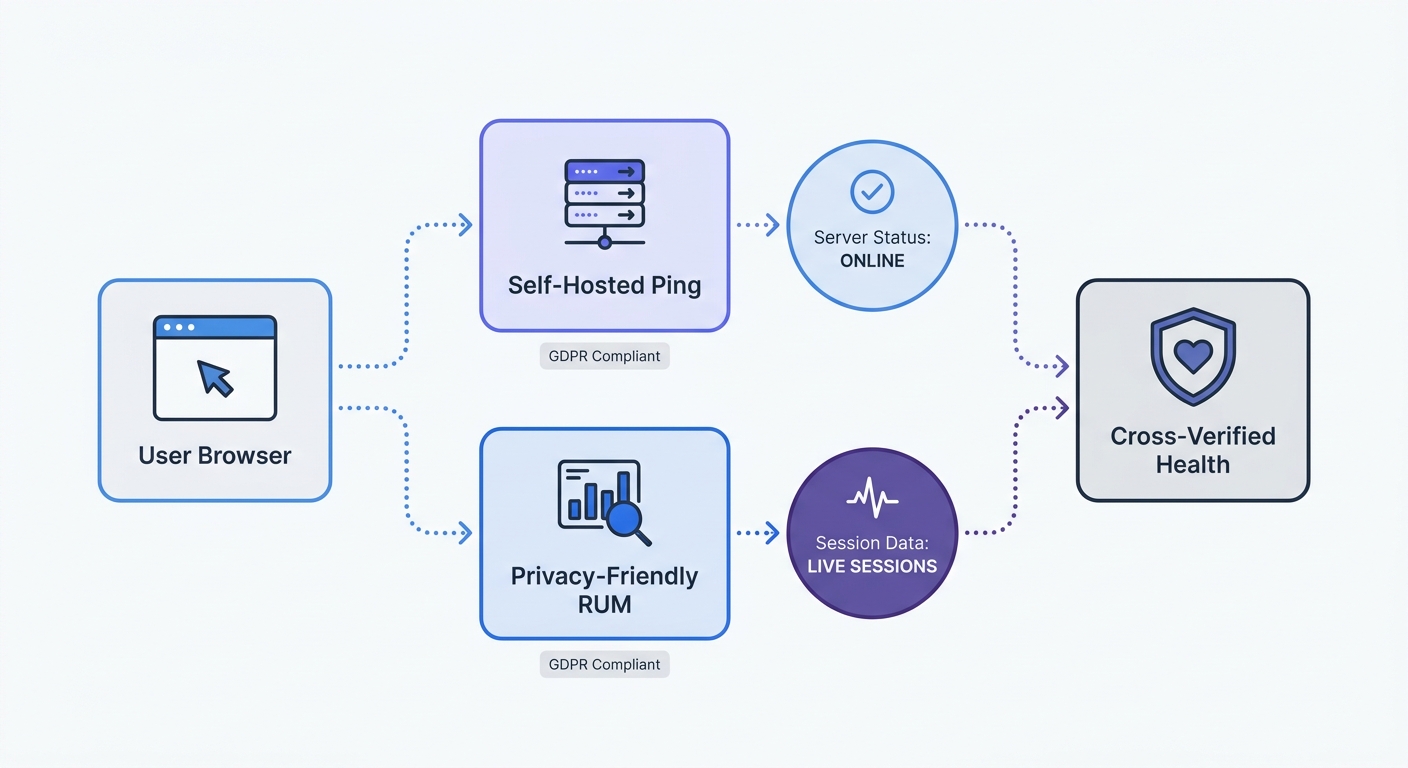
Uptime ping tools execute synthetic monitoring by simulating a sterile bot visit from a remote server. Understanding true availability requires Real User Monitoring, which measures live human sessions as visitors navigate server turbulence.
Swetrix serves as a reliable RUM tool that tracks session data, load times, and custom error events without cookies. This provides an accurate picture of what broke and who experienced it. While a synthetic ping confirms the server restarted, real session tracking calculates the specific number of visitors who abandoned their carts during that outage window.
Best Free Tools to Monitor Your Site
Self-Hosted and Privacy-First Options
Privacy-focused teams prefer keeping data ownership in-house. If you already prioritize GDPR compliance by self-hosting your infrastructure, you should add Uptime Kuma to your stack. This free, open-source monitoring tool runs on your own server, offering a clean dashboard alongside HTTP, keyword, and ping checks. Using open-source alternatives guarantees third parties never scrape your performance data.
Deploying Uptime Kuma takes minutes using Docker. After spinning up the container and mapping a local volume for the database, you can immediately start adding monitoring endpoints. Because the application lives on your infrastructure, you control the data retention limits and avoid vendor lock-in.
Cloud-Based Free Tiers
If you prefer a managed service, cloud-based free tiers provide immediate coverage without server setup. UptimeRobot offers fifty free monitors with five-minute check intervals, which handles the basic monitoring needs of most independent developers and small businesses.
Site24x7 and OnlineOrNot also deliver competitive free tiers that test from multiple global locations and handle incident alerting. Select the tool that matches your specific architecture. Deploying Uptime Kuma on a small VPS secures strict data control, whereas UptimeRobot delivers instant basic coverage without the burden of managing another server.
Actionable Best Practices for Uptime Management
Setting Up Multi-Location Pings
Localized network routing issues frequently cause false alarms. Your home internet might fail to reach the server while the rest of the world connects normally. To prevent this, configure your free monitoring tool to ping your URL from multiple global locations. Requiring at least two distinct geographic nodes to report a failure before the system triggers an alert rules out regional internet service provider or DNS drops.
Set a short grace period to filter out transient network blips by configuring your monitoring tool to wait two minutes after the first failed ping before sending a notification. If the site recovers within those 120 seconds, the tool logs the event and keeps your phone quiet.
Handling After-Hours Alerts and Status Pages
Outages rarely respect schedules. Since most website outages begin outside the traditional workday, relying on an email you check in the morning guarantees prolonged downtime, so route high-priority alerts to an automated SMS or a persistent push notification on your phone via Slack, Telegram, or Discord.
Build an automated public status page and connect it directly to your monitoring tool so visitors see real-time updates when components degrade, preserving brand trust during a crash. You can then use webhook alerts to manage your marketing budget automatically. When your ping tool fails or Swetrix registers a sustained zero-traffic anomaly, the webhook shuts off active ad spend until the successful status code returns.
Visibility keeps your website profitable. While your uptime monitor watches the servers, you need accurate, real-time analytics to understand the user experience. Swetrix provides privacy-focused, cookie-free web analytics that load instantly and never drag your performance down. Keep your data ownership strict and your insights clear. Start your 14-day free trial of Swetrix today.