- Date
How To Measure User Retention Rate Accurately
 Andrii Romasiun
A visitor lands on your pricing page on Tuesday, leaves, and comes back on Friday to sign up, but traditional analytics often logs them as two separate visitors. Your acquisition reports look great while your retention metrics plummet, because the platform cannot connect the Friday signup to the Tuesday visit without a tracking cookie. As a result, you end up optimizing for cheap, high-volume clicks instead of long-term engagement.
Accurate retention measurement requires tracking returning users across multiple sessions, which means rethinking how you collect data. Privacy-first tools like Swetrix bypass the cookie consent data drain entirely to give you a complete picture of who stays and who leaves.
Understanding and Calculating User Retention
Defining User Retention Rate
User retention rate measures the percentage of customers who continue paying for or using your product over a specific timeframe. To calculate it, you capture a snapshot of your user base at the start of a period and track how many of those exact same people are still active at the end.
Measuring this correctly requires filtering out new acquisitions. If you start January with 1,000 users, lose 500 of them, but acquire 600 new ones, your total user count grew to 1,100. A top-level dashboard might show user growth even when your retention rate hits a catastrophic 50%. Separating new users from returning users prevents masking severe product issues with aggressive marketing spend.
The Universal Formula for Retention
To find your exact retention percentage, you need three numbers for a defined time period: the number of customers at the start (CS), the end (CE), and the new customers acquired during that period (CN).
The universal formula is: ((CE - CN) / CS) x 100
If you start Q3 with 5,000 active users, acquire 1,200 new users during the quarter, and end Q3 with 5,400 total users, you plug those numbers into the formula. First, subtracting the 1,200 new users from the 5,400 total ending users leaves 4,200 retained users. Dividing that 4,200 by the starting count of 5,000 gives you 0.84, which you multiply by 100 to reach an 84% quarterly retention rate.
The Difference Between Retention and Churn
Retention and churn represent the exact same behavior measured from opposite directions, where retention tracks the users who stay and churn tracks the ones who cancel.
Mathematically, Retention Rate equals 100% minus the Churn Rate, meaning if your monthly churn is 7%, your monthly retention is 93%. You should track both because they serve different operational purposes: customer success teams typically target churn rate to identify why users leave, while product teams optimize retention rate to understand which features keep users engaged.
Accurate calculation for either metric relies entirely on a reliable starting count (CS). If your analytics platform underreports your starting users, every formula breaks, which happens constantly on tools heavily affected by ad blockers and cookie restrictions. Using a privacy-friendly platform ensures your baseline numbers reflect actual human visitors, preventing calculation errors before they start.
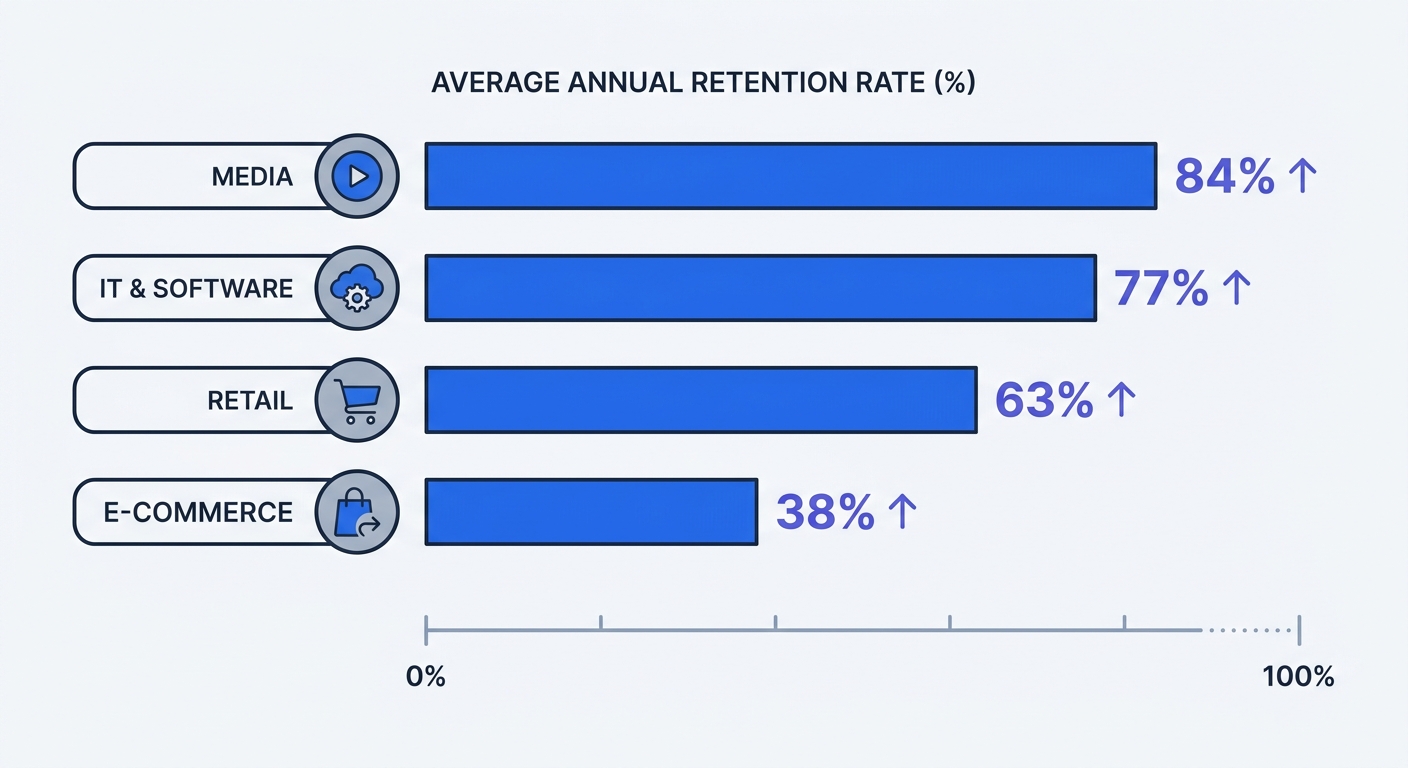
Industry Benchmarks for User Retention Rates
A healthy retention rate depends entirely on your business model, billing cycle, and industry. Because comparing a daily habit app to enterprise accounting software leads to terrible strategic decisions, you must benchmark your performance against your specific sector.
B2B SaaS and Software Benchmarks
Software-as-a-Service (SaaS) businesses require high retention to survive their customer acquisition costs. B2B products generally see higher loyalty than B2C software because switching enterprise tools involves heavy migration costs and team retraining.
Short-term software retention tells a different story. While software products retain an average of 39% of users after one month of use, approximately 30% still log in regularly after three months, maintaining usage above 40% past the 90-day mark signifies strong product-market fit, whereas a drop below 20% indicates an onboarding or core utility problem.
Mobile App and E-commerce Averages
Mobile applications face the steepest drop-off curve in digital business, with the average Day 1 retention rate sitting near 25% across all categories. This means 75% of users download an app, open it once, and never return.
By Day 7, app retention averages 10 to 11%, and by Day 30, a mobile app retaining 5 to 6% of its initial cohort performs at the industry average. Habitual-use apps like fitness trackers or finance dashboards experience higher Day 30 rates, though their initial drop remains steep.
E-commerce businesses operate on entirely different cycles. Because retail customers buy when they need something rather than subscribing to a daily service, e-commerce platforms average a 30% to 31% annual retention rate, though this ranges widely from 12% for electronics to 45% for consumable goods. You measure this sector by tracking repeat purchase rates and average time between orders instead of daily logins.
Overcoming Data Loss in Retention Measurement
You cannot measure what your analytics platform cannot see, meaning most modern retention measurement problems stem from data collection failures rather than mathematical errors.
The Cookie Consent Blind Spot
Traditional web analytics platforms like Google Analytics rely on tracking cookies to assign a unique ID to a visitor, so when that user returns days or weeks later, the platform reads the cookie and logs a returning session.
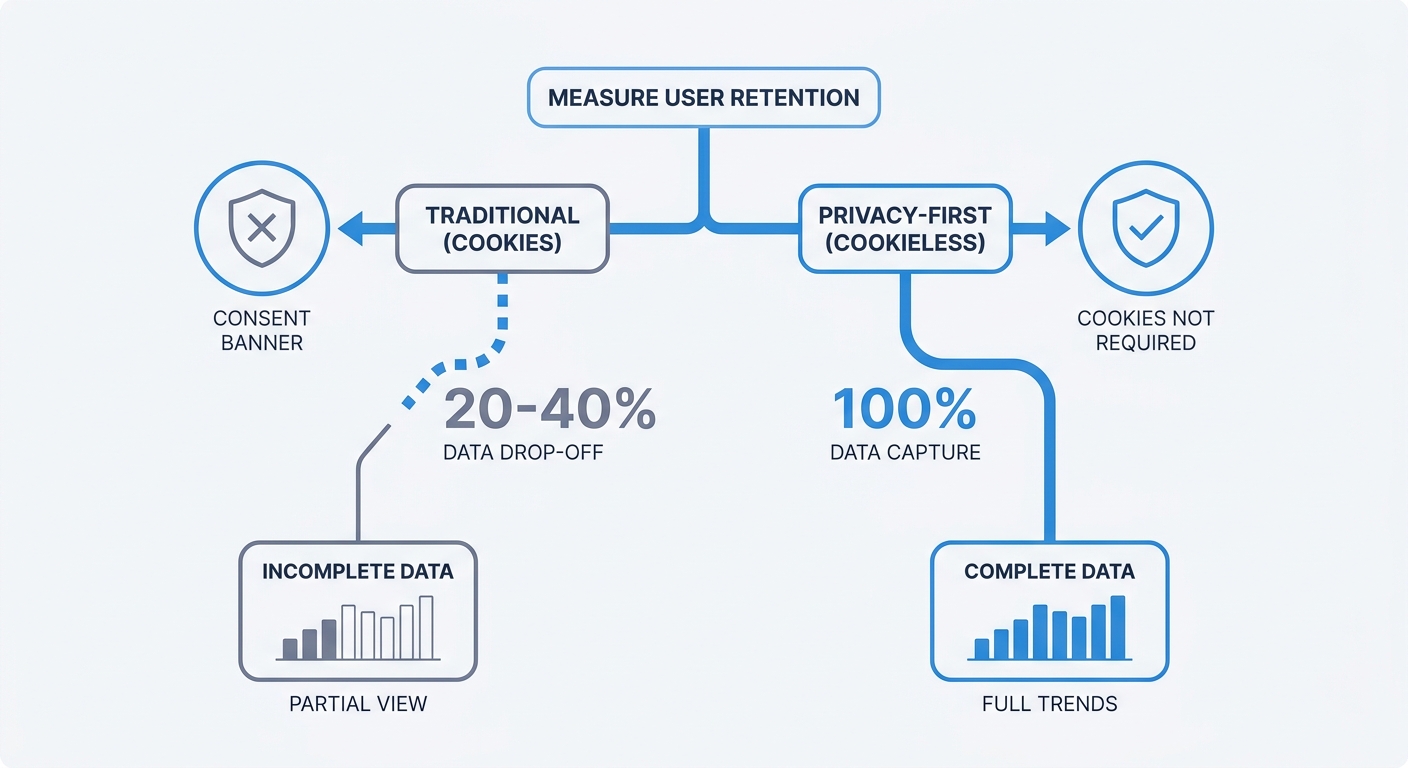
Privacy laws like GDPR and CCPA require websites to obtain explicit user consent before placing these trackers. When website visitors decline cookie consent banners, standard analytics platforms completely drop them from measurement, causing sites to lose a significant portion of their actual traffic data to consent rejections.
This creates a blind spot for retention metrics, as returning users who clear their cookies, use private browsing, or reject the consent banner appear as brand new visitors. Consequently, your new user count inflates, your returning user count shrinks, and your calculated retention rate drops. This forces teams to troubleshoot product churn problems that only exist inside a broken analytics dashboard.
How Swetrix Solves the Cookieless Challenge
You fix the consent data gap by adopting cookieless analytics tools like Swetrix, a privacy-first, open-source web platform that avoids cookies, cross-site tracking, and device fingerprinting entirely.
Instead of attaching a persistent ID to a user's browser, Swetrix uses anonymized session aggregation to track engagement and returning traffic trends without triggering aggressive GDPR consent banners. Because you do not need to ask for permission to track personal data, you stop losing unconsenting traffic at the door.
Every visit registers correctly, allowing you to capture 100% of your traffic ethically. With reliable baseline numbers, you can calculate your retention rates with confidence and base product decisions on complete data rather than fragmented tracking.
Moving Beyond Basic Retention Rates
A single percentage point rarely tells the whole story, meaning as your business matures, you need to track how different user groups behave and how revenue scales alongside user counts.
Shifting to Net Revenue Retention (NRR)
In B2B and SaaS models, measuring raw user retention is giving way to Net Revenue Retention (NRR) as the primary North Star metric, because while raw retention treats all customers equally, NRR weights them by the money they spend.
NRR accounts for expansion revenue, account upgrades, downgrades, and churn simultaneously using this formula: ((Starting MRR + Expansion MRR - Downgrade MRR - Churn MRR) / Starting MRR) x 100.
The median NRR for B2B SaaS companies typically hovers above the 100% mark. A number over 100% proves your business can grow revenue solely through existing customers without acquiring a single new logo, as your expansion revenue from upgrades outpaces the revenue lost to cancellations. Top-quartile SaaS performers consistently exceed 120% NRR, building highly resilient business models that weather acquisition slowdowns.
Utilizing Cohort Analysis
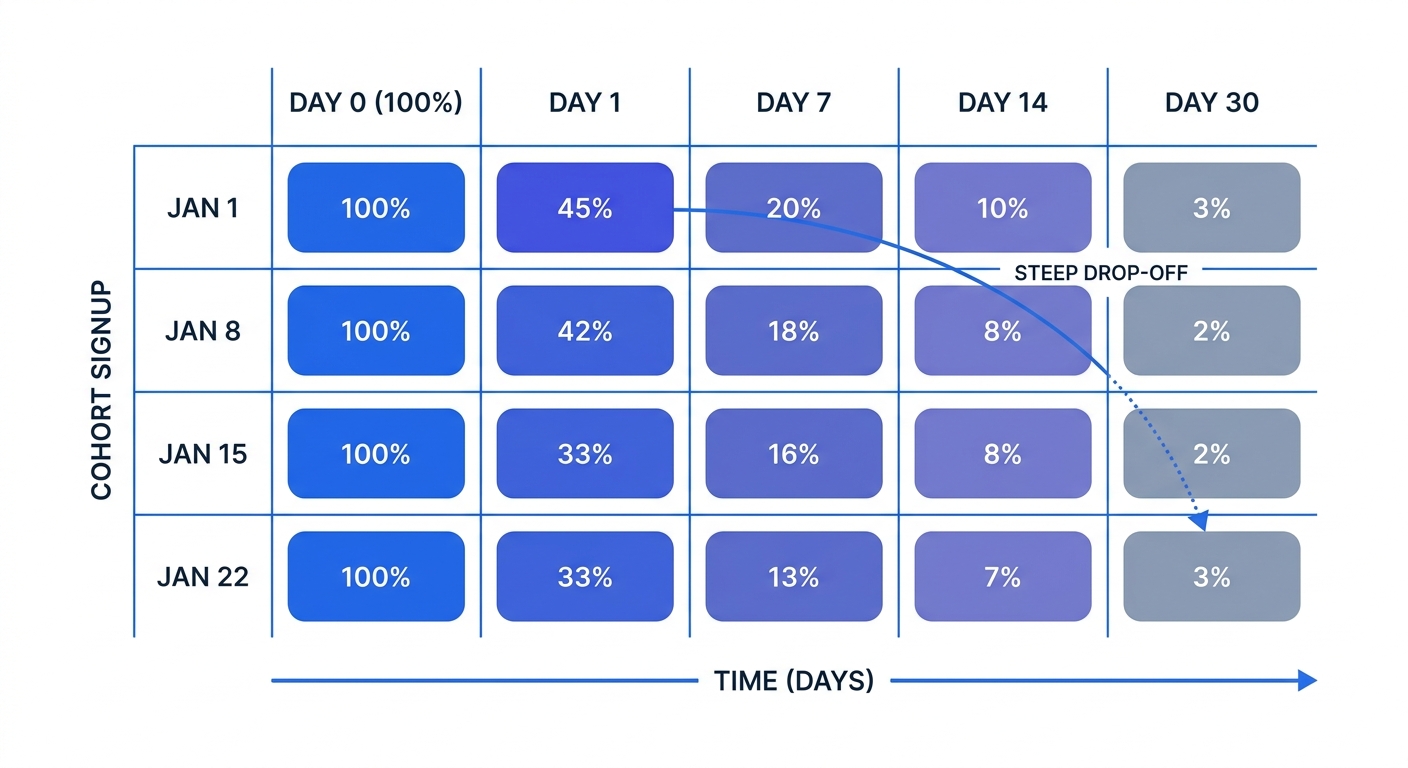
Tracking a single, blended retention rate hides behavioral shifts. If you changed your onboarding flow last month, a blended rate mixes the new users with users who signed up two years ago, making it impossible to isolate the impact of the change.
Cohort analysis fixes this by grouping users based on their acquisition date. You build a matrix where each row represents a signup period, like the first week of May, and the columns represent subsequent active periods like Week 1, Week 2, and Week 3.
Reading across a row lets you watch a specific group decay over time, while reading down a column compares how different groups perform at the same stage in their lifecycle. If the Week 1 retention rate suddenly jumps for the cohort that joined after your latest feature release, you know the update worked. Most analytics platforms, including Swetrix, allow you to segment your user base to build these targeted retention views.
Tracking Leading Indicators
User retention is a lagging indicator, meaning you only know you lost a user after they are already gone. Because waiting for the retention rate to drop ensures you are reacting too late, you must track leading indicators that predict churn before it happens.
Monitor your Daily Active Users to Monthly Active Users (DAU/MAU) ratio to measure product stickiness. By dividing your daily active users by your monthly active users, you find a percentage where a 20% ratio means the average user logs in six days a month. If that ratio starts sliding downward for a specific cohort, they are losing interest and will likely cancel their account in the next billing cycle.
You should also track feature adoption rates, as users who only utilize one core function of your software churn faster than users who embed multiple features into their daily workflows. Set up custom event tracking to monitor how deeply new signups explore the platform. When a user stops clicking on secondary features, flag their account for a customer success intervention to re-engage them.
Actionable Strategies to Improve Retention
Because acquiring a new customer costs up to five times more than retaining an existing one, reallocating marketing budget toward retention campaigns often yields a much higher return on investment than running another set of top-of-funnel ads.
Optimizing Time-to-Value (TTV)
Because roughly 75% of app users churn after the first day, fixing the initial 24 hours provides the best opportunity for improving long-term metrics by shortening the Time-to-Value (TTV).
TTV measures how long it takes a new user to experience the core benefit of your product. If your software requires a user to watch a tutorial, integrate a database, invite three team members, and wait for a server sync before they see a result, your TTV is too long and they will abandon the setup.
Audit your onboarding flow to remove mandatory profile completion steps that do not impact the immediate product experience. Pre-fill dashboard templates with sample data so users understand the layout instantly, and move technical integrations to Day 2 or Day 3 emails. After giving them a quick win within the first three minutes of logging in, use an A/B test calculator to measure whether simplifying the first screen statistically improves Day 1 survival rates.
Utilizing AI and First-Party Data
As third-party cookies disappear, relying on anonymous ad targeting to bring users back becomes expensive and inaccurate, making it necessary to move users behind a login wall early.
By incentivizing users to create accounts, you shift from anonymous browser tracking to persistent, authenticated first-party data. When a user logs in on their phone and later on their laptop, you track the exact same profile compliantly across devices, allowing you to build accurate lifetime value (LTV) models without relying on fragile tracking scripts.
To combat the sharp 30-day drop-off in mobile and software engagement, integrate AI-driven personalization using this first-party data. Apps that deliver custom content and dynamic product recommendations succeed at keeping users engaged past the onboarding phase. Feed your behavioral event data into recommendation engines to show returning users the features, products, or articles they are statistically most likely to click based on their previous authenticated sessions.
Accurate retention metrics require clean data, because if your analytics platform loses a third of your returning users to consent banner rejections, you cannot make reliable product decisions. Swetrix provides a fully privacy-compliant, cookieless alternative that captures complete session data without violating user trust. This lets you build cohorts, track events, and monitor real-time engagement on infrastructure hosted in the EU.
Plans start at $19/month for 100,000 events, so start your 14-day free trial today at swetrix.com/signup.