- Date
How to Measure Marketing Campaign ROI Accurately
 Andrii Romasiun
Traffic spikes look promising, but a negative return on ad spend demands action. Marketers must know how to measure marketing campaign roi to maximize profit. Companies lose ad budgets to a black box without tracking tools. An effective system maps every dollar spent to a dollar earned. At Swetrix, we build cookie-free analytics to deliver attribution data while protecting user privacy.
How to Measure Marketing Campaign ROI: The Basics
Understanding the Measurement Gap
Marketing return on investment quantifies the profit your promotional efforts generate. Track returns to scale winning campaigns. Ignore the numbers to burn cash on dead channels. Many companies lack this capability despite the high value of attribution data. Global marketers claim confidence in their measurement skills. Yet Nielsen research reveals fewer than four in ten professionals can map returns across multiple channels.
Data silos cause this disconnect. Advertising platforms operate in isolation and grade their own homework. When a buyer clicks a Facebook ad on Monday and searches your brand on Google on Friday, both platforms claim credit for the sale. Facebook Ads Manager displays one conversion. Google Ads reports another. Meanwhile, the website analytics platform attributes the sale to direct traffic. This fragmentation destroys your ability to allocate budgets. Unifying these reports requires a centralized tracking mechanism. Swetrix provides a way to capture cross-channel traffic from the first touchpoint.
The 5:1 Rule and Industry Benchmarks
Target a 5:1 return ratio to establish a baseline for success. Five dollars generated for every one dollar spent covers production costs, product margins, and overhead. A ratio below 3:1 signals an unprofitable venture after factoring in operating expenses. Earning above 10:1 suggests you are under-spending and surrendering market share to competitors.
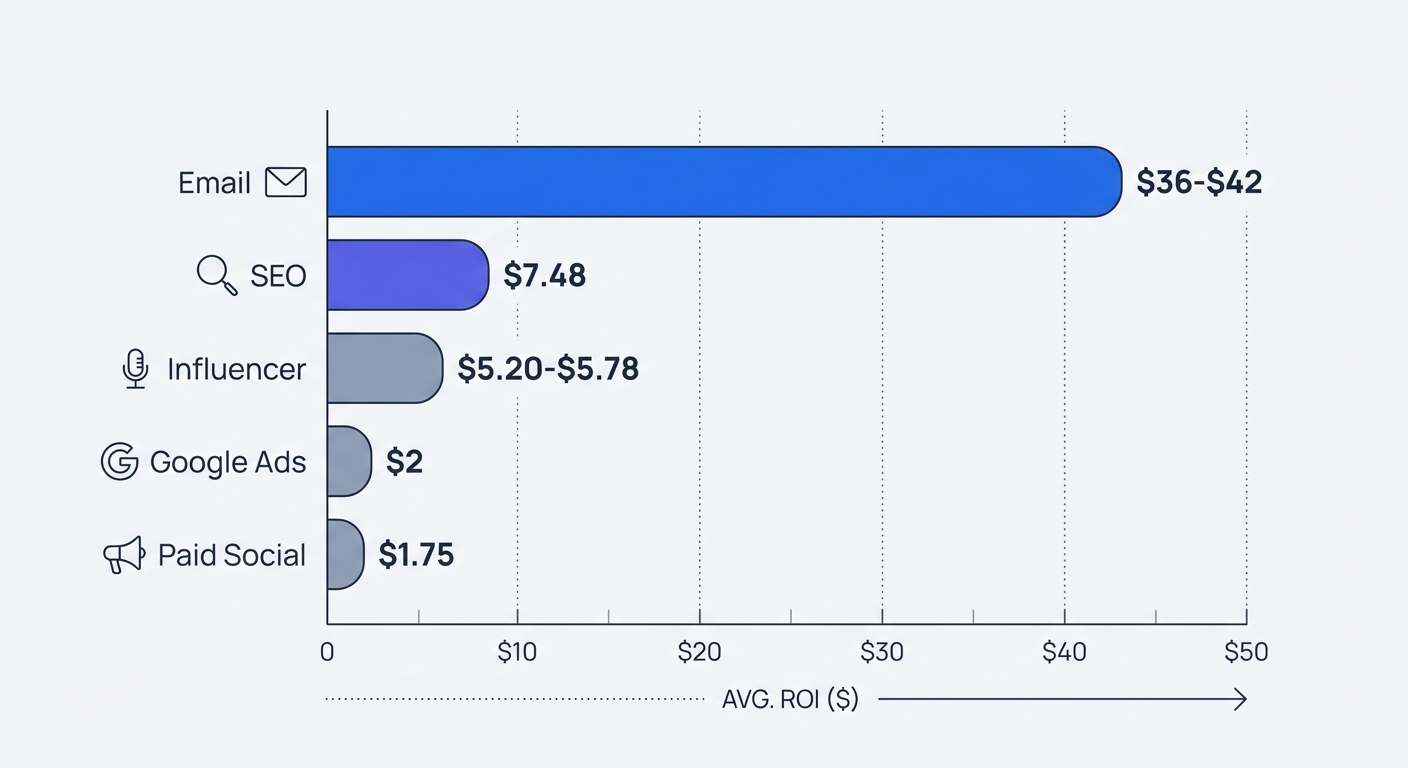
Benchmarks vary by channel, format, industry, and attribution model, meaning these figures represent broad ranges that will differ based on your specific circumstances. B2B software companies face longer sales cycles than B2C ecommerce brands. The timeline for recognizing returns shifts based on the chosen medium.
| Marketing Channel | Average Return per $1 Spent | Timeline to Maturity |
|---|---|---|
| Email Marketing | $36 to $42 | Immediate |
| SEO (B2B) | $7.48 | 6 to 12 Months |
| Influencer Campaigns | $5.20 to $5.78 | 1 to 3 Months |
| Google Ads (PPC) | $2.00 | Immediate |
| Paid Social | $1.75 | 1 to 4 Weeks |
Content formats alter return timelines. Video content delivers a positive return faster than written text due to higher engagement rates. Lowering production costs improves margins from the start.
Core Metrics for How to Measure Marketing Campaign ROI
The Standard Return Formula
Calculate standard returns using a basic equation. Subtract the cost of investment from the gain from investment. Divide this figure by the cost of investment. Multiply the result by 100 to get a percentage.
Spending $2,000 on a Google Ads push to generate $10,000 in sales creates a formula of ($10,000 - $2,000) / $2,000. This equals 4. Multiply by 100 to see a 400 percent return. The challenge lies in defining the cost of investment. Include agency fees, software subscriptions, internal labor hours, and creative production costs to get a complete picture. Excluding these hidden costs misleads the executive team.
Consider a complex scenario like a podcast sponsorship. The ad spot costs $5,000. A copywriter charges $500 to script the read. Offering a 10 percent discount code to listeners reduces the margin on $20,000 of gross sales by $2,000. Total costs equal $7,500. Net gains equal $18,000. The math becomes ($18,000 - $7,500) / $7,500. The final return is 140 percent.
Setting Baselines and Time Windows
Marketers must gather sufficient data before evaluating campaigns. Stopping an initiative in the first week creates false negatives. Wait for statistical significance before making major adjustments. Standard practice requires at least 100 conversions or 30 days of active run time to recognize clear patterns.
Establish baseline metrics 30 days prior to launch. Record average revenue per day, baseline organic traffic, and baseline conversion rate. Compare the new data against these baselines to measure the incremental lift. A spike in sales during a campaign launch means nothing if seasonal organic traffic caused the increase.
Document these baselines in a shared spreadsheet. Create columns for specific metrics like cost per acquisition, average order value, and lifetime value. Map the anticipated changes before launching the advertisements to track performance.
How Tracking Has Changed: The Cookieless Shift
The Death of Third-Party Cookies and Privacy Risks
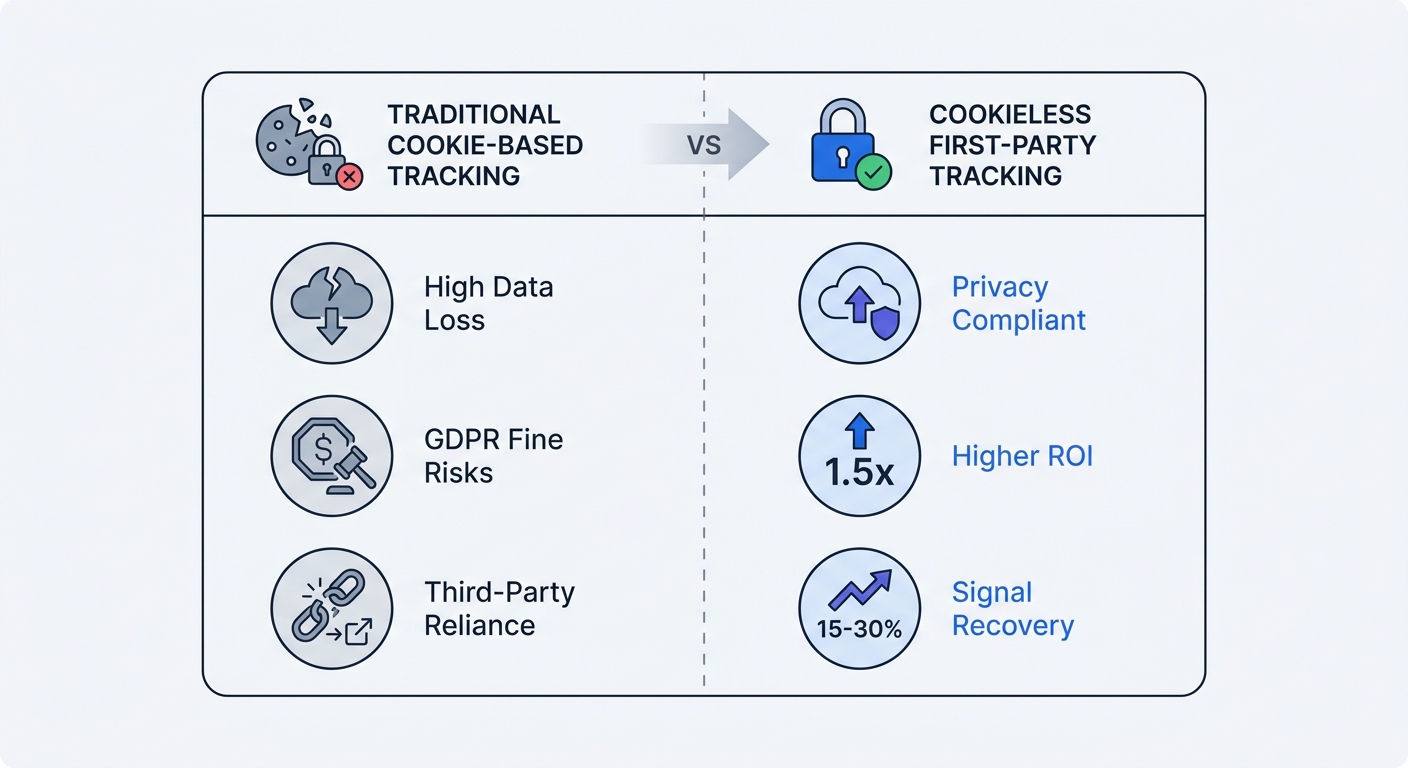
Legacy tracking models relied on dropping third-party cookies into user browsers to follow them across the internet. Safari and Firefox block these tracking methods by default. Google Chrome continues to implement strict tracking restrictions. Regulators enforce harsh penalties for unauthorized data collection. European authorities have levied billions in fines for privacy violations under frameworks like the GDPR and the ePrivacy Directive.
Modern tracking requires explicit consent under these legal frameworks. Traditional analytics platforms go blind if users reject the prompt. Brands lose the attribution data needed to calculate returns. Ad blockers intercept tracking scripts before they load to compound this issue.
Why First-Party Data Wins
Brands must adopt consensual data models. Companies using first-party data strategies achieve better customer retention and a higher return on ad spend compared to businesses tied to legacy methods. Building a first-party data asset protects tracking capabilities from browser updates.
Swetrix solves the consent problem. Our open-source platform utilizes cookieless tracking mechanisms to operate without invasive scripts. We hash the user agent and IP address with a salt that rotates every 24 hours. This generates an anonymous identifier. Users capture complete campaign data without triggering intrusive consent banners or violating privacy laws. Every click, pageview, and conversion flows into the dashboard in real time.
Step-by-Step Guide on How to Measure Marketing Campaign ROI
Implement Strict UTM Parameter Protocols
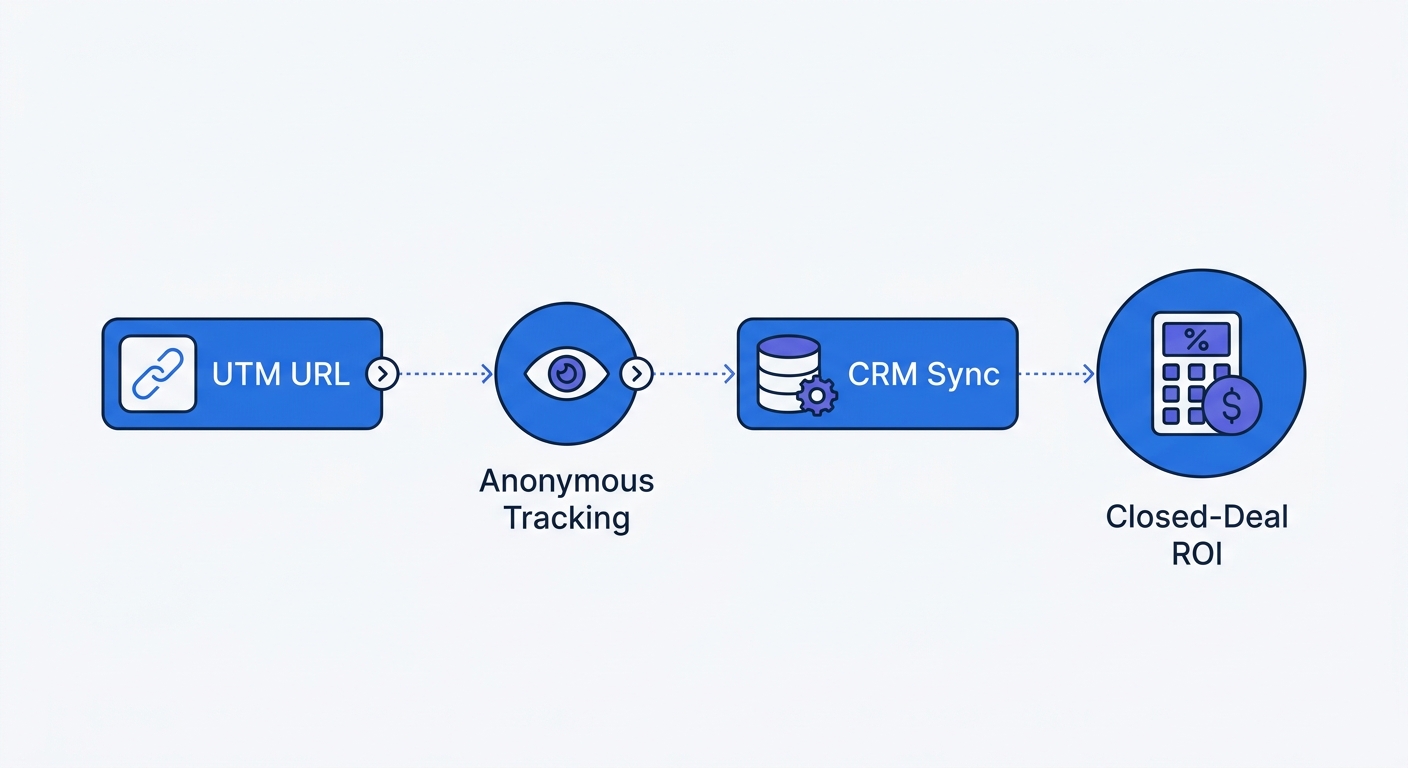
UTM parameters remain the most reliable way to pass source and medium data in a cookieless environment. These text strings append to destination URLs to tell the analytics platform where the visitor originated.
Track five specific parameters per link.
- Source: The specific site driving the traffic (google, linkedin, newsletter).
- Medium: The marketing channel (cpc, organic, email).
- Campaign: The specific promotion name (spring_sale_2026).
- Term: The paid keyword driving the click (b2b_software).
- Content: The specific ad variation or button clicked (blue_banner_v2).
Standardize naming conventions across the marketing team. A misspelled tag splits data into separate rows in the dashboard. Capitalized "Facebook" and lowercase "facebook" register as two different traffic sources. Use lowercase letters and underscores to maintain clean reports. Generate links using the Swetrix UTM Generator to prevent formatting errors.
Utilize Privacy-First Analytics Platforms
Configure the analytics platform to capture tagged links. Traditional tools drop data when users block scripts or reject consent. Privacy-focused alternatives circumvent this by capturing traffic patterns on an aggregate level without client-side storage.
Set up Swetrix to monitor campaign traffic. The platform parses UTM tags on page load and files each visit under the correct campaign. Marketers gain clear attribution without tracking individual identities. Swetrix Cloud pricing starts at $19 per month for 100,000 events. We never restrict features behind enterprise tiers. Subscribers receive custom event tracking, performance monitoring, and shared dashboards out of the box.
Create custom events in the Swetrix dashboard to track specific campaign goals. If an initiative aims to drive newsletter signups, configure an event for the form submission button. Review the events report to see which UTM campaign drove the highest volume of button clicks.
Connect Web Analytics with CRM Data
Website clicks do not equal revenue in B2B marketing. A visitor downloads a whitepaper, enters a nurture sequence, and closes a deal three months later. Bridging the gap between the initial digital click and the closed sales deal requires CRM integration.
Capture UTM parameters using hidden form fields on landing pages. Add five hidden inputs to the lead capture form matching the UTM parameters. Developers can use a JavaScript function to pull the URL parameters from the browser address bar and inject them into the hidden fields.
Security Warning: Reading from location.search and injecting values directly into hidden inputs can enable DOM-based XSS attacks unless UTM values are properly validated and encoded before DOM insertion. Attackers can craft malicious URLs with JavaScript payloads in UTM parameters that execute when injected into the page. Prefer using your marketing platform's native UTM capture mechanisms, or ensure all UTM values are sanitized and HTML-encoded before insertion into form fields or the DOM.
When a lead submits the form, the CRM records the source and medium alongside their contact details. The sales team works the lead until the deal closes, attaching the revenue to the original campaign source. Run a report in the CRM grouping closed-won revenue by campaign source. Compare this revenue against the ad platform spend to find the final return.
Ecommerce brands face a different tracking environment than B2B companies. Direct-to-consumer websites must track purchase amounts rather than lead sources. Swetrix handles ecommerce tracking through custom revenue events. Configure the checkout page to trigger an event upon payment success, passing the order total as the event value. The dashboard aggregates this revenue data and maps it against the UTM source of the user session. The system displays purchase totals generated by Facebook ads alongside the click data, eliminating the need for complex CRM routing.
Advanced Tactics: Overcoming Blind Spots
Server-Side Tracking for Lost Signals
Client-side ad blockers restrict data flow from the browser to analytics tools. Move the tracking infrastructure from the browser to a secure server to reclaim this data. Server-side tracking containers act as an intermediary between the website and advertising platforms.
The website sends a single data stream to the server. Server rules determine the data points forwarded to Facebook, Google, or Swetrix. Engineers strip out personal identifiers before forwarding conversion signals to ad networks. Server-side implementation recovers a high volume of lost conversion signals. Recovering this missing data often reveals that underperforming campaigns are profitable.
Adopting Marketing Mix Modeling
Multi-touch attribution struggles as privacy laws strengthen and cross-site tracking fades. Marketers adopt Marketing Mix Modeling to fill the dark spots in their reports. This approach analyzes historical sales data to estimate the impact of various marketing tactics.
Marketing mix models find correlations between ad spend and total revenue. Increasing paid search spend by 20 percent and seeing total sales rise by 5 percent two weeks later leads the model to assign partial credit to the search channel.
Machine learning algorithms process these datasets to give executive teams a clear picture of channel performance. Start by compiling two years of historical data. Gather weekly spend by channel, total weekly revenue, and external factors like seasonality or pricing changes. Feed this data into an open-source modeling tool to generate an attribution model that respects user privacy while delivering actionable insights.
Measurement dictates marketing success. Stop guessing which channels drive revenue. Relying on isolated ad platform data leads to wasted budgets and missed opportunities. Brands require a unified, privacy-compliant tracking system to map conversions to their source.
Swetrix provides the cookie-free tracking tools needed to capture cross-channel data, analyze user behavior, and prove the value of every dollar spent. Our platform grants access to real-time dashboards, UTM tracking, and performance metrics without forcing intrusive consent banners on visitors. Start a 14-day free trial today and take control of your marketing data.