- Date
How To Measure Brand Awareness Online Without Cookies
 Andrii Romasiun
Suppose you run a major podcast sponsorship. Thousands of listeners hear the host read your ad, search for your company on their phones, and eventually convert on a desktop computer three days later. Because default analytics platforms look at that final desktop conversion, they assign all the credit to a direct search or a branded Google ad. The resulting report shows zero sales attributed to your top-of-funnel marketing, leaving your campaign looking like a failure.
Measuring brand awareness requires observing aggregate shifts in how people find your website rather than relying on individualized click-by-click tracking. Legacy multi-touch attribution models relied heavily on third-party cookies to stitch fragmented user journeys together, but browsers now block those trackers by default. This change cuts off access to individual-level attribution data, forcing marketers to measure total traffic baselines to track the true impact of their campaigns. By using privacy-first, cookie-free platforms, you can see exactly when top-of-funnel visibility spikes without needing invasive consent banners.
Why Brand Awareness Matters in a Privacy-First World
The Shift Back to Top-of-Funnel Metrics
Marketing teams spent the last decade optimizing for immediate conversions because performance marketing offered perfect trackability, provided a user clicked a specific link and accepted a tracking cookie. You could tie one dollar of spend to three dollars of revenue, creating a system that prioritized the bottom of the funnel at the expense of long-term brand growth.
That model breaks down under modern privacy laws. Users actively reject cookies, browsers strip tracking parameters from URLs, and ad blockers prevent tracking scripts from loading. This loss of signal forces a return to foundational metrics. In fact, a growing number of B2B CMOs now track brand awareness as their primary marketing KPI as the focus shifts toward long-term growth. Creating demand precedes capturing it, which requires a different set of measurement tools.
Focusing on total audience reach and aggregate visibility protects your strategy from algorithmic changes. Once you build a recognizable brand, buyers seek you out directly instead of waiting for a targeted advertisement to appear in their feed.
Why Traditional Measurement is Failing
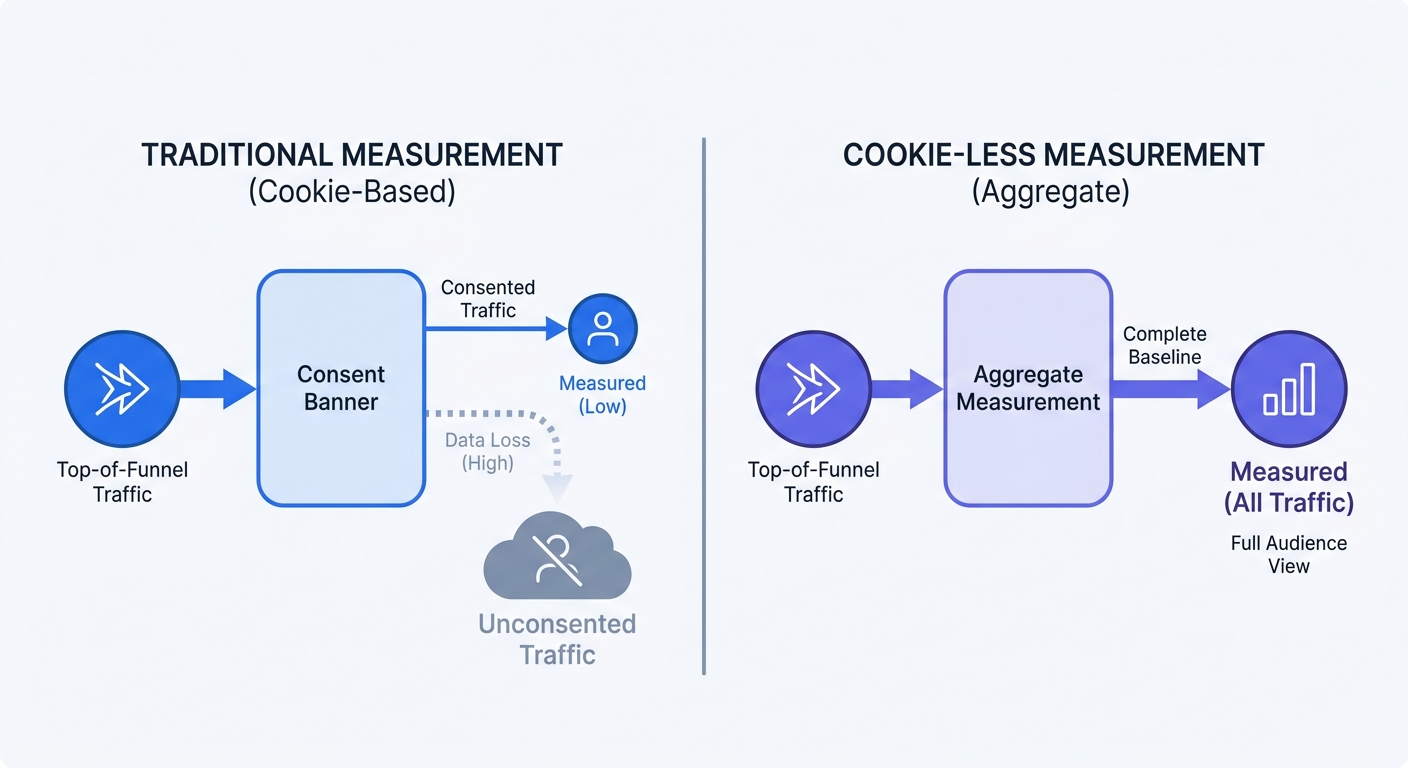
Traditional platforms like Google Analytics can use consent mode in different ways. Basic Consent Mode blocks tracking tags entirely until consent is granted, meaning denied consent prevents session recording. Advanced Consent Mode (also called Google Consent Mode v2) can send cookieless pings to Google servers even when consent is denied, supporting modeled conversions—though this still represents estimated, aggregated data rather than individual sessions. Actual data capture varies widely depending on implementation, banner design, and regional consent rates; some strict EU implementations see acceptance rates between 40% and 54%, though many factors influence this.
Cookieless tracking systems can improve visibility in these scenarios. Platforms like Swetrix use techniques such as hashing IP addresses and User-Agent strings to generate anonymous session identifiers without cookies. However, GDPR compliance depends on your site's specific configuration, local legal context, and how you handle the data—it is not an absolute guarantee. Additionally, such approaches may undercount visitors behind shared NATs, VPNs, or privacy tools, and some visitors may block requests entirely.
| Measurement Approach | Data Capture | Regulatory Compliance | Best Use Case |
|---|---|---|---|
| Legacy Cookie Analytics | Varies by consent implementation and mode | Requires Explicit Opt-In | Retargeting specific users |
| Privacy-First Analytics | Higher coverage (though not guaranteed complete) | Depends on configuration & context | Measuring aggregate brand traffic |
Relying on incomplete data leads to bad budget decisions. Cutting top-of-funnel spend because cookie-based tracking shows low ROI creates a downward spiral where fewer people discover your brand, eventually choking your performance marketing channels.
Key Metrics to Track Brand Growth
Direct Traffic and Dark Social Spikes
Direct traffic often causes confusion in web analytics. The "Direct" or "None" traffic bucket captures visits that lack HTTP referrer headers, UTM parameters, or other recognized click IDs. This can include people typing your URL directly, clicking bookmarks, following links from private messaging apps (Slack, Discord, WhatsApp, email clients), or arriving via browsers and privacy tools that strip referrer information.
While some industry professionals use the term "dark social" to describe unattributed sharing in private channels, the Direct/None bucket does not exclusively represent dark social—it is simply an unknown-source category. An increase in Direct/None traffic does not, by itself, prove campaign impact or growth in word-of-mouth sharing. To distinguish potential dark social lift from other unattributed sources, use campaign tagging (UTM parameters) on every trackable link or run controlled experiments (e.g., geographic or time-based holdouts) to isolate incremental effects. Establishing a stable baseline for current Direct/None traffic helps identify changes, but causality requires additional evidence.
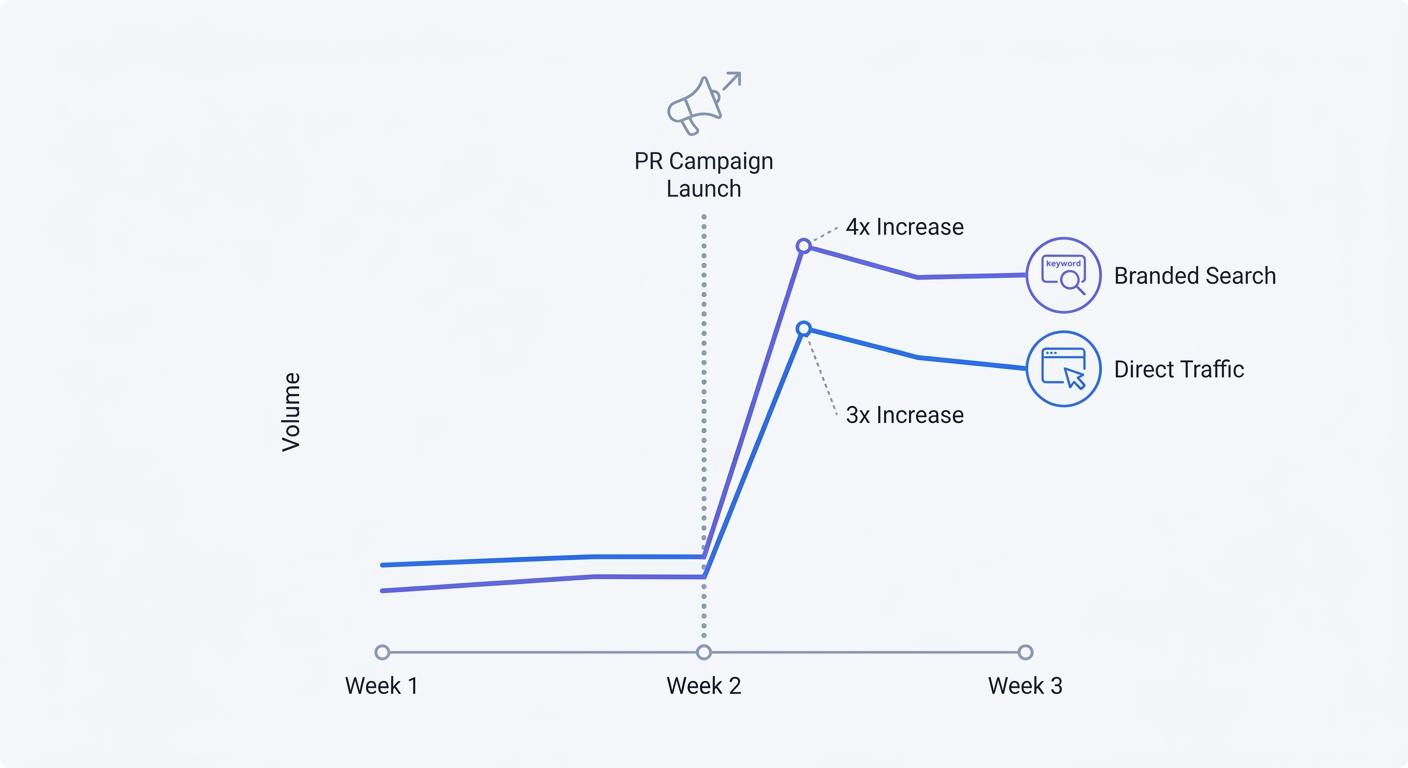
Start by calculating your daily average direct traffic for the thirty days prior to a brand campaign. Since a proper baseline must account for weekend dips, using a full month of data prevents skewed averages. Launch your PR push, podcast ad, or billboard, then monitor the direct traffic line in your Swetrix dashboard.
Subtracting your 30-day baseline from the new daily totals reveals an estimated delta that may be associated with your campaign. For example, if your baseline sits at 500 direct visitors a day and jumps to 1,200 a day following a major tech blog feature, the 700-visit increase could represent lift from the campaign—but this observational correlation does not establish causation. Other factors (seasonality, unrelated PR, algorithm changes) may contribute to the spike. To measure true incremental impact and assign monetary value, run a controlled experiment such as a geographic holdout or time-based A/B test. Self-reported signals and traffic deltas provide directional evidence but do not constitute closed-loop attribution or exact ROI calculations.
Branded Search Volume Trends
While direct traffic measures immediate sharing, branded search tracks delayed recall. A prospect might see your sponsor logo on a YouTube video, remember the name, and type it into Google three days later. Standard web analytics registers this as organic search, blending the brand win into your general SEO metrics.
To separate brand recall from non-branded SEO, track exact brand match queries in Google Search Console to see how many people actively sought out your company.
Follow these steps to isolate your brand recall metrics:
- Open Google Search Console and navigate to the Performance report.
- Click "+ Add filter" (or "New" in some interface versions) and select "Query".
- If available, choose "Branded queries" to automatically filter for brand-related terms (note: this filter may include related terms beyond exact matches). Otherwise, select "Custom (regex)" and input an anchored regex expression matching exact brand variants and common misspellings (e.g.,
^(brandname|brand name|branndname)$). Anchored regex (using^and$) matches only exact query variants, while "Branded queries" may capture broader related terms. - Set the date range to compare the 30 days during your campaign to the preceding 30 days.
- Note that anonymized queries (those with very low search volume) are excluded from Search Console data, and row truncation may make displayed totals incomplete for high-volume brands.
Impressions represent the number of times your brand's link appeared in search results—they indicate visibility, not proof that people independently recalled or searched for your brand (users may have been prompted by autocomplete, related searches, or other factors). Clicks confirm visitors followed the link to your site. Plotting impressions on a timeline alongside direct traffic trends can reveal patterns, but simultaneous upward trends are associations, not proof of causation. To draw stronger performance conclusions, combine impression and click data with other signals such as query composition, surveys asking how users heard about you, or controlled experiments that isolate campaign effects.
Combining Analytics With Zero-Party Data
Implementing HDYHAU Surveys
Aggregate data proves traffic increased, but linking that traffic to revenue requires asking the customer directly. While the vast majority of marketing teams run awareness campaigns, only about half can definitively tie those efforts back to final sales. Adding a "How Did You Hear About Us?" (HDYHAU) survey to your highest-converting forms bridges this measurement gap.
Consider adding this field to your demo request, signup, or checkout page. You can make it optional, use a bounded format (e.g., multiple choice with an "Other" option), or offer free text when necessary—but if you collect free-text responses, clearly instruct users not to submit personal data beyond what is necessary for attribution purposes. Before storing responses, specify the purpose (marketing attribution), establish a lawful basis under GDPR Article 6, define who can access the data, set a retention period, and implement appropriate access controls. GDPR Articles 5(1)(b) (purpose limitation) and 5(1)(c) (data minimisation) require that you collect only the data needed for the stated purpose and avoid unrestricted free-text fields that invite unnecessary personal information.
Dropdown menus can simplify analysis but may force respondents into categories that don't reflect their journey (e.g., a customer selecting "Social Media" when they actually heard about you from a manager who listened to a podcast). Bounded free-text or multiple-choice-with-other options can balance nuance and privacy.
Review responses regularly and categorize them, mapping self-reported attribution back to traffic spikes in your analytics dashboard. If direct traffic spiked by 20% in March and fifty new customers mention the London trade show during the same period, you have a correlation—but not necessarily closed-loop causation. Use the Swetrix ROI calculator to estimate monetary value based on self-reported conversions, keeping in mind that self-reports are directional signals rather than precise attribution.
Analyzing Aggregate Visitor Engagement
New visitors arriving from a brand awareness campaign behave differently than returning customers. When an educational landing page receives a sudden influx of traffic, identifying whether the messaging resonated or if visitors immediately closed the tab dictates your next optimization steps.
Open your Swetrix dashboard and filter for new visitors to review aggregate time on page and bounce rate for the specific URLs promoted during your campaign. These metrics provide estimated signals of engagement, not definitive proof of attention, traffic quality, or campaign success.
For example, if time on page exceeds two minutes but conversions remain low, this is a hypothesis to investigate—it could suggest the content held interest but the call to action needs strengthening, or it could reflect tab-switching, slow page loads, or other factors. Similarly, a 95% bounce rate with under-ten-second dwell time might indicate ad-message mismatch or unqualified clicks, but could also result from technical issues (slow scripts, rendering errors), poor mobile experience, incorrect tracking, or users finding what they needed quickly. Before concluding that creative set the wrong expectation, also examine scroll depth, CTA clicks, conversions by segment, traffic source quality, page speed metrics, JavaScript errors, and targeting parameters. Combine multiple signals to form a more complete picture rather than relying on engagement metrics alone.
Filtering this aggregate engagement by geography isolates local initiatives. For a localized billboard campaign in Chicago, set your dashboard filter to show only traffic from Illinois. Comparing these localized engagement metrics against your national averages reveals whether the offline brand push generated higher-quality regional traffic.
Best Tools to Measure Brand Awareness Online
Swetrix: The Privacy-First Analytics Choice
Legacy tools force a trade-off between user privacy and data accuracy, a compromise Swetrix eliminates. We built our platform as an open-source Google Analytics alternative and host the cloud version strictly within the EU.
Because our tracking script never accesses local storage or places a cookie on the user's device, you capture the entire top-of-funnel traffic baseline without prompting a consent banner. Total visibility remains crucial for measuring brand growth. Spending ten thousand dollars on a newsletter sponsorship requires absolute certainty that the analytics platform will record the resulting traffic surge.
Swetrix Cloud pricing starts at $19 per month for 100,000 events, scaling as traffic grows. Enterprise teams with strict data residency requirements can self-host Swetrix on custom infrastructure to maintain total control over traffic logs. The platform includes integrated performance monitoring to ensure your website loads fast enough to handle the sudden volume spikes generated by successful campaigns.
When running paid campaigns alongside organic brand building, use our UTM generator to tag every link correctly. The platform automatically organizes this tagged traffic in your dashboard, keeping paid performance data strictly separated from your direct traffic baselines.
Supplementary SEO and Survey Tools
Brand measurement works best as a layered system, since no single tool captures the entire customer journey from initial impression to final purchase. Building a comprehensive software stack targets different stages of brand recall.
Deploy Swetrix as a foundational traffic monitor to catch real-time spikes in direct visits and dark social sharing. Next, add Google Search Console to track unaided search recall and monitor query volumes for your brand name. Finally, integrate a form builder like Tally or Typeform to collect zero-party attribution data at the point of conversion.
Combining aggregate website behavior, search impressions, and customer self-reporting builds a complete picture of your brand's reach. This layered approach frees you from flawed, cookie-dependent multi-touch attribution, allowing you to measure the tangible impact of your marketing efforts.
Ready to capture your traffic baseline without losing data to consent banners? Start your 14-day free trial of Swetrix today and get comprehensive visibility into your next brand campaign. A valid payment method is required; your selected paid plan will be charged after 14 days unless you cancel the trial.