- Date
How To Analyze Website Conversion Funnels For Maximum Sales
 Andrii Romasiun
Visitors land on your homepage, click a product, and vanish. Building a profitable website requires identifying where users abandon the journey. Learn how to analyze website conversion funnels to spot hidden drop-offs, fix cart abandonment, and boost sales using privacy-focused analytics like Swetrix.
Understanding Conversion Funnels and Industry Benchmarks
Defining the Website Conversion Funnel
Track the path visitors take from first click to final purchase. A standard ecommerce flow moves from homepage visit to product view, add to cart, checkout initiation, and payment completion. Track this sequence to highlight specific friction points across your domain.
If 1,000 users view a product but 10 add it to their cart, redesign the product page. Analyze this funnel to stop guessing what to fix. Funnel stages differ based on business models, but the core progression remains consistent.
| Funnel Stage | Ecommerce User Action | B2B SaaS User Action |
|---|---|---|
| Top (Awareness) | Views an organic blog post | Clicks a LinkedIn ad |
| Middle (Consideration) | Views the product category page | Reads the features page |
| Bottom (Intent) | Adds an item to the shopping cart | Starts the free trial sign-up |
| Conversion (Action) | Completes the credit card payment | Upgrades to a paid annual plan |
Assign a measurable action to each step to turn abstract visitor behavior into hard numbers.
Knowing Your Real Industry Averages
Compare your metrics against relevant competitors instead of comparing performance to global cross-industry aggregates. B2B ecommerce stores average a 1.8% conversion rate. B2C ecommerce stores achieve 2.1%. Set expectations based on specific industry context.
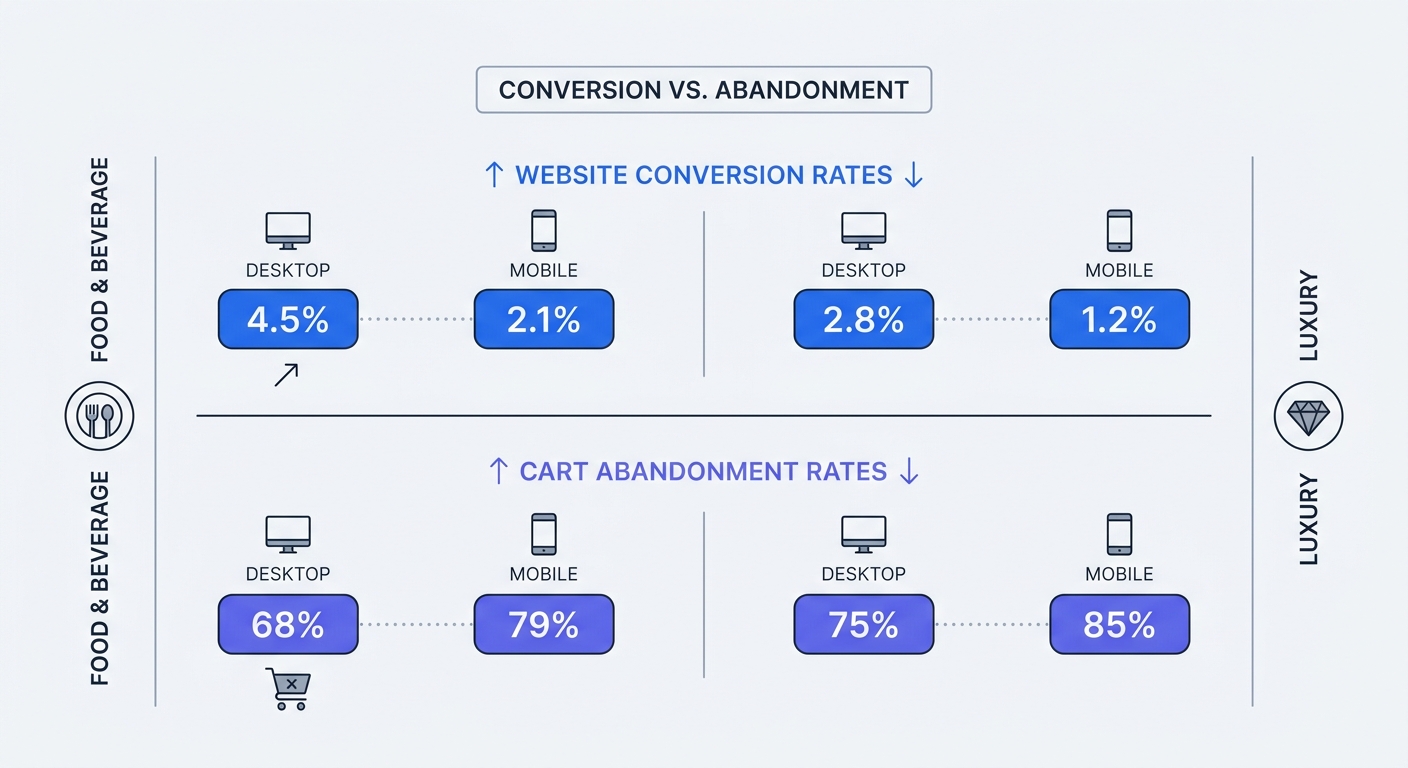
Businesses in the Food & Beverage retail sector achieve 5.83% conversion rates. Luxury and Jewelry retailers see 0.87%. Buyers need more consideration time for high-ticket items, which drags down the aggregate session conversion metric.
Measure success using complete data. You lose massive amounts of traffic data through standard analytics tools before users enter the funnel. Bypass cookie rejections and capture complete visitor pathways using cookieless tracking provided by Swetrix. Unlike legacy platforms, Swetrix ensures your funnel data is accurate from the very first touchpoint without relying on intrusive tracking methods.
The Failure of Traditional Funnel Tracking
The Cookie Banner Blind Spot
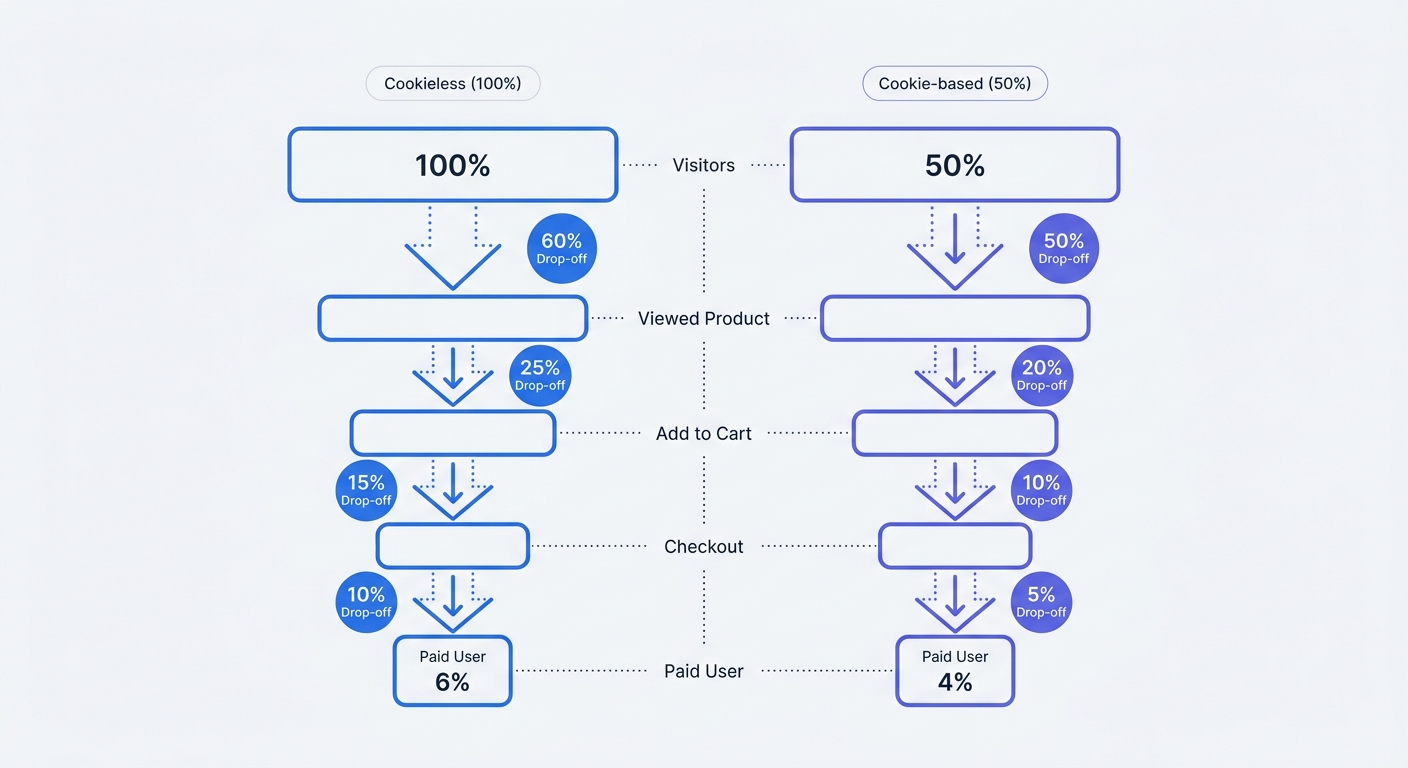
Marketers using legacy tools like Google Analytics rely on client-side cookies to track users across steps. European and Californian website owners must display explicit consent banners to comply with GDPR and CCPA. When visitors click "Decline," they disappear from your reports.
Combine this rejection rate with global ad-blocker usage at 29.5%—a figure that ranges from 15% for general lifestyle readers to over 40% for tech-savvy audiences—and you will miss half of your traffic using traditional setups. A user clicks an Instagram ad and lands on the product page. Users encounter a massive banner and click "Reject All" to clear the view. They browse, add items to the cart, and purchase. Marketing analysts see a direct traffic purchase in the cookie-based platform without preceding pageviews.
Analysts corrupt their data by assigning zero credit to the social media campaign. Marketing teams might view a report showing 500 checkout drop-offs that represents 1,000 real users. Teams misallocate budgets and pause profitable campaigns based on this fragmented data.
The Rise of Cookieless Analytics
Comply with modern privacy regulations by shifting your tracking architecture. Implement cookieless analytics tools to capture complete user flow data without requiring consent banners. Swetrix solves the attribution gap by removing client-side storage from the equation, offering a privacy-first alternative to Google Analytics or Plausible.
Swetrix hashes the visitor IP address, the user agent, and a daily rotating salt to create a temporary session identifier. The salt changes at midnight to return the user string to an anonymous state. This data is processed in a fully EU-hosted cloud without storing personal data, ensuring 100% GDPR compliance.
Remove the cookie banner to eliminate a major friction point. Visitors access your content faster, causing instant bounce rates to drop. With Swetrix, you maintain intact funnel data and can view exactly where users click in real-time.
Step-by-Step: How to Analyze Website Conversion Funnels
Segmenting by Device and Traffic Source
You obscure massive performance gaps by blending mobile and desktop data. Segment users by device to spot differences. Mobile users account for most ecommerce visits but convert at 2.77%, while desktop users reach a 3.9% average.
Mobile users abandon carts at an 80.2% rate, outpacing the 70% average for desktop users. Desktop users conduct research and utilize multi-tab comparisons. Mobile users browse on the go and abandon carts when forms demand excessive typing.
Direct visitors convert at a 3.3% rate. Users clicking from social media bounce at the top of the funnel. Treat each device and source combination as a distinct user journey. Using the Swetrix dashboard, you can create isolated funnel reports for "Mobile Instagram Visitors" and compare them against "Desktop Organic Search Visitors" with just a few clicks.
Setting Up Micro-Conversion Tracking
Stop measuring the gap between homepage visits and purchases to avoid skipping actionable middle steps. Configure custom events in Swetrix to monitor micro-conversions. Fire an event when a user clicks a product image. Trigger another upon opening the sizing chart, and track the add-to-cart button click.
Set up the tracking script to pass custom event names into your dashboard. Add this JavaScript snippet to your critical buttons:
swetrix.track({
  ev: "add_to_cart",
  meta: {
    product_category: "shoes",
    price: "89.99",
  },
});
Group these micro-conversions into a sequential report to spot exact pages where visitor momentum stalls. If users click the sizing chart but never click add to cart, rewrite the sizing information to provide clarity. Swetrix makes it easy to visualize these custom events in a real-time stream, allowing you to react to user behavior instantly.
Identifying Cart Abandonment Leaks
Users abandon carts at a global average rate of 70.19%, though this varies widely from around 54% in pet care to over 82% for luxury items. Isolate the checkout sequence in your analytics tool to find the specific form field causing the exit. Map the steps from cart view to shipping calculation, payment entry, and confirmation.
Run a checkout audit using a standard 4G mobile connection. Follow this checklist to locate friction:
- Count the mandatory form fields.
- Check for unexpected shipping taxes.
- Test the promo code input visibility.
- Verify the loading speed between the cart and payment page.
Buyers leave when encountering unexpected delivery costs. Move shipping estimates higher in the funnel and display the delivery cost on the product page to prevent late-stage abandonment.

Fixing Technical and UX Friction in Your Funnel
The Impact of Page Speed on Drop-offs
You create funnel leaks through poor server infrastructure. Visitors lose momentum on slow pages before viewing your behavioral design elements. E-commerce buyers abandon sites, dropping conversion rates by 7% for every 100-millisecond delay in page load time.
Implement Real User Monitoring (RUM) through Swetrix to measure performance and track errors across different geographic regions. Check Time to First Byte and render times on your highest-abandonment pages. Optimize heavy product images and minimize third-party JavaScript payloads on the checkout page to keep the transaction moving.
Monitor Core Web Vitals via the Swetrix dashboard to catch layout shifts. If a user tries to tap the checkout button and a late-loading image pushes the element down, the user clicks the wrong link. The visitor experiences frustration and leaves the site.
Eliminating Checkout UX Barriers
Shoppers lose purchase intent during complex payment flows. Fix checkout usability issues to recover up to 35.26% of lost conversions. Force users to create an account, and they will leave. Implement guest checkout as the default option.
Users seeing a visible, empty promo code box return to search engines to hunt for coupons. They lose focus and abandon the cart. Hide the promo code box behind a toggle switch to keep the interface clean.
Increase the probability of a completed sale by removing form fields. Ask for the shipping address, display the total, and offer a one-click payment method.
Analyzing AI and High-Intent Traffic
Capitalizing on AI-Referred Visitors
Acquire a new category of traffic from generative search engines and language models. Content publishers have seen a rapid increase in AI-referred traffic as more users turn to generative search tools to find products and information. These users arrive with specific answers in mind and exhibit high purchase intent.
Track AI search referrers using Swetrix campaign and UTM tracking to isolate this cohort. Append ?utm_source=chatgpt&utm_medium=referral to the links you feed into custom AI models or brand awareness campaigns. Treat these visitors like mature paid search traffic. Route them to high-converting landing pages instead of top-of-funnel blog posts.
AI-Assisted Conversion Analysis
Product teams use machine learning models to synthesize massive volumes of funnel data. Connect your Swetrix data export to an analysis tool to cluster user drop-off behaviors. Data analysts use AI to identify patterns humans miss, grouping sessions by device, load speed, and exit page.
Armed with these insights, growth teams run more targeted A/B experiments per quarter. Test different checkout layouts based on the data clusters. Monitor the conversion metric in real time to validate your changes. Update your site based on anonymized data instead of guessing what users want.
Build better funnels with complete data. You lose half your traffic to cookie blockers and consent banners using traditional tools. Capture every step of the user journey without intrusive pop-ups using Swetrix's privacy-focused, open-source analytics. Track custom events, monitor page speed, and measure real conversion rates. Plans start at $19/mo for 100,000 events. Start your 14-day free trial today.