- Date
How to Analyze User Flow on Website for Conversions
 Andrii Romasiun
Visitors land on your pricing page, click the signup button, and vanish before completing step two of the conversion funnel. Traditional analytics platforms point to user disinterest, yet the tracking tools cause the reporting failure. Analyzing user flow on a website using legacy software yields incomplete data and incorrect UI changes. Prioritize the measurement foundation. Map the exact routes users take and capture complete analytics data without violating GDPR.
Privacy-focused platforms like Swetrix provide complete visibility without tracking cookies. Adjust your tracking strategy to capture missing traffic before redesigning a checkout page.
Reasons Your User Flow Data Is Missing
The Consent Data Gap
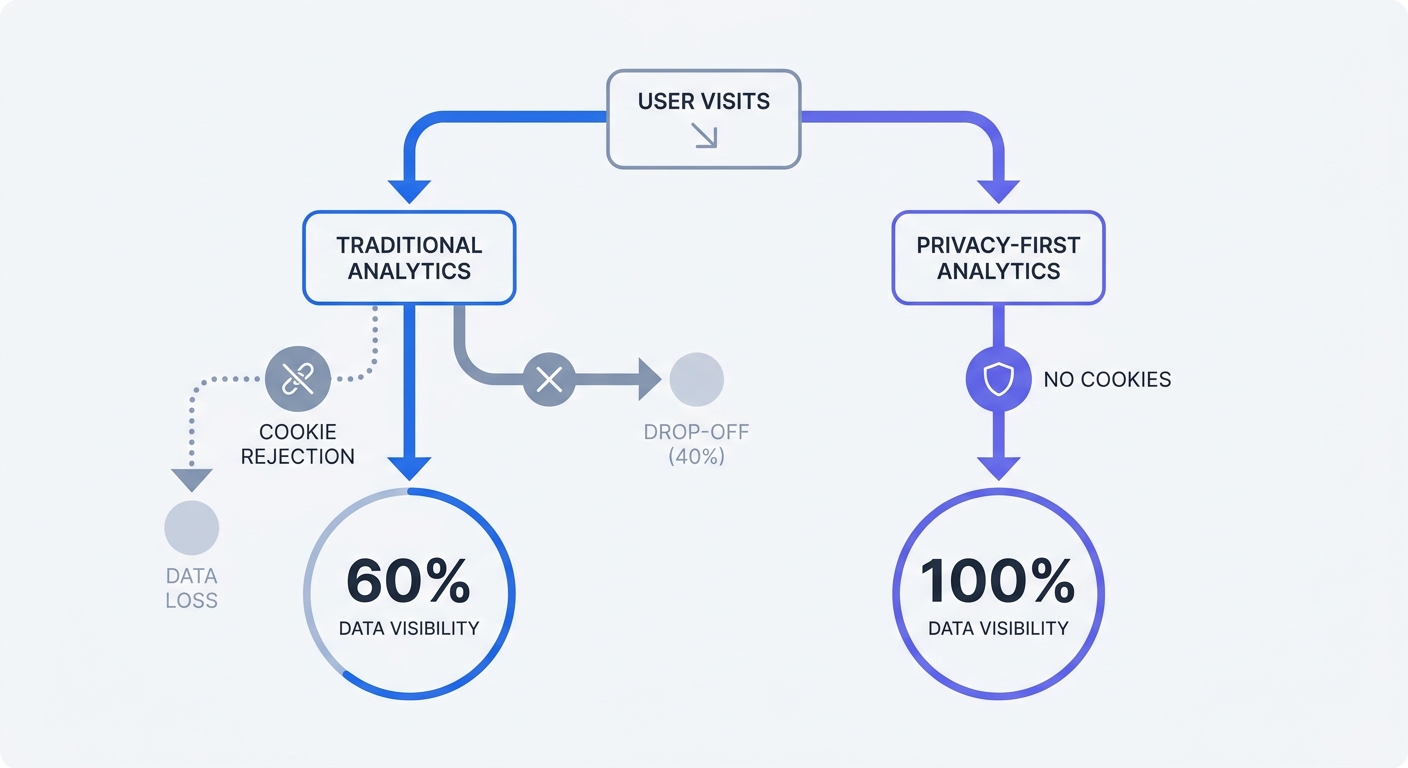
Cookie consent banners break user flow analysis. Traditional platforms like Google Analytics drop the session data when a visitor declines tracking cookies. This creates a consent data gap that blinds your marketing team to the customer journey.
User preferences and browser protections compound this tracking problem. With over 40 percent of global internet users employing ad blockers—alongside default tracker blocking in Safari and Firefox—you lose visibility into a massive chunk of your traffic if your analytics software relies on persistent cookies to connect a pageview to a checkout event.
This tracking blind spot harms revenue. A 6sense Buyer Experience Report reveals that B2B buyers purchase from the first vendor they contact in 84 percent of cases. Marketing teams need full data capture to identify and repair hidden drop-off points.
Privacy-first web analytics platforms restore this lost visibility. Tools like Swetrix measure traffic through aggregate data and short-lived session identifiers. The system hashes an anonymized IP address and user agent to map sessions for 24 hours. Because the software stores no personal information and sets no tracking cookies, your team tracks conversion funnels while remaining GDPR-compliant. Remove the consent banner and regain the missing data.
Mapping the Chaos Path
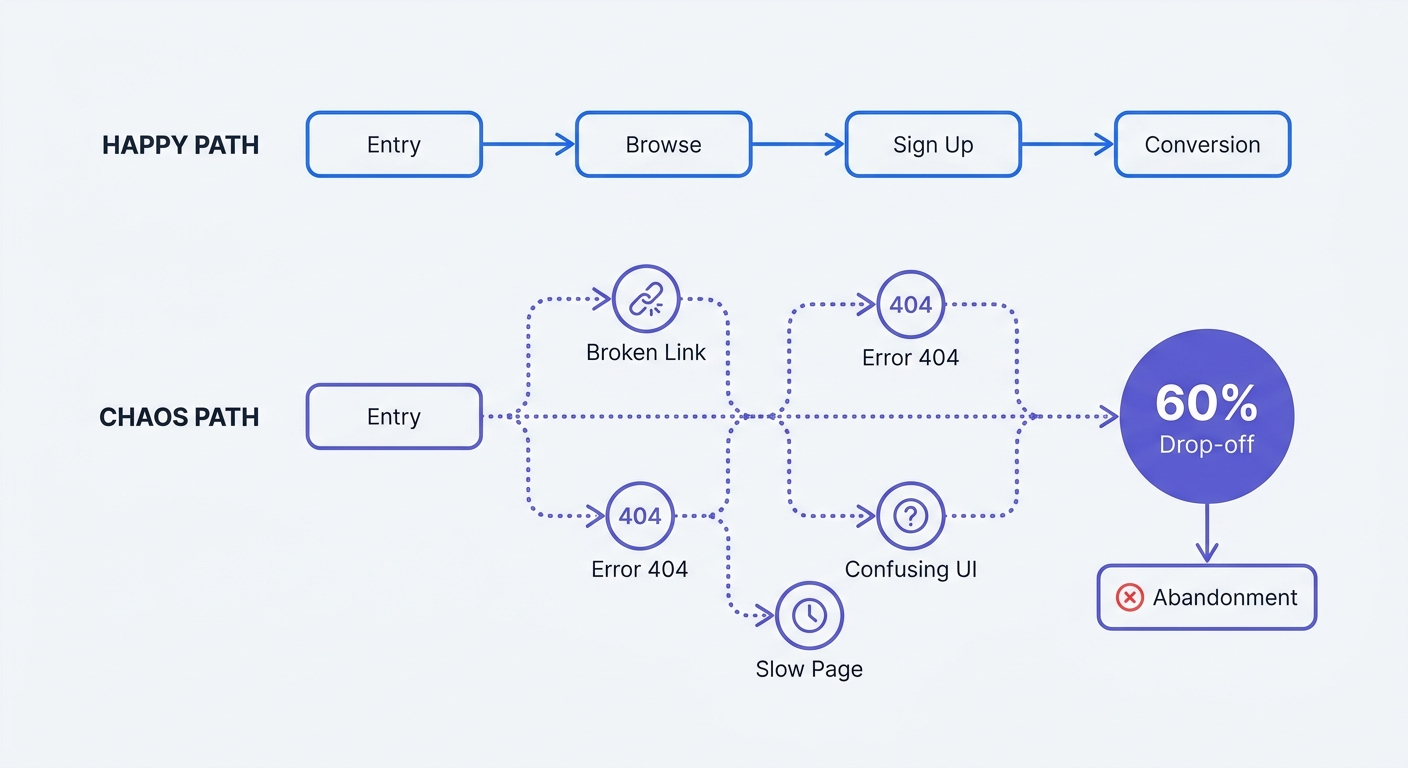
Product teams design the "Happy Path" assuming visitors land on the homepage, click the product, add items to the cart, and pay. Real visitors deviate from this perfect sequence.
Modern conversion optimization requires mapping the "Chaos Path." Visitors click incorrect buttons, trigger validation errors, open multiple tabs, and face empty states. Analysts trace these erratic movements to locate hidden friction.
Configure your analytics to log edge-case interactions to capture this chaos path. Track form validation errors as custom events. Monitor 404 page hits and record clicks on disabled buttons. Charting these friction points alongside standard pageviews reveals the exact elements driving high exit rates on specific pages.
Core Metrics for User Flow Analysis
Moving Beyond the Bounce Rate
Industry standards for measurement require updated approaches. The cross-industry average bounce rate sits at 50.9 percent—though industry averages range from roughly 40 to over 60 percent—and B2B SaaS pages typically experience higher rates than media websites. Most visitors view fewer than three pages per session. A high bounce rate does not guarantee a failing page, as a visitor might find the needed answer in ten seconds and leave satisfied.
Replace bounce rate with Engagement Rate in your primary reports. Engagement metrics track meaningful interaction rather than raw page loads. Active engagement includes staying on a page for ten seconds, scrolling past the midpoint, or clicking secondary content like an accordion FAQ.
Audit your analytics dashboard to prioritize these active metrics. Create a segment for users who trigger an engagement event but fail to convert. This cohort represents your highest-intent missed opportunities. Target this group for funnel analysis to uncover the exact page element blocking their progress.
Measuring Cognitive Load
Click-through rates record the user's destination while masking the mental effort needed to complete the journey. High cognitive load destroys conversions, surpassing the impact of high pricing. Track qualitative behavioral metrics to pinpoint the friction.
Hesitation time measures the seconds a user spends hovering over a call-to-action before clicking. Extended hesitation time indicates confusing copy or anxiety about the next step. Rage clicks track rapid consecutive taps on a single element. Users trigger rage clicks when a button fails to load, a static element resembles a link, or a form submission stalls.
Track rage clicks by implementing a custom event listener. Add this JavaScript snippet to your site to send a custom event to Swetrix when a user clicks an element three times in one second:
let clickCount = 0;
let clickTimer;

document.addEventListener("click", function (event) {
  clickCount++;

  if (clickCount === 1) {
    clickTimer = setTimeout(function () {
      clickCount = 0;
    }, 1000);
  } else if (clickCount >= 3) {
    swetrix.track({
      ev: "rage_click",
      meta: {
        element: event.target.tagName,
        class: event.target.className,
      },
    });
    clickCount = 0;
    clearTimeout(clickTimer);
  }
});
Deploy this script and check your custom events report. The metadata reveals the exact HTML elements frustrating your users. Redesign those components to clear the bottleneck and smooth the user journey.
The 4-Step Framework for Analyzing Flows
Map and Prune the Journey
Visualizing the current state exposes redundant steps. Outline your core conversion flows on a digital whiteboard before examining the metrics.
- List the entry points (e.g., organic search, paid ads, email campaigns).
- Chart the required pages to reach the conversion.
- Identify the paths where a user exits the primary goal.
- Mark the mandatory form fields and technical requirements at each stage.
Compare this manual map against your analytics data. Identify paths with zero traffic and find required steps serving internal company needs rather than user needs. Prune the journey by removing extra flow steps. If step three in a SaaS onboarding sequence asks for a company size but provides zero immediate value to the user, delete the step. Removing unneeded form fields produces higher completion rates.
Measure and Generate UI Changes
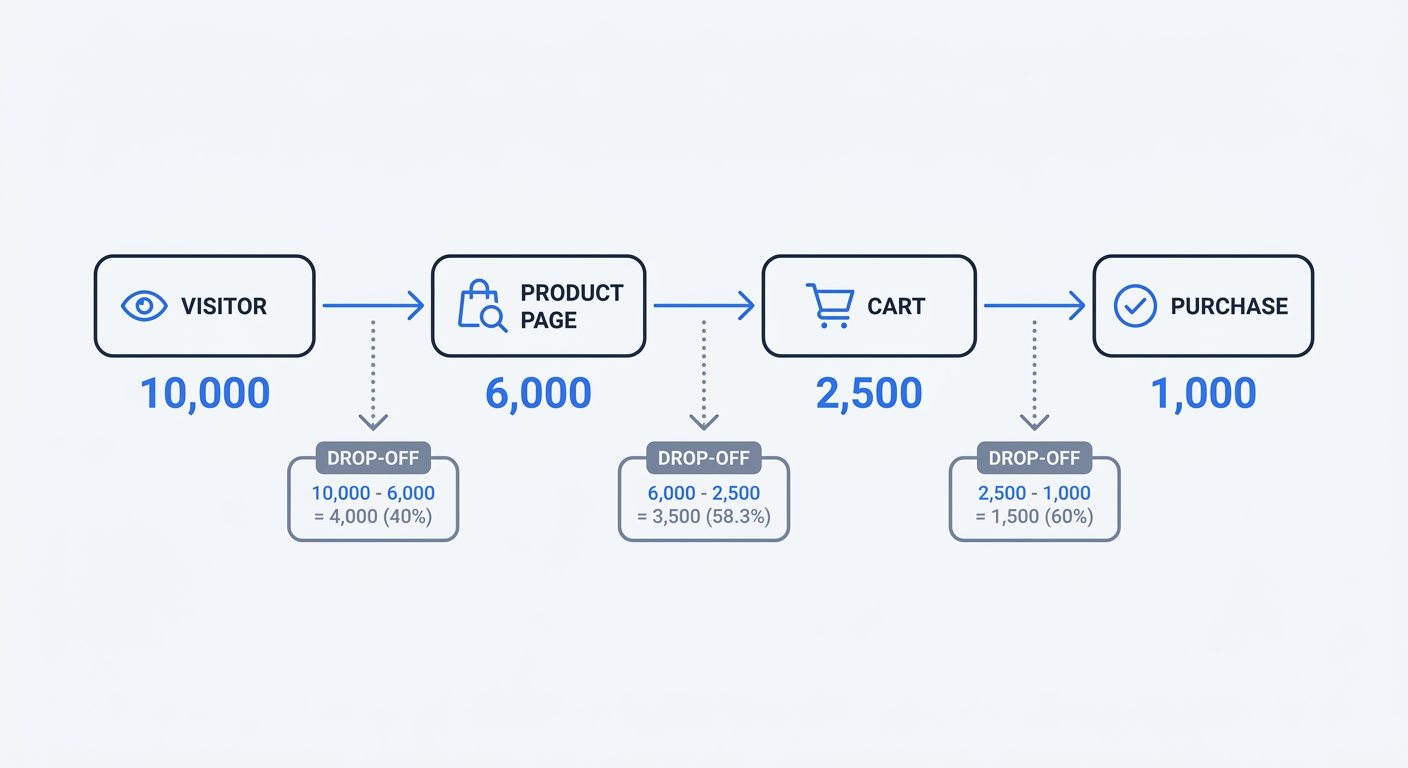
Quantify the friction at each remaining step using funnel drop-off calculations. Map your multi-step funnels in your analytics platform and apply the standard drop-off formula to find the most severe point of failure.
Funnel Drop-off Formula: [(Users at Step A – Users at Step B) / Users at Step A] × 100
Run this calculation on a standard e-commerce flow. Step A (Product Page) receives 10,000 users. Step B (Cart) receives 4,000 users. [(10,000 - 4,000) / 10,000] x 100 = 60 percent drop-off.
Repeat the calculation for the next stage. Step B (Cart) has 4,000 users, and Step C (Checkout) has 3,200 users. [(4,000 - 3,200) / 4,000] x 100 = 20 percent drop-off.
Determine your next action based on this calculation. The 60 percent drop-off at the cart addition stage demands immediate attention. Generate UI changes tailored to this failure point.
Modify the UI based on user intent if users abandon the product page. Add sticky add-to-cart buttons for mobile users. Move shipping cost estimates to the top of the page to reduce price shock. Run an A/B test on these changes. Use a conversion funnel analysis tool to track variant performance and confirm you resolved the friction.
Choosing the Right User Flow Tools
Swetrix: Privacy-First Full Visibility
Capturing actionable user flow data requires a tool that respects browser privacy protections. Swetrix operates as an open-source, privacy-first web analytics platform. The software provides built-in user flow mapping, custom event tracking, and funnel analysis without relying on third-party cookies.
By utilizing session-based hashing, Swetrix logs visitor paths from entry to conversion. Track the full journey without triggering a GDPR consent banner or losing data to ad blockers.
Beyond standard pageviews, the platform monitors technical friction points that break user flows. The built-in error tracking feature logs frontend JavaScript errors and API failures. If a broken script prevents mobile users from submitting a signup form, Swetrix records the exact error, the browser, and the OS. Hand this diagnostic data to your developers to fix the leak.
Swetrix Cloud pricing starts at $19 per month for 100,000 events. The open-source architecture allows companies with strict compliance requirements to self-host the software on their own infrastructure.
Traditional Analytics Alternatives
Enterprise product teams rely on legacy session analytics tools like Mixpanel, UXCam, or Contentsquare. These platforms offer granular event tracking and heatmaps. Their core flaw lies in their tracking methodology.
Traditional platforms rely on persistent cookies and device fingerprinting to stitch sessions together. Under the ePrivacy Directive, running these scripts requires user consent. The tool goes blind when users decline tracking.
| Feature | Swetrix | Legacy Analytics |
|---|---|---|
| Tracking Method | Cookieless Session Hashing | Persistent Cookies |
| Data Loss via Adblockers | Minimal | High (up to 40 percent) |
| GDPR Compliant by Default | Yes | Requires Consent Banner |
| Infrastructure | Open-Source / Self-Hostable | Closed-Source SaaS |
| Performance Impact | Lightweight Script (< 5KB) | Heavy Script (> 30KB) |
Relying on legacy tools forces a choice between breaking privacy laws or analyzing incomplete data. Privacy-first tools resolve this conflict. Install a tracker designed for modern browser constraints to regain visibility into your conversion paths.
Stop guessing why users abandon your website. Map your funnels, track the edge cases, and capture complete conversion data without violating user privacy. Start your 14-day free trial at Swetrix.com/signup to build a tracking foundation for a cookieless future.