- Date
HTTP 500 Error: Causes, Fixes, and SEO Impact
 Andrii Romasiun
An HTTP 500 Internal Server Error indicates that a server encountered an unexpected condition and could not fulfill a request. Because the status code is a generic flag, it confirms a failure happened somewhere in the server-side request path without offering details about the specific fault. Resolving an HTTP 500 response requires inspecting application and infrastructure logs to find the broken component. After you isolate and fix the root cause, privacy-first analytics from Swetrix can help you map the fallout to see exactly which user journeys, regions, and devices were affected.
What the HTTP 500 Status Code Means
A Generic Server-Side Failure Signal
The HTTP Semantics specification defines status 500 as an unexpected server condition that prevents a request from succeeding. The code is intentionally broad, so it provides no diagnosis beyond a server-side failure. The word "internal" does not point to a specific file or database. Instead, it means the failure originated on the host or application rather than the visitor's device.
The visible browser error page rarely contains enough detail to identify the failing layer, as the response might originate from a content delivery network, a reverse proxy, a web server, an application runtime, or the host operating system. Because the status code covers everything from a runtime crash to a syntax error in a configuration file, server and application logs usually provide the most useful source of detail.
One Failing Route Does Not Mean Sitewide Outage
A 500 response does not automatically mean your entire website is offline. The same infrastructure can return an error for one specific route, request method, or deployment version while the rest of the application continues working normally. For example, a visitor attempting a POST request to a checkout endpoint might see a failure while anonymous users reading your homepage experience no issues.
The visitor's internet connection, browser cache, or local hardware do not cause a server to generate this response. While a user can attempt to refresh the page, the underlying problem requires a server-side fix.
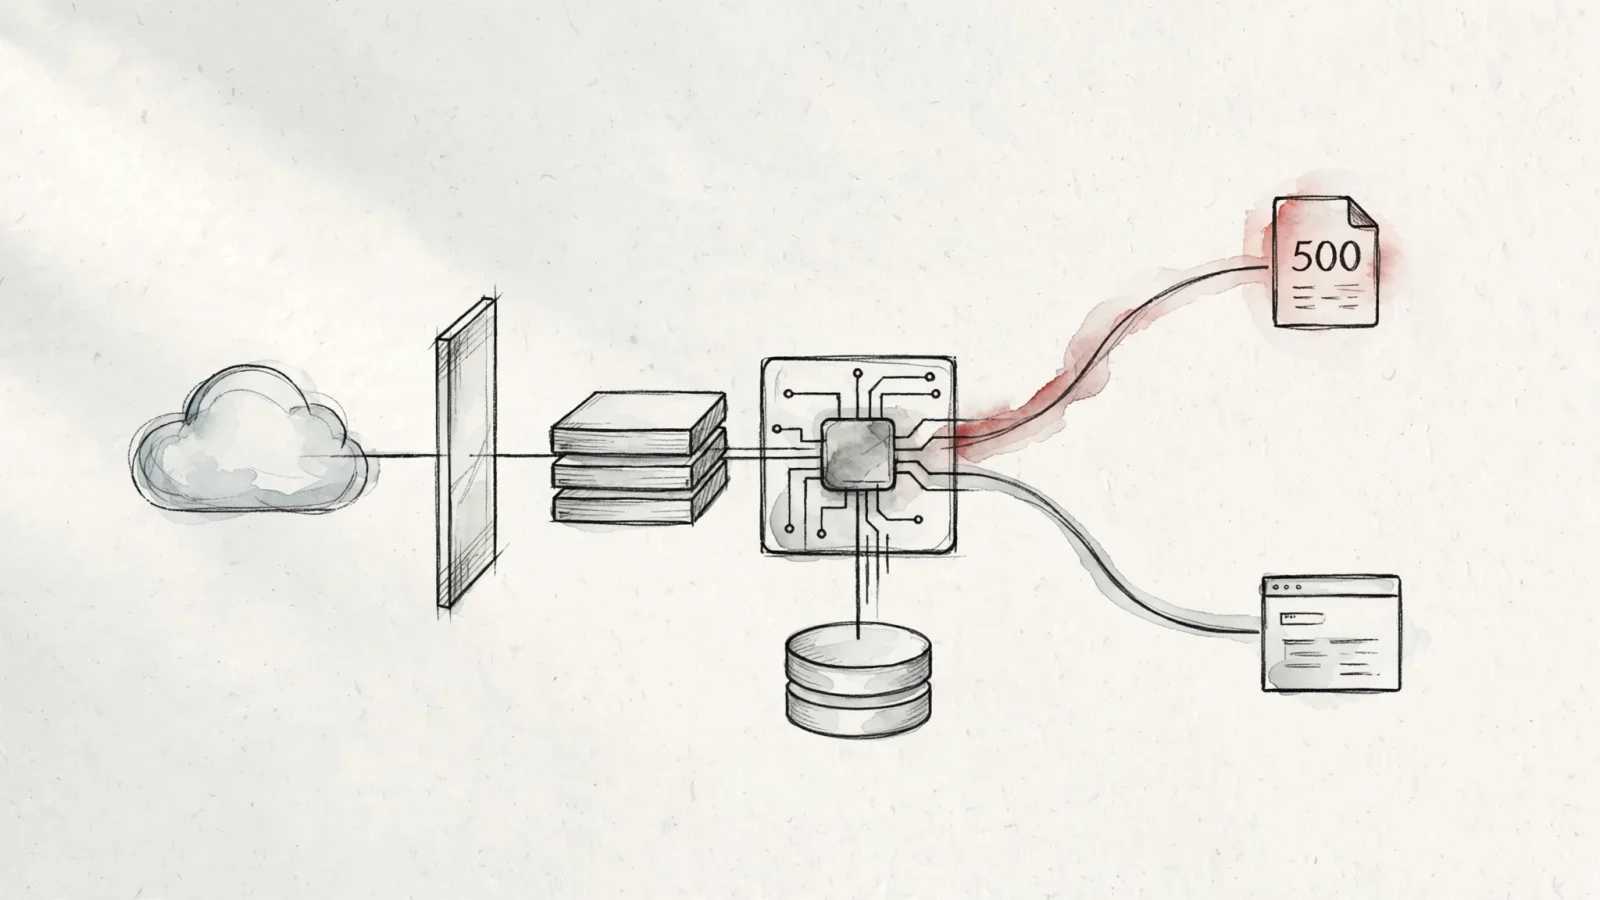
Common Causes of an HTTP 500 Error
Application and Runtime Failures
Unhandled exceptions and fatal runtime errors can trigger internal server errors. When code encounters a state it cannot process and lacks a designated error-handling mechanism, the application can abort the request. This can happen following a new deployment or a dependency upgrade. If the error begins right after a code change, you may find a stack trace in your application logs and match it to the latest release version.
Sometimes the original problem is minor, but a poorly configured error handler obscures it. For instance, if the application attempts to render a custom error page but fails due to a missing template, that secondary failure generates the 500 response. Inspect the earliest log entry for the given timestamp, which often helps identify the true source.
Configuration, Dependencies, and Resource Limits
Invalid server configuration can block requests before they reach your application code. Changing environment variables, rewrite rules, proxy settings, or .htaccess syntax can break a previously working route, so comparing the current configuration with the last known-good version helps isolate these regressions.
Dependency failures can also mimic internal application errors. If your software relies on a database, an in-memory cache, a message queue, or a third-party API, a timeout in any of those services can surface as a 500 or another 5xx response to the end user. Check the health of those dependencies by looking for connection-pool exhaustion, expired credentials, or external API timeouts in your logs.
When failures correlate with traffic spikes or large data queries, resource exhaustion becomes a leading suspect. Containers, host servers, and processes enforce limits on memory, disk space, and active connections. Hitting a hard memory limit can terminate the worker process or make the upstream unavailable, so the client may receive a generic 500, 502, or 503 response depending on which layer reports the failure.
Deployments, Permissions, and CMS Conflicts
Routine server operations can alter file ownership and read permissions. If a deployment script places new build artifacts on the server but assigns them to the wrong user group, the web server cannot read the files. The visitor may see a 403 or 500, depending on which layer reports the failure.
For platforms like WordPress, conflicts between plugins, themes, and custom code can trigger fatal backend errors. Activating a plugin that requires a newer PHP version or an extension that conflicts with an existing theme can break the frontend, the admin panel, or both.
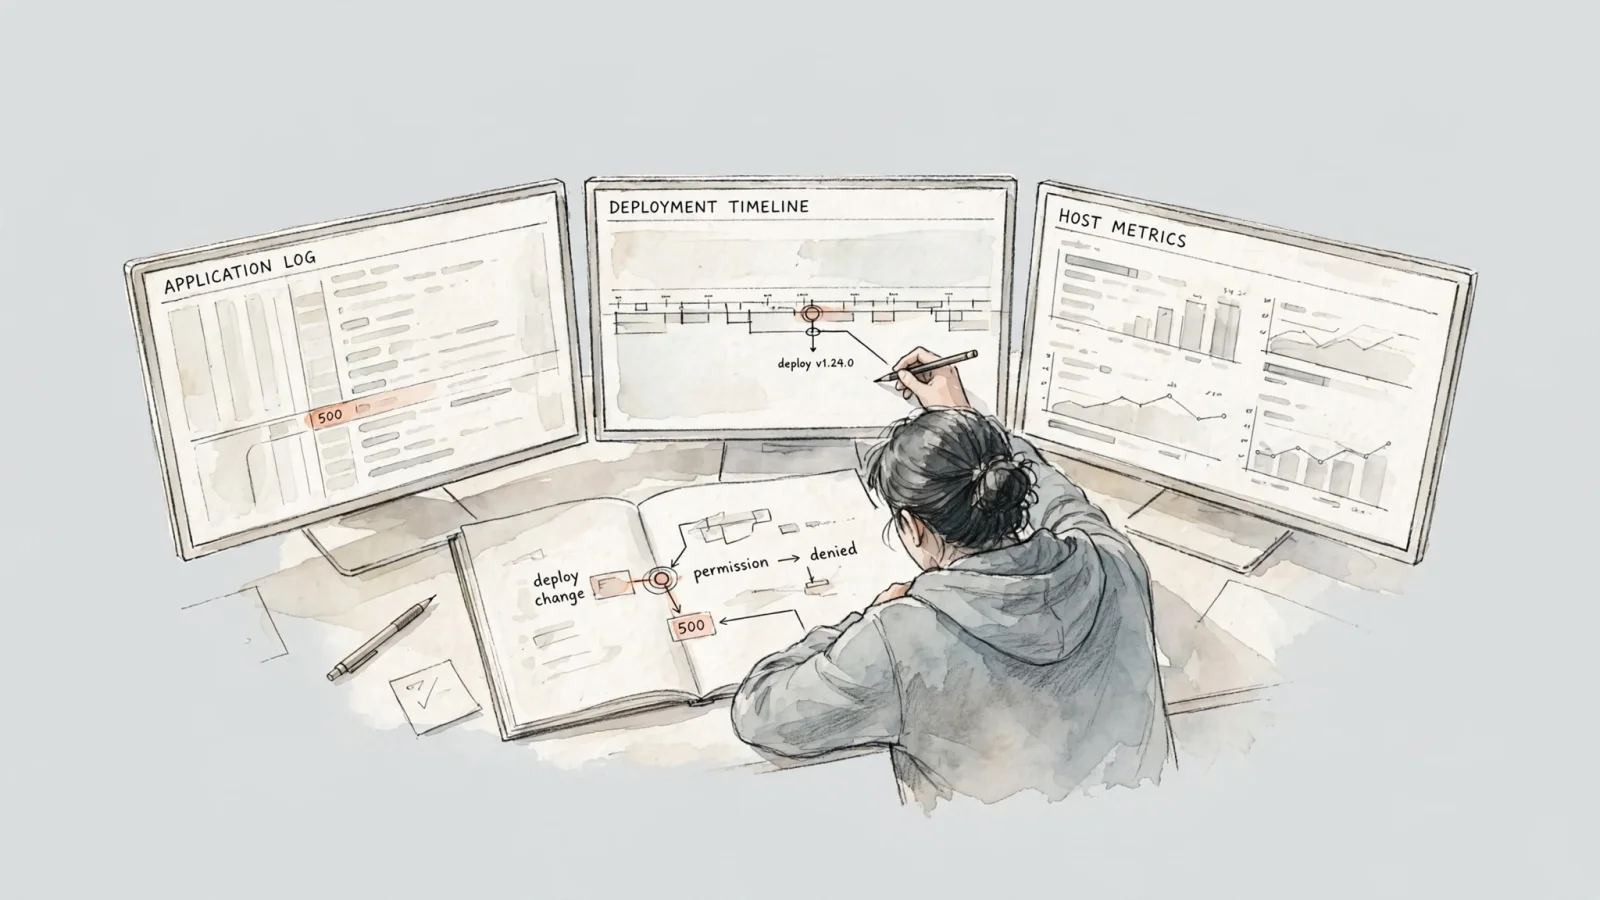
How to Troubleshoot and Fix the Root Cause
Confirm the Response and Its Scope
Avoid relying entirely on a browser window to diagnose the issue. Instead, use a command-line tool to make a clean request, such as a GET request for a page route, so you can inspect the raw headers and status code.
curl -sS -D - -o /dev/null https://example.com/problematic-page
Record the exact HTTP status, the response headers, the requested URL, and the HTTP method, noting the timestamp in UTC. Test whether the failure occurs for both anonymous and authenticated users, and check if the issue is limited to one route, a specific geographic region, or a particular device type. Gathering these boundaries prevents you from chasing a sitewide fix for an isolated endpoint. If you need a fast way to validate responses across multiple routes without manual terminal commands, an HTTP status bulk checker maps which specific URLs are failing.
Correlate the Timestamp With Logs
Start by reproducing the issue once. Repeatedly hammering a failing endpoint clutters your telemetry and makes the real error harder to find, so take the UTC timestamp of that test request and check your server infrastructure.
Look at your application logs, web-server access and error logs, database query logs, and host metric dashboards. Apache and Nginx typically separate access and error streams, so check the paths or log aggregation targets configured for the failing service.
To connect the visitor's experience to the backend failure safely, expose a sanitized request identifier in the public error response.
Request ID: 8e2c7d91
You can then search your backend systems for that exact string.
2026-09-05T14:21:08Z level=error request_id=8e2c7d91 route=/pricing release=2026.09.05
This pattern connects the client request to the server log without displaying stack traces, database connection strings, or personal data to the public.
Test, Mitigate, and Verify
Review the exact changes made immediately before the first failure appeared. Look for application deployments, environment-variable updates, database migrations, or content delivery network rule changes. If a code release clearly triggered the fault, a controlled rollback is often the fastest mitigation, allowing you to investigate the broken release in a staging environment.
If the issue involves web-server configuration, validate your syntax before reloading the service. For Nginx, running nginx -t checks configuration syntax and attempts to open referenced files safely. For Apache, check the active ErrorLog path in your virtual-host configuration, as the location varies heavily between hosting providers.
Once you deploy a fix, test the recovery across multiple contexts. Check the original URL, related API endpoints, and authenticated workflows to confirm that critical SEO landing pages load successfully and conversion actions process data correctly.
Fixing 500 Errors in WordPress
Isolate Plugins, Themes, and Custom Code
WordPress includes a Recovery Mode that can help administrators regain dashboard access when a fatal PHP error breaks the site. If a plugin update triggers a 500 error, Recovery Mode pauses the faulty component for your session so you can investigate safely.
If you cannot access Recovery Mode, manual isolation is the next step. Connect to your server via SFTP or SSH and rename the wp-content/plugins folder to wp-content/plugins_old to temporarily deactivate all extensions. If the site loads, rename the folder back to its original name and deactivate plugins one by one until the failure disappears. Apply the same logic to themes by temporarily switching to a default WordPress theme.
Debug PHP and WordPress Safely
To capture more detail about the PHP failure, enable WordPress debugging. Open your wp-config.php file and apply the following configuration to log diagnostics without exposing them to visitors.
define( 'WP_DEBUG', true );
define( 'WP_DEBUG_LOG', true );
define( 'WP_DEBUG_DISPLAY', false );
@ini_set( 'display_errors', 0 );
By default, this configuration writes errors to wp-content/debug.log. Reload the failing page once, then read the newly generated log file to find the fatal error line. Keep diagnostics in protected logs rather than displaying them to visitors, because public error output can expose sensitive server details. Disable debugging and delete the log file immediately after resolving the incident.
Check Hosting and Rewrite Configuration
If the WordPress debug log is empty, the request likely failed before PHP could execute it. Check your hosting provider's server-level error logs. A malformed .htaccess file can cause 500 errors on Apache servers. You can regenerate your permalink structures by navigating to Settings, selecting Permalinks, and saving the page without making changes. This asks WordPress to write a fresh set of rewrite rules to the filesystem. Many hosts use 755 for directories and 644 for files, but the correct values depend on your hosting and deployment model. Check ownership as well as mode bits, because an incorrect owner or group can block the web server from reading content.
Differences Between HTTP 500, 502, 503, and 504
What Each 5xx Status Means
The 5xx class of status codes covers multiple failure scenarios. Developers should return the code that most accurately describes the backend condition.
| Status | Meaning | Appropriate example |
|---|---|---|
| 500 Internal Server Error | The server encountered an unexpected condition while handling the request. | An unhandled code exception, a database query syntax error, or an invalid runtime state. |
| 502 Bad Gateway | A gateway or proxy received an invalid response from an upstream server. | A reverse proxy receives a malformed response from the backend application container. |
| 503 Service Unavailable | The server is temporarily unable to handle the request due to overload or maintenance. | Planned database maintenance or temporary capacity exhaustion during a traffic spike. |
| 504 Gateway Timeout | A gateway or proxy did not receive a timely response from an upstream server. | A third-party API dependency takes too long, causing the proxy timeout to expire. |
Return the Status That Fits
Precision matters for routing, monitoring, and search engine crawling. If an unexpected database failure prevents the application from completing a request, a 500 may be appropriate. If you are taking the application offline intentionally to upgrade a schema, returning 503 signals a temporary condition to clients and crawlers.
Never return a 200 OK status for an error page. Serving a successful status code alongside text that says "An error occurred" misleads monitoring tools into reporting total uptime, and Google Search may classify the response as a soft 404 that complicates your indexing and reporting metrics.

How an HTTP 500 Error Affects SEO
How Google Handles 5xx Responses
According to Google's guidance on HTTP status codes, Google Search treats 5xx responses as a signal to slow down crawling. The reduction depends in part on how many URLs return errors, and Google ignores content returned with a 5xx response.
A brief, isolated 500 error does not mean immediate deindexing. Google says that already indexed URLs are preserved initially, but URLs that persistently return server errors can eventually be removed from the index. Once your server returns 2xx responses again, Google gradually increases the crawl rate.
When to Use 503 for Downtime
Do not rely on an HTTP 500 response to cover planned downtime. If you need to take a service offline, configure your load balancer or web server to return 503 Service Unavailable.
Google treats 503 as a temporary server-error signal. Google says that returning `503` or `429` temporarily slows crawling, and already indexed URLs that persistently return server errors can eventually be dropped from the index. That is crawler-specific behavior, not a universal uptime rule, and the effect depends on whether the server errors persist and how many URLs return them. Use 503 for temporary service interruptions, but avoid using it indefinitely to mask an unresolved application failure.
Recover Crawling and Indexing
After fixing a persistent failure, follow a structured recovery checklist.
- Confirm that your key landing pages return a clean
200 OK. - Open Google Search Console and review the Crawl Stats report to ensure the 5xx spike has subsided.
- Use the URL Inspection tool to test your most critical routes live.
- Check your server logs to confirm
robots.txt, XML sitemaps, and critical CSS or JavaScript resources are no longer failing. - Request recrawling only after the underlying problem is completely resolved.
Monitoring 500 Errors With Swetrix
Add Context Beyond Server Logs
Server logs tell you why a request failed, while Swetrix helps you understand who experienced the failure, where it happened, and what they tried to do before the crash. Adding context by dimensions such as geographic region, operating system, device type, and browser version turns an abstract backend exception into measurable product impact. Swetrix tracks this context using a privacy-first approach that avoids invasive cookies.
If a 500 error prevents the initial HTML document from loading, the browser JavaScript never executes, which means client-side analytics alone will miss these document-level failures entirely. To capture them, instrument the error from your backend runtime.
Instrument Errors Without Leaking Data
The Swetrix Events API accepts server-side error reports. When your application catches an exception and generates a 500 response, it can securely fire a sanitized POST request to /log/error before closing the connection.
await fetch("https://api.swetrix.com/log/error", {
  method: "POST",
  headers: {
    "Content-Type": "application/json",
  },
  body: JSON.stringify({
    pid: process.env.SWETRIX_PROJECT_ID,
    pg: request.path,
    name: "http_500",
    message: "Server returned an internal error",
    meta: {
      route: request.path,
      release: process.env.RELEASE_ID,
      request_id: request.id,
      status: 500,
    },
  }),
});
For self-hosted Swetrix installations, point the request at the API endpoint exposed by your instance and ensure your fetch call does not block the original error response if the analytics request times out.
For single-page applications where the main document is already loaded, an API failure in the background can be reported directly from the frontend using trackError().
const response = await fetch("/api/signup", {
  method: "POST",
});

if (response.status === 500) {
  swetrix.trackError({
    name: "http_500",
    message: "Signup API returned an internal error",
    meta: {
      endpoint: "/api/signup",
      status: 500,
    },
  });
}
Because developers define these metadata payloads, enforce strict privacy guardrails. Never send passwords, access tokens, database connection strings, full request bodies, or unredacted user input to any analytics provider. Keep detailed stack traces confined to your protected backend server logs, sending only operational tags like the route, release version, environment, and request ID to Swetrix.
Alerts, Replays, and Next Steps
Configure notifications when an http_500 event spikes following a new deployment. Cloud users can explicitly activate session replays by calling startSessionReplay(), helping product teams review what a visitor did before a conversion failure. These replays are currently Cloud-exclusive and are not available on self-hosted instances.
For B2B teams and agencies, Swetrix supports embedding the dashboard directly into customer-facing admin panels. You can designate the Errors tab as a permitted view, granting your clients visibility into their specific product failures without exposing your wider infrastructure metrics.
Find the fault in your logs, apply the fix to your infrastructure, and let privacy-first analytics explain the fallout. Connect Swetrix to your web properties today to monitor your application errors, attribute conversion drops, and track your active users without relying on cookies or sacrificing product insights.