- Date
Embedded Analytics for SaaS: Privacy-First Dashboards
 Andrii Romasiun
Customers generate valuable data inside your SaaS application every day, and when they need to understand their performance, they want answers in the same interface where they work. Sending them to a separate business intelligence tool creates friction, while offering static CSV exports forces them to build their own reporting workflows. Those disconnected exports often lead to neglected spreadsheets and a lack of perceived product value.
Embedded analytics addresses this disconnected reporting problem. Microsoft defines that practice as placing customer-facing analytical content directly into applications, portals, or websites, so users experience the data as a built-in feature of your product. As Google Cloud outlines in its Looker documentation, this integration ranges from a single visualization to a complete dashboard or a data-exploration experience.
Analytics delivery remains entirely separate from data collection. You can pull metrics from browser events, backend databases, or product instrumentation, then deliver that data back to customers, turning internal metrics into a feature they are willing to pay for. For example, a marketing platform might show each user their campaign performance, while a multi-tenant website builder displays visitor trends for individual client sites.
Moving away from heavy, cookie-dependent tracking tools does not mean your customers lose growth insights. Swetrix bridges the gap between privacy-compliant tracking and advanced product analytics. You can provide an embeddable analytics layer that includes cookieless traffic measurement, funnel analysis, revenue metrics, technical error monitoring, and optional session replays.

What Should SaaS Teams Show Customers?
Exposing raw database tables rarely helps your users. An effective customer-facing dashboard answers a narrow set of questions that drive product value, and understanding the distinctions between analytics types helps you curate the right views.
| Capability | Main question | Typical user |
|---|---|---|
| Web analytics | Where did visitors come from and what pages did they view? | Marketer, blogger, agency |
| Product analytics | How do users behave inside the application? | Product manager, developer |
| Embedded analytics | How should analytics appear inside the product? | SaaS product team and end customer |
| Business intelligence | How should an organization combine multiple data sources? | Analyst, operations team |
These categories overlap in practice. Your engineering team can collect a mix of web and product events, process them through a single pipeline, and expose an approved subset to your users. When deciding what to include, start with the decisions your customers need to make.
Customer usage dashboards highlight active projects, feature adoption rates, and performance trends over time. Showing a customer that their team completed fifty tasks this week reinforces the value of their subscription. Alternatively, marketing and campaign reporting reveals referrers, UTM parameters, landing page success, and revenue attribution. You can also use onboarding funnels to track a user journey from initial signup through profile setup to the first moment of value.
Technical support views pair error monitoring with user journeys. If a customer reports a failure in your application, exposing the technical errors alongside their recent session steps helps their internal IT team understand what failed. For search visibility, SEO reporting combines search console impressions, average position, click-through rates, and top queries with referral traffic.
A well-designed embedded dashboard curates these metrics instead of dumping every available chart onto a single page. Consider whether the user needs to know which campaigns produce qualified leads, where their own customers abandon a checkout process, or which missing pages hurt conversions.
Different audiences require distinct insights. Developers prioritize data ownership and API access, while content creators rely on traffic and search visibility metrics. Multi-tenant B2B platforms require strict tenant separation, and agencies need shareable client dashboards for automated reporting. Swetrix supports these varied use cases by turning traffic reports, custom events, and performance metrics into modular components.
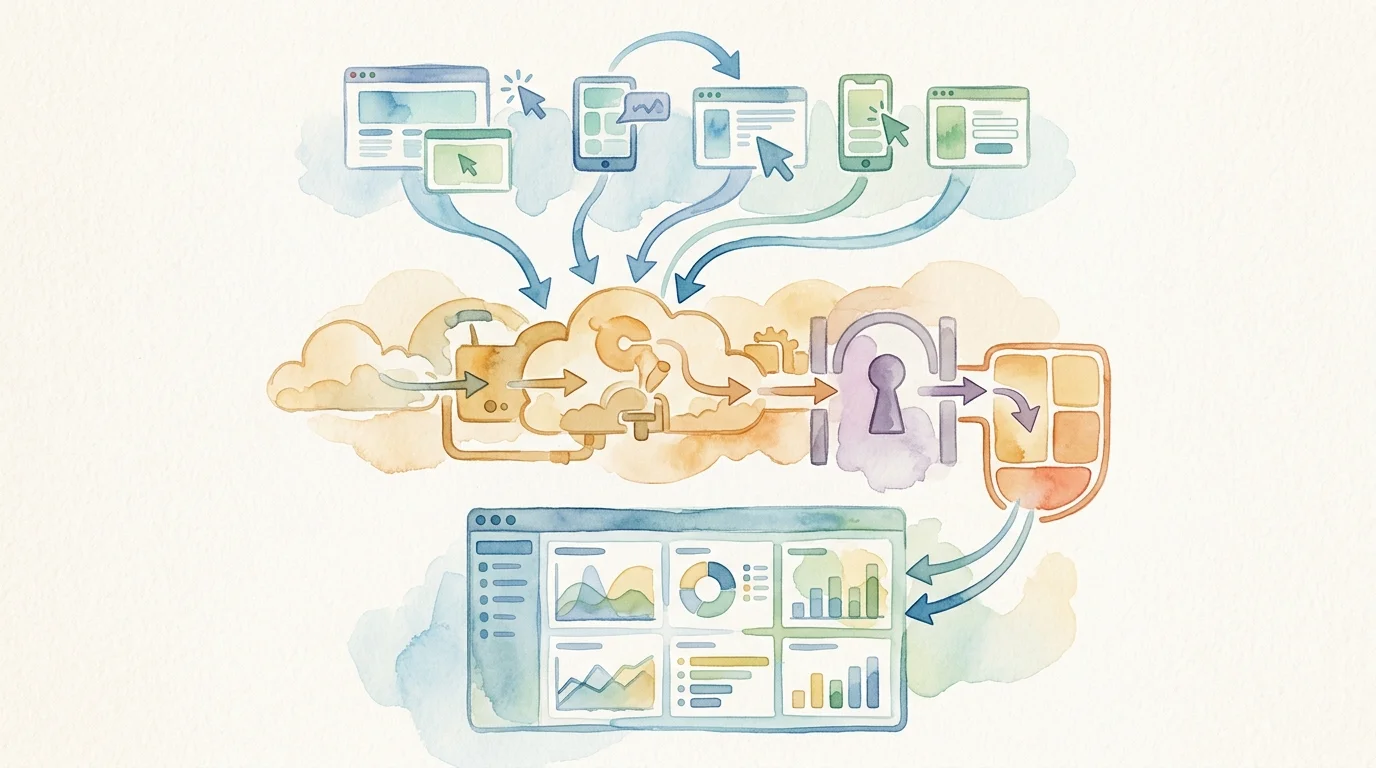
How Embedded Analytics Works in a SaaS Stack
Delivering insights back to your users requires a specific architecture. The workflow typically moves through four distinct stages: collection, analysis, authorization, and delivery.
Data collection happens in the browser or on the server, where your product tracks pageviews, custom events, error reports, revenue transactions, and experiment exposures. Use stable naming conventions for these events, so actions like workspace_created, report_exported, and subscription_started provide clear signals. Sending these events from your backend server rather than the client browser often improves reliability and prevents ad-blockers from dropping billing or conversion data.
The analysis layer aggregates raw inputs into usable metrics by compiling individual events into traffic reports, conversion goals, user journeys, and revenue views. While product analytics focuses on what users do, embedded analytics determines where those insights appear and who gets to view them.
Authorization represents the security boundary. The host application verifies the user's identity and determines their organization, workspace, or project scope. API keys facilitate the connection between your backend and the analytics provider, so these credentials belong in a backend service rather than browser code. Swetrix instructs users to treat API keys like passwords. Embedding an analytics view requires a trustworthy event taxonomy, sensible aggregation, strict tenant scoping, and an explicit authorization decision.
Delivery dictates the final customer experience, whether you render a complete dashboard, a few native KPI cards, or a hybrid interface inside your application. Swetrix reduces the infrastructure you have to build for this layer. It handles the ingestion of browser tracking, server-side inputs, and error monitoring, then provides the aggregated data through its Statistics API or dedicated iframe views.
Iframe, API, Hybrid, or In-House?
Your delivery mechanism determines how much engineering effort the project requires and how naturally the analytics blend into your surrounding product.
| Approach | Best for | Advantages | Trade-offs |
|---|---|---|---|
| Iframe dashboard | Admin panels, internal portals, client reporting | Fastest implementation; provides a complete reporting suite | Less control over layout, navigation, and native application behavior |
| API-driven widgets | Native-looking KPI cards and integrated workflows | Full control over UI, filters, and loading states | The SaaS team owns chart rendering, caching, and query orchestration |
| Hybrid | Teams needing a full dashboard plus a few native metrics | Balances rapid deployment with product polish | Requires two integration patterns |
| Fully custom | Products where analytics is the primary differentiator | Maximum control over the data model and user experience | The team owns aggregation, permissions, privacy controls, and maintenance |
Iframe embedding offers the fastest path to launch, working well for a dedicated customer portal or an administration panel. Swetrix includes documented iframe controls for light and dark themes, default tabs, allowed-tab lists, and an embedded mode that removes headers and marketing elements. You drop the component into a React, Vue, or plain HTML view, pass the correct parameters, and the dashboard functions immediately.
API-driven widgets fit products that require analytics woven into existing workflows. If your application displays a list of active campaigns, placing a small sparkline chart next to each row requires an API integration. You fetch the aggregated data from the analytics provider and render the visual yourself using a charting library like Chart.js or Recharts, which allows you to build custom skeleton loading screens and handle API timeouts gracefully.
A hybrid approach gives you a practical starting point. You embed a Swetrix iframe for a deep, dedicated analytics workspace, then use the Statistics API to power a few native summary cards on the user's home screen.
Building a fully custom analytics pipeline makes sense only if reporting acts as your core differentiator. Doing so requires maintaining a mature data warehouse, building semantic layers, managing database indexing, and optimizing query performance at scale. Choose an iframe for speed, an API for native control, a hybrid for balanced delivery, and an in-house build only when you plan to operate an enterprise data stack.
Secure Multi-Tenant Analytics
Serving analytics to multiple organizations from a single application requires strict logical separation. Tenant isolation happens on the server, so do not rely on hidden navigation items, client-side JavaScript filters, URL parameters, or browser-supplied customer IDs to secure reporting.
Your application uses the corresponding customer profile to generate an embed token before embedding the report, which ties the embedded content to that customer's data. Microsoft's multi-tenant architecture guidance then describes two approaches. For applications with relatively few customers and small to medium-sized semantic models, a single multitenant semantic model with row-level security protects each customer's data while letting the team maintain one report and one semantic model, which can simplify onboarding. Alternatively, separate workspaces or semantic models isolate each customer's content, but setting them up and managing them adds operational complexity as the number of tenants grows.
Strong authentication and secret protection maintain the data boundary. Looker's security guidance for embedded analytics emphasizes keeping cookieless embed session references out of the browser. Your server manages short-lived access tokens, handles token revocation, enforces domain allowlists, and controls export permissions securely.
While Swetrix supports public and password-protected iframe dashboards alongside API access, multi-tenant B2B platforms require rigorous verification. Before promising enterprise customers an entirely white-labeled, isolated reporting environment, validate your requirements with the analytics provider. Features like single sign-on (SSO) for embedded users, automated tenant provisioning via API, custom-domain configurations, and per-tenant retention policies dictate how an enterprise deployment scales.
An iframe serves as a delivery mechanism, but it does not replace a multi-tenant authorization system. Your application code remains responsible for confirming the user's identity and organization before rendering any analytics component.

Privacy-First, Cookieless Analytics for SaaS
Reducing dependence on intrusive tracking cookies benefits your users and simplifies compliance with GDPR, CCPA, and PECR. Adopting cookieless analytics for SaaS does not mean your configuration is automatically exempt from privacy obligations, because the presentation layer and the tracking method are separate decisions.
Swetrix provides a cookieless foundation designed around data minimization. Its standard analytics configuration avoids collecting personally identifiable information, so you can embed dashboards based on browser events or server-side inputs without prompting visitors with aggressive consent banners for basic traffic measurement.
Implementing this requires careful event design. Use opaque account, workspace, or project IDs instead of identifying user details, and avoid passing email addresses in event names or custom properties. Prevent your application from copying sensitive form values, password reset tokens, or detailed URL query parameters into analytics metadata. Define your data retention periods before collecting behavioral events, and separate anonymous activity from persistent application profiles.
Anonymous short-lived measurement differs from application-supplied persistent profiles. If your SaaS application attaches a persistent identifier to a device to track users across multiple days, evaluate local privacy requirements independently.
Treat session replay as a distinct feature requiring its own privacy review. Replays are not an automatic consequence of standard pageviews, and Swetrix requires deliberate activation for this tracking. The default total privacy mode masks text and inputs, but replays still capture page state, mouse movements, and layout interactions. Review your masking rules, consent notices, and sensitive page exclusions before calling the recording function. Iframe recording is disabled by default, and cross-origin capture requires specific support to limit recording to domains you control.
Build, Migrate, and Launch Your Analytics Layer
Adding embedded analytics to a SaaS product forces a build-versus-buy decision. Build in-house if analytics is your core product offering or if your customers demand specialized domain modeling that standard event tracking cannot handle. Buy or embed when your users need standard traffic, usage, conversion, and operational reports, allowing your engineering team to focus on core product features instead of maintaining data ingestion pipelines.
The hybrid Swetrix path serves as a practical middle ground. You embed a complete dashboard quickly, use the Statistics API for native application views, and expand into funnels, revenue attribution, SEO metrics, or session replays as the product matures. If data ownership is a strict requirement for your industry, you can deploy Swetrix via Docker and self-host the entire infrastructure.
If you are migrating from Google Analytics 4, focus on decision continuity rather than identical historical numbers.
- Inventory your current events, conversions, audiences, and campaign parameters.
- Discard legacy reports that nobody actively uses.
- Map essential actions to stable Swetrix custom events and conversion goals.
- Rebuild onboarding and conversion funnels around the current product journey.
- Preserve existing UTM conventions for campaign attribution.
- Import historical data to maintain trend context.
- Compare relative performance trends instead of expecting perfect numerical parity in unique-visitor totals.
- Verify tenant authorization boundaries before publishing the new dashboard to customers.
Before launching your embedded analytics feature, document event schemas, use opaque IDs, and test that server-side authorization blocks cross-tenant access. Keep API keys out of frontend JavaScript bundles, cache common date ranges, and load large dashboards lazily to protect application performance. Finally, review your data retention procedures and masking rules for any optional session replays.
Embedded Analytics FAQ
What is embedded analytics for SaaS? It is the practice of placing dashboards, reports, charts, or data-exploration features directly inside a SaaS application so customers can analyze their data without leaving the product.
Is embedded analytics the same as product analytics? No. Product analytics describes the analysis of in-product behavior, while embedded analytics describes the delivery method. You use product analytics internally and expose specific web and product metrics to customers via embedded analytics.
Should a SaaS company build or buy embedded analytics? Embed a third-party solution when the required capabilities cover standard usage and traffic reporting. Build in-house only when analytics is the core product differentiator and requires a highly specialized data model.
Can embedded analytics be cookieless? Yes. Because the presentation layer and tracking method are separate, a SaaS product can embed dashboards while collecting backend data through a privacy-first, cookieless system.
Can Swetrix dashboards be embedded? Yes. Swetrix supports iframe embedding for custom admin panels and customer dashboards, offering controls for themes, default tabs, and a dedicated embedded mode that hides marketing elements.
Is an iframe enough for sensitive multi-tenant data? Not automatically. A password-protected dashboard requires an underlying tenant-aware authorization model, and SaaS teams evaluate server-side scoping and tenant isolation before exposing data.
Does switching from GA4 mean losing funnels or SEO insights? No. Swetrix provides alternatives including conversion funnels, session replays, error monitoring, revenue tracking, and SEO reporting that combines Search Console data with referral analytics.
Ready to transition from cookie-heavy analytics to a privacy-first platform that supports robust product insights? Add embeddable reporting to your SaaS application with Swetrix.