- Date
A Guide to Churn Rate Analysis for Sustainable Growth
 Andrii Romasiun
So, what is churn rate analysis, really? It’s the process of digging into why customers are leaving your service. It means going beyond a simple, and often scary, percentage to find real, actionable insights that can turn things around. Think of it as your roadmap for improving customer retention, making your product more valuable, and boosting the overall health of your business.
Why Churn Rate Analysis Is Your Growth Compass
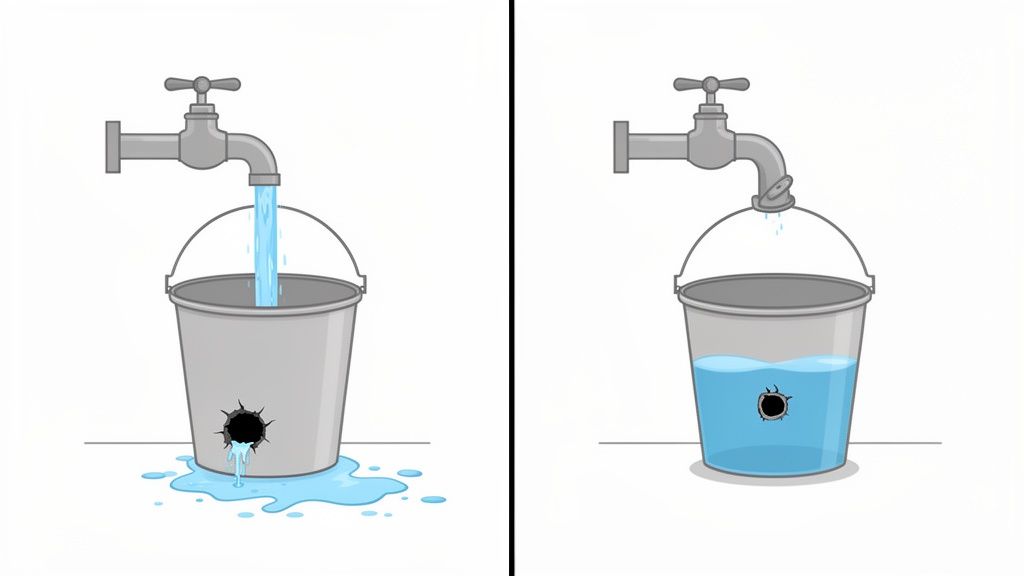
Picture your business as a bucket you’re constantly trying to fill with water (your new customers). Churn is the hole in the bottom. It doesn't matter how fast you pour water in; if you don't plug the leaks, you'll never fill the bucket. That's the core challenge that a good churn analysis helps you solve.
It's easy to get caught up in the excitement of customer acquisition, but keeping the customers you already have is far more cost-effective. In fact, research has shown that boosting customer retention by just 5% can increase profits anywhere from 25% to 95%. It makes sense—your current customers already know your product and are much more likely to upgrade or buy more from you down the line.
Moving Beyond Just a Number
A single churn rate figure, like 5% per month, is just a symptom. It tells you that you have a problem, but it offers no clue as to why. A proper analysis, on the other hand, helps you answer the critical questions that truly drive growth:
- Who is leaving? Are we losing high-value enterprise clients or free-tier users who never really engaged?
- When are they leaving? Is there a mass exodus in the first week, or does it happen right after a specific product update?
- Why are they leaving? Is it a clunky onboarding process, a missing feature, or a problem with our pricing?
Answering these questions shifts your focus from blindly chasing new leads to intelligently keeping the customers you’ve worked so hard to win. This proactive approach is how you turn that leaky bucket into a solid foundation for growth.
Churn analysis isn’t about dwelling on the customers you lost. It’s about learning from them to build a product and an experience so compelling that your current customers can’t imagine leaving.
Ultimately, a deep dive into your churn data shines a light on all the friction points in your customer's journey. You can learn more about pinpointing these moments by defining your North Star Metric, which helps get your entire team focused on delivering the value that makes customers stick around.
How to Accurately Calculate Your Churn Rate
Figuring out your churn rate seems pretty straightforward at first glance, right? But if you want a truly useful analysis, you have to look beyond a single, simple formula. The "right" way to calculate it really depends on what you're trying to learn about your business.
A basic customer count tells one story. Revenue tells another, and it's often the one that matters most.
Starting with the Basics: Customer Churn
The most common starting point is the Customer Churn Rate. It’s a simple percentage that shows how many customers you lost over a specific period. Think of it as the foundational calculation for any deeper analysis.
Here’s the formula:
(Customers Lost in Period ÷ Total Customers at Start of Period) x 100 = Customer Churn Rate
So, if you started the month with 500 customers and 25 of them left, your customer churn rate is 5%. It's a quick and easy health check, but it completely misses the financial story behind those lost customers.
Looking Beyond Customer Counts to Revenue Impact
This is where the real insights are hiding. Let's be honest, not all customers are created equal. Losing one enterprise client who pays $5,000/month is a much bigger blow than losing ten users on your free plan.
That's precisely why tracking Monthly Recurring Revenue (MRR) Churn is so critical. This metric zeroes in on the actual revenue you've lost from cancellations. The difference between customer churn and revenue churn can be night and day. A low customer churn rate can easily mask a dangerously high revenue churn if the customers you're losing are your biggest spenders.
Key Insight: Your customer churn could look great at 2%, but if those few customers accounted for 15% of your total revenue, you have a serious problem that a simple customer count would never flag.
Understanding Gross vs. Net MRR Churn
To get an even sharper picture, we can break revenue churn down into two distinct types: Gross MRR Churn and Net MRR Churn.
- Gross MRR Churn: This is the total revenue lost from both cancellations and downgrades in a given month. It's the pure financial "leak" from your bucket, no sugarcoating.
- Net MRR Churn: This metric is a bit more sophisticated. It takes your Gross MRR Churn and then subtracts any new revenue you've gained from your existing customers—things like upgrades or add-ons (also known as expansion MRR).
This distinction is incredibly powerful. If your expansion MRR from happy, existing customers is greater than the revenue you lose from churn, you can achieve negative net churn. This is the holy grail for a healthy, growing SaaS business. It means you're growing revenue even without signing up a single new customer.
For a deeper dive into these formulas and what they mean for your strategy, check out our detailed guide on how to calculate your churn rate the right way.
To help you keep these terms straight, here's a quick-reference table defining the core types of churn and where they're most useful.
Key Churn Metrics at a Glance
| Metric | What It Measures | Best Used For |
|---|---|---|
| Customer Churn | The percentage of customers lost over a period. | A high-level health check on customer volume and retention. |
| Gross MRR Churn | The total monthly revenue lost from cancellations and downgrades. | Understanding the raw financial impact of lost business. |
| Net MRR Churn | Gross MRR Churn minus revenue from existing customer upgrades/expansions. | Assessing overall revenue health and the impact of upselling. |
| Negative Net Churn | When expansion MRR is greater than Gross MRR Churn. | Demonstrating strong product-market fit and sustainable growth. |
Each of these metrics gives you a different lens through which to view your business. Using them together provides a complete, 360-degree view of your customer retention and revenue stability.
Uncovering the 'Why' with Advanced Churn Analysis
Calculating your churn rate is just the first step. It’s an essential number, but it only tells you what happened, not why your customers decided to leave. To really get a handle on churn and start preventing it, you have to dig deeper into the story your data is trying to tell. This is where the real work of churn analysis begins, turning a simple metric into a powerful tool for growth.
Think of your overall churn rate like a fever. It signals that something is wrong, but it doesn't diagnose the illness. Is it a minor cold or something more serious? Advanced techniques like cohort analysis, retention curves, and segmentation are the diagnostic tools that help you pinpoint the root cause, so you can prescribe the right treatment.
The graphic below breaks down the two main types of churn—customer and revenue—which are the foundation for any deeper analysis.
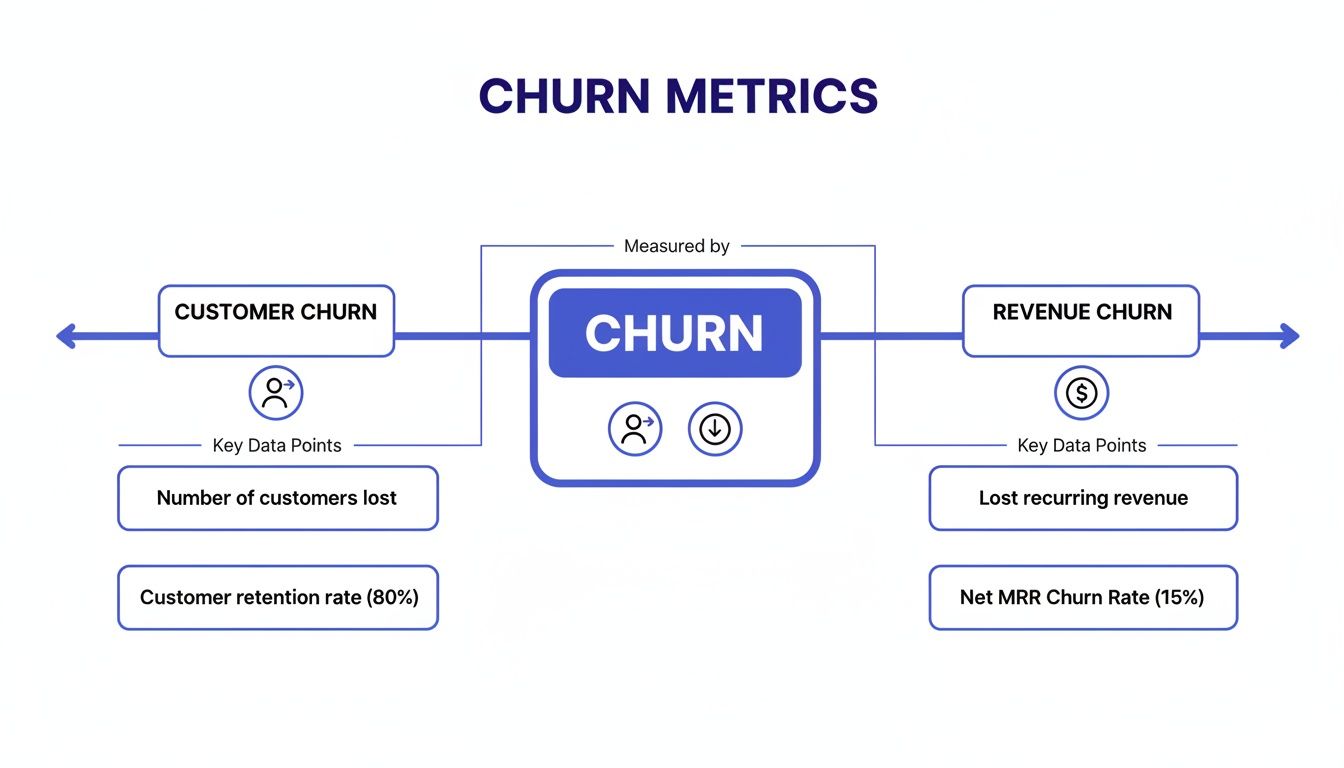
It’s a crucial distinction. Losing a customer is one thing, but understanding the financial impact of that loss is what really guides your retention efforts.
Grouping Users with Cohort Analysis
One of the most powerful ways to uncover hidden patterns in user behavior is through cohort analysis. Instead of looking at all your users as one giant, messy group, you bundle them into "cohorts" based on a shared characteristic—most often, the month they signed up.
This approach lets you see how different groups of users behave over time. For example, did the users who signed up in March, right after you launched that new onboarding tutorial, stick around longer than the February group? By comparing cohorts side-by-side, you can directly measure the impact of product updates, marketing campaigns, or pricing changes on long-term retention.
By isolating variables between different user groups, cohort analysis helps you move from guessing what works to knowing what works. It’s the closest you can get to running a time-travel experiment on your product's evolution.
This method helps you answer critical questions like:
- Did our new feature release in Q2 actually make the product stickier?
- Are users we acquired through paid ads churning faster than our organic users?
- Is our churn rate improving or getting worse over the long run?
Pinpointing Drop-Offs with Retention Curves
While cohorts show you who is churning, retention curves show you when. A retention curve is simply a graph that plots the percentage of a user cohort still active over time. In most cases, you'll see a steep drop-off in the first few days or weeks, which eventually starts to flatten out.
That initial drop is your moment of truth. It's where new users decide if your product is valuable enough to become part of their routine. A sharp, early plunge often signals a broken onboarding experience or a major disconnect between your marketing promise and the actual product. In fact, research shows that, on average, software products retain only 39% of users after one month, a number that falls to just 30% after three months.
This means a staggering 70% of new users are typically gone within that critical opening period. By studying the shape of your curve, you can identify the exact moments where engagement falters and start making targeted improvements.
Segmenting for Deeper Insights
Finally, customer segmentation adds another layer of clarity. This is all about breaking down your churn data by specific user attributes. Instead of just one churn rate, you can have dozens, each telling a different part of the story.
You could segment your users by almost anything, but here are a few common starting points:
- Pricing Plan: Are users on your basic plan leaving more often than your enterprise clients?
- Acquisition Channel: Do users from Google Ads have a higher LTV than those from your blog?
- User Demographics: Are users in a specific country or industry struggling with your product?
This level of detail is where you strike gold. For example, discovering that users who activate a specific third-party integration have a near-zero churn rate is a game-changer. That insight tells you to push every new user to set up that integration. These are the kinds of actionable discoveries that truly transform a retention strategy.
By combining these methods, you get a multi-dimensional view of your churn. You can explore these techniques and more by using the right user behavior analytics tools that make complex analysis much more straightforward.
Turning Churn Analysis into Actionable Insights
All the data in the world is useless if you don't act on it. A good churn analysis does more than just spit out charts; it hands you a clear roadmap for keeping your customers around longer. The real work is bridging the gap between spotting a problem and actually shipping a fix that makes your product stickier.
Ultimately, the goal is to stop being reactive. Instead of just figuring out why people bailed last month, you need to build a system that can predict—and even prevent—churn before it ever happens. This is all about drawing a direct line from user behavior to retention.
Identifying the Root Causes of Churn
Your first move is to connect specific user actions (or their lack thereof) to the moment someone decides to leave. By tracking key events throughout the user journey, you can pinpoint the exact friction points that are driving people away. It’s like digital forensics, turning vague hunches into solid, data-backed hypotheses.
Think about the make-or-break moments in your product. Do you see a massive drop-off halfway through your onboarding? Are users who never adopt a key feature, like creating a shared dashboard, the ones most likely to cancel within 30 days?
These are the kinds of questions that lead to breakthroughs. When you build funnels and track custom events, you can literally see where the leaks are in your product and start brainstorming how to plug them.
Building a Proactive Retention Workflow
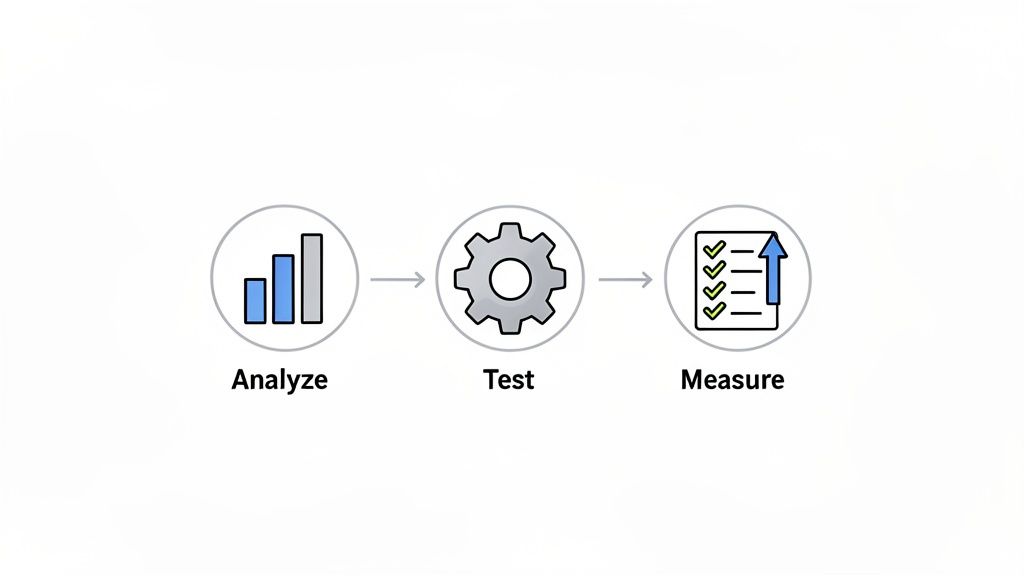
Once you have a handle on the behaviors that signal churn, you can start building a system to step in. A proactive workflow is all about creating automated responses to negative signals while encouraging the positive behaviors you know lead to retention. It’s a continuous feedback loop: analyze, hypothesize, test, and measure.
This workflow usually involves a few key pieces:
- Setting Up Alerts: Create automated notifications for when churn suddenly spikes or a key engagement metric nosedives. A tool like Swetrix can ping your team on Slack or Telegram, so you can jump on problems right away.
- Targeting At-Risk Users: Pinpoint users who are showing signs of disengagement, like logging in less often. You can then reach out with re-engagement campaigns, helpful tutorials, or even a personal check-in from your support team.
- Testing Retention Hypotheses: Turn your insights into a testable idea. For example, "I bet improving our onboarding checklist will cut first-month churn by 10%." Then, you can use feature flags or A/B tests to see if you're right and measure the real impact.
The best retention strategies aren't one-off campaigns. They are a continuous cycle of analysis and improvement, where every insight from your churn data fuels your next experiment.
A SaaS Industry Case Study
The SaaS world is a perfect laboratory for these ideas. While average annual churn rates often land between 5-8%, the best companies manage to keep it below 3%. One of the most interesting findings is how pricing models affect churn; companies using usage-based pricing often report 15-30% lower churn compared to those with fixed plans.
Even more telling, poor onboarding has been identified as the single biggest reason for churn, proving that a customer's first few moments with your product are absolutely critical. You can find more details in these SaaS customer retention statistics.
Common Churn Analysis Mistakes to Avoid
Even with perfectly clean data, a few common slip-ups in your churn analysis can send you down a completely wrong path. Knowing what these mistakes are is the first step toward building a retention strategy that actually moves the needle. Getting this right ensures your insights are sharp, accurate, and reflect the real story of your customers.
Looking Only at the Blended Rate
One of the most frequent blunders is obsessing over a single, blended churn rate. This one number can hide a multitude of sins. For example, your overall churn might look like a healthy, stable 4%. But what if you dug a little deeper?
You might discover that your high-value enterprise clients are leaving at an alarming 15% clip, while your lower-value, free-tier users are sticking around. That blended average gives you a false sense of security while your most profitable customer segments are quietly walking out the door.
Relying on a blended churn rate is like looking at the average temperature of a hospital. It tells you nothing about the individual patients, some of whom may have a dangerously high fever.
Not Separating Voluntary and Involuntary Churn
Another classic error is failing to distinguish between voluntary and involuntary churn. They are not the same thing, and they require completely different solutions.
Voluntary churn is when a customer makes a conscious choice to leave. Maybe they weren't happy with the product, found a better price elsewhere, or just didn't need it anymore. This is a direct signal about your customer experience.
Involuntary churn, on the other hand, is almost always accidental. Think expired credit cards or failed payments. The customer didn't intend to leave, but a technical glitch pushed them out. Lumping these two together muddies the water, making it impossible to know if you have a product problem or a payment processing problem.
Ignoring the Bigger Picture
Finally, you can't analyze churn in a vacuum. Context is everything. Seasonality, for instance, can have a huge impact. A B2B software company might naturally see more churn at the end of a fiscal quarter when clients are re-evaluating their budgets. If you don't account for that, you might panic over what is actually a predictable dip.
It's also crucial to compare your performance to the right benchmarks. Churn rates vary wildly from one industry to another. Some sectors, like finance and cable, report rates around 25%, while others like media and professional services enjoy retention rates as high as 84%. Judging your SaaS company against a retail benchmark is a recipe for frustration. To get a better sense of where you stand, see how customer retention rates differ by industry and set a realistic baseline for your own business.
Frequently Asked Questions About Churn Rate Analysis
Even after you've got a handle on the methods, some practical questions always pop up when you're in the thick of a churn analysis. Here are a few of the most common ones I hear, with some straightforward answers to help you move from theory to confident action.
What Is a Good Churn Rate?
This is the million-dollar question, and the honest answer is: it depends. There’s no magic number that works for everyone. What’s considered "good" is completely tied to your industry, business model, and how long you've been around.
A B2B SaaS company, for example, might be aiming for a monthly churn rate of 1-2%. But for a B2C streaming service, a 3-5% monthly churn might be perfectly healthy.
Instead of getting hung up on someone else’s benchmark, your focus should be on your own trend line. The real sign of a healthy business isn't hitting an arbitrary number—it's seeing your churn rate consistently go down. Your goal is to figure out your own baseline and then work to improve it, month after month.
How Can I Predict Which Customers Might Churn?
Predicting churn is less about a crystal ball and more about spotting the early warning signs. You're looking for subtle shifts in behavior that suggest a customer is drifting away, long before they hit the "cancel" button. Think of it as reading their digital body language.
What are the tell-tale signs? It's often things like:
- A noticeable drop in how often they log in.
- They've stopped using the key features they once loved.
- They aren't trying out the new features you just launched.
By tracking these kinds of behaviors, you can start to identify "at-risk" customers. For instance, if a user hasn't logged in for two weeks and has ignored your last three feature update emails, they're probably on their way out. This is your cue to step in with targeted support, a helpful tutorial, or a personal re-engagement campaign to remind them of the value you provide.
Does a Privacy-First Approach Limit Churn Analysis?
Not at all. In fact, it can make your analysis stronger by forcing you to focus on what actually matters. When you respect user privacy, you build trust, and trust is the bedrock of long-term retention. A privacy-first approach doesn’t mean you’re flying blind; it just means you use smarter, more ethical tools.
Powerful churn analysis is entirely possible using anonymous, aggregated data. You don't need to track individuals to understand user behavior at scale. This ethical approach allows you to make smart, data-driven decisions while protecting your users.
Methods like cohort analysis, funnel tracking, and feature adoption rates give you incredible insights without needing personal identifiers or invasive cookies. You can still discover that users from a specific ad campaign are churning at a higher rate, or that a new feature is boosting engagement—all without compromising privacy.
Ultimately, churn analysis is about finding and fixing the friction in your product experience. A privacy-first mindset helps you do just that, improving the product for everyone, not tracking any one person.
Ready to perform powerful churn rate analysis without compromising user privacy? Swetrix provides all the tools you need—from cohort views and custom event funnels to revenue integrations—in one simple, cookieless platform. Start your 14-day free trial today and see what's really driving your growth.