- Date
The Best Analytics for Open Source Projects in 2026
 Andrii Romasiun
Open-source maintainers build software for the community. Tracking how users interact with that software presents a massive challenge. Find the best analytics for open source projects to measure traffic, bypass ad blockers, and support privacy-aligned compliance without invasive cookies.
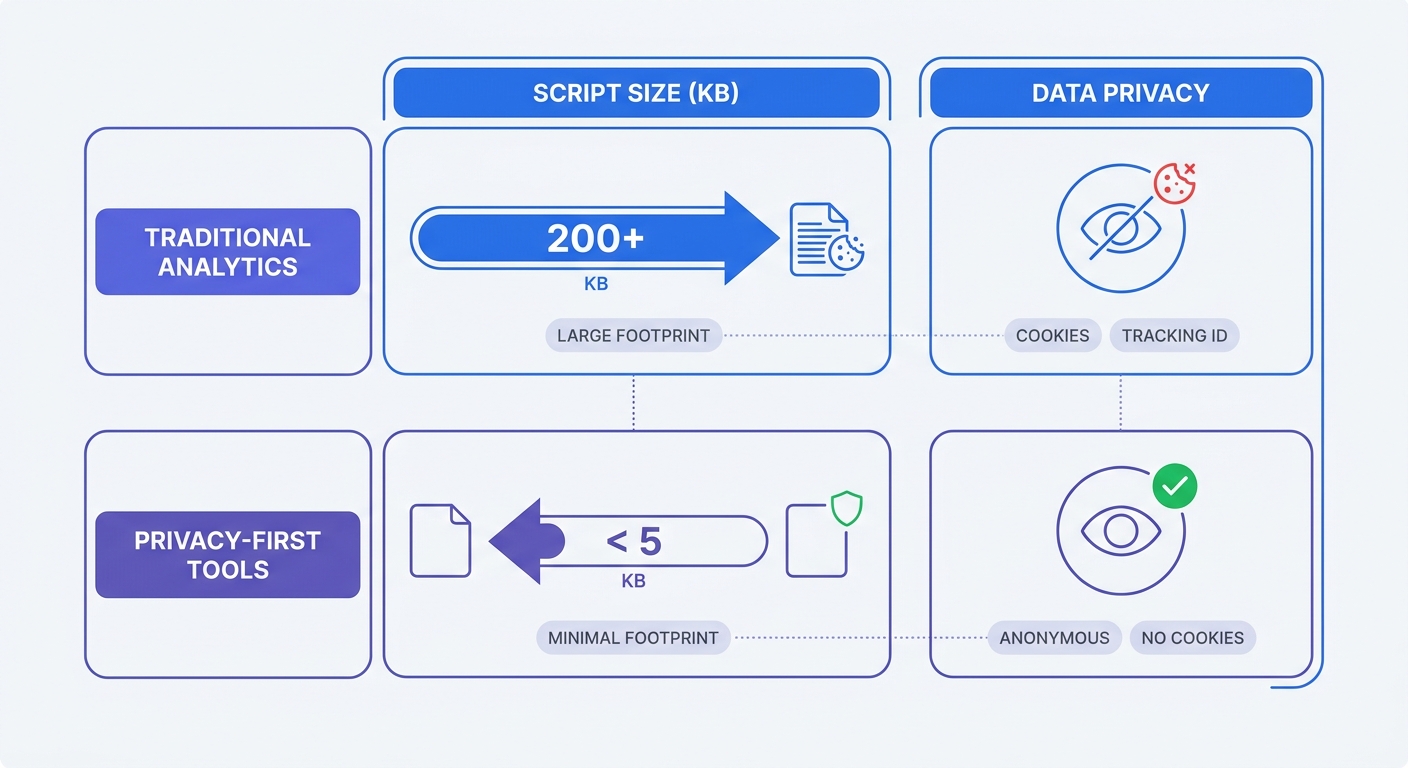
Google Analytics commands an over 80% market share as of 2024 among traffic analysis tools across the web. Relying on this legacy tracker burdens your repository sites with approximately 45 kilobytes of script bloat. Ad blockers strip out between 20 and 58 percent as of 2024 of your valid visitor data for developer-heavy audiences, though this rate varies by industry and content type. Visitors actively reject tracking cookies.
Swetrix offers a privacy-first alternative. Site owners secure accurate telemetry without tracking individuals across the web. Our open-source platform captures the data required to grow your project without harvesting personal information.
Audit your current analytics payload today. Open your browser developer tools, navigate to the network tab, and filter by JavaScript. A tracking script exceeding 10 kilobytes forces your site to sacrifice performance for fragmented data.
The Analytics Dilemma for Open Source Projects
Developers expect fast page loads and respect for their data. Legacy analytics platforms violate both expectations while delivering incomplete metrics.
The Failure of Traditional Tools
Heavy scripts drag down Core Web Vitals. A standard Google Analytics configuration forces browsers to download and execute large JavaScript bundles before the main thread renders your documentation. Mobile users on slow connections stare at blank screens during third-party script parsing.
Tech-savvy visitors protect their privacy. Developers run uBlock Origin or use browsers like Brave that block third-party trackers by default. This dynamic creates a massive blind spot in your dashboard. Maintainers miss a quarter of their pageviews. Blind spots obscure which documentation pages fail to answer user questions.
Proprietary trackers conflict with the open-source ethos. Publishing source code builds transparency, yet closed-source tracking black boxes force visitors into opaque data exchanges.
Privacy and Compliance Rules
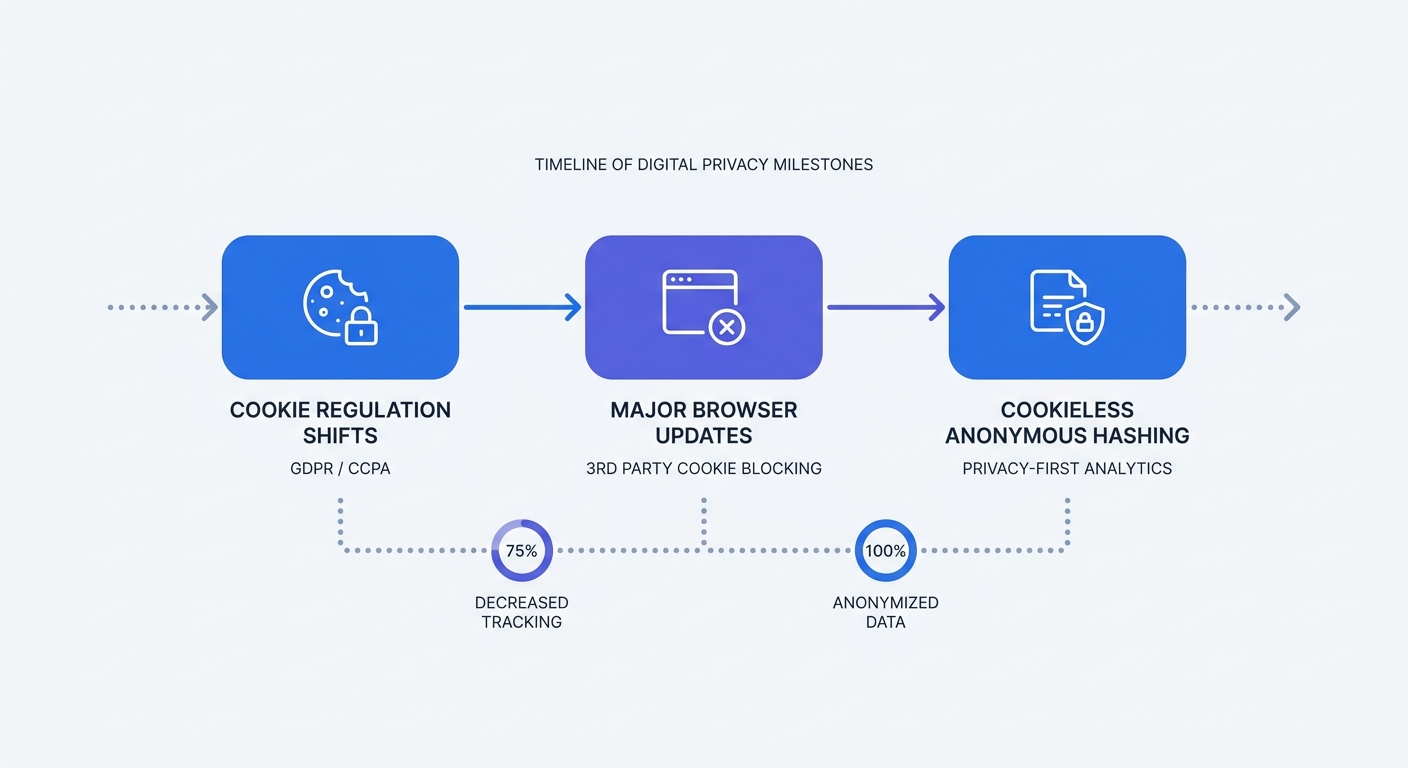
European regulators show zero tolerance for improper cookie usage. Cumulative GDPR fines have exceeded €7.1 billion in recent years. A simple open-source project documentation site triggers compliance violations if it sets tracking cookies without explicit consent.
Standard analytics tools transfer user IP addresses to external servers. This data movement violates the data minimization principle under GDPR. Project maintainers face legal risk for unused metrics.
Run a privacy audit on your project site. Load your documentation page in an incognito window and inspect the application tab in your developer tools. Delete any script that drops a cookie before the user clicks a consent banner.
Core Features of Privacy-First Tracking
Modern platforms discard persistent identifiers. Administrators capture aggregate usage trends while respecting visitor anonymity.
Cookieless Tracking and Anonymous Hashing
Cookie-based analytics tag a specific device and follow it across sessions. Cookieless tracking uses anonymous hashing to map user journeys within a single day.
The system combines the incoming IP address and the user agent string. Hashing these data points with a daily-rotating cryptographic salt generates a unique visitor ID for a 24-hour window. At midnight, the salt changes and the previous identifiers disappear.
This method secures accurate daily unique visitor counts. Site owners eliminate the need for cookie consent banners. Documentation sites stop interrupting readers with legal popups.
Inspect your tracking script for local storage usage. A privacy-first tool never writes tracking identifiers to the browser's local storage or session storage APIs.
Lightweight Scripts for Better Web Vitals
Script weight dictates frontend performance. Swapping a 45-kilobyte legacy tracker for a modern script allows the browser to parse the smaller file in milliseconds. Your First Contentful Paint metric improves. Better performance metrics signal search engines to rank your documentation higher.
Replace your tracking snippet by removing the old gtag.js script tag from your HTML head. Insert a lightweight tracker like the Swetrix script. Verify the new script uses asynchronous loading.
<!-- Example of an optimized, asynchronous tracking script -->
<script src="https://swetrix.org/swetrix.js" defer></script>
<script>
  document.addEventListener("DOMContentLoaded", () => {
    swetrix.init("YOUR_PROJECT_ID");
    swetrix.trackViews();
  });
</script>
The defer attribute prevents render blocking. Background downloading ensures the browser executes the script after parsing the HTML document.
Top Tools: The Best Analytics for Open Source Projects
Picking the right platform depends on specific data requirements. Open-source maintainers need tools that match their architecture.
Swetrix: The Best All-in-One Solution
Swetrix stands as the best analytics for open source projects. The unified platform covers web traffic, application performance, and error tracking in a single script of approximately 6 KB (minified and gzipped).
Developers built Swetrix as an open-source self-hosted analytics platform. Maintainers inspect the code, verify the privacy claims, and deploy it anywhere. The cloud version starts at $19 per month for 100,000 events. The hybrid script captures custom events, outbound link clicks, and file downloads without bloated configurations.
Use the native error tracking feature to catch JavaScript exceptions in a frontend application. The dashboard visualizes conversion funnels to expose where developers abandon the onboarding flow.
Deploy Swetrix to monitor page speed. The performance monitoring dashboard tracks load times across different geographic regions.
Plausible and Umami: The Minimalists
Specific projects require a bare-bones pageview counter. Plausible and Umami deliver a minimalist approach to data collection using scripts under 2 kilobytes.
These tools excel at basic referrers and bounce rates. They lack product analytics capabilities. Tracking complex user flows or monitoring API errors requires a different platform.
Review data goals before selecting a minimalist tool. Planning to track user signups or run A/B tests on a landing page makes a basic counter inadequate.
Scarf: The Infrastructure Tracker
Web traffic exposes a fraction of the story. Scarf analyzes over 10 billion open-source package events to identify download trends. Maintainers route Docker containers or npm packages through their gateway.
The platform tracks CLI tool usage and container pulls. This system quantifies backend telemetry without gathering personal data.
Evaluate the project tech stack. Maintaining a frontend library pairs well with Swetrix for combined web and error insights. Building infrastructure tools requires pairing web analytics with Scarf for package tracking.
| Feature | Swetrix | Plausible | Umami | Scarf |
|---|---|---|---|---|
| Primary Use Case | Web & Product Analytics | Web Analytics | Web Analytics | Infrastructure Telemetry |
| Open Source | Yes | Yes | Yes | Yes |
| Script Weight | ~6 KB | < 1 KB | ~2 KB | N/A (Gateway) |
| Error Tracking | Yes | No | No | No |
| Funnel Visualization | Yes | Yes | Yes | No |
| Cookieless Tracking | Yes | Yes | Yes | Yes |
Deployment Strategies: Cloud vs. Self-Hosting
Data ownership dictates where an analytics platform lives. Teams choose between managed convenience and absolute infrastructure control.
Ensuring Data Sovereignty with Docker
Self-hosting prevents third parties from touching project data. Administrators pull the open-source Docker image and spin up the environment on a virtual private server.
Store your data in a PostgreSQL database on personal infrastructure. Local hosting satisfies strict data sovereignty laws while maintaining isolation from cloud provider outages. Read the guide to connecting a Postgres database to configure the backend.
Write a basic docker-compose.yml file to launch the stack. Define the database container, API container, and frontend dashboard container. Mount volumes to persist database files across container restarts.
Update firewall rules after deployment. Restrict database access to internal network traffic. Expose the frontend and API ports to the public web.
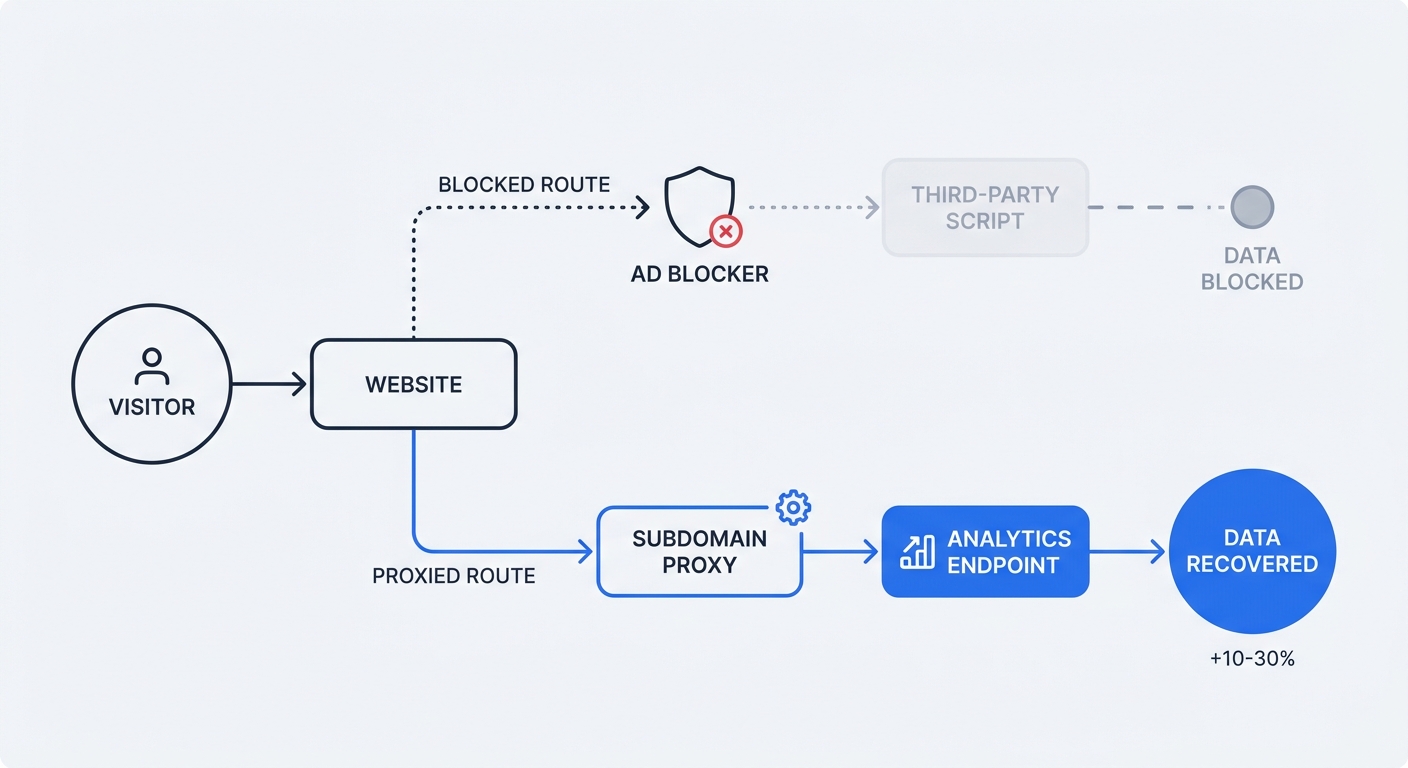
Bypassing Ad Blockers with Subdomain Proxies
Third-party tracking domains trigger ad blocker blocklists. First-party subdomains may bypass these filters. Routing analytics requests through a custom domain can help address this problem.
A visitor loads yourproject.com. The browser requests the tracking script from analytics.yourproject.com. Ad blockers may treat first-party subdomains more permissively, though results vary across blockers and browsers. This setup may improve data collection and can reduce missing data.
Set up a proxy script. Create a CNAME record in the DNS provider pointing analytics.yourdomain.com to the analytics server. Update the tracking snippet to use the custom domain endpoint.
Configure Nginx to handle proxy routing. Forward incoming requests on the tracking subdomain to the analytics API endpoint. Add SSL certificates via Let's Encrypt to secure the transmission.
Advanced Tracking Without Invading Privacy
Open-source projects live across multiple platforms. Maintainers track engagement everywhere without compromising visitor anonymity.
Utilizing 1x1 Pixel Tracking in Repositories
GitHub strips JavaScript from README files. Standard script tags fail to track repository views. Non-interactive pixel tracking provides an alternative.
Embed a 1x1 image tag in the markdown. The browser requests the image from the analytics server whenever a user opens the README. The server logs the pageview based on request headers. Note that GitHub (and CDNs/proxies) may cache or proxy README images, so counts reflect image loads—an approximation of README opens rather than an exact count. Consider adding cache-busting query parameters (e.g., a timestamp) or using server-side heuristics to improve accuracy.
Add this markdown to the repository:

Replace YOUR_PROJECT_ID with the unique identifier. This approach provides approximate view counts for documentation directly inside the code repository. Place the image at the bottom of the document to ensure the text content loads ahead of the tracking pixel.
Accurate Attribution with UTM Parameters
Campaign links expose which marketing efforts drive adoption. UTM parameters append source data to URLs.
Format links with specific tags. Use utm_source for the platform and utm_campaign for the initiative. A link shared on Reddit becomes yourproject.com/?utm_source=reddit&utm_campaign=version_2_launch.
The analytics platform parses these tags. Dashboard reports display which social post drove developers to the installation page. Use the UTM generator to standardize campaign links.
Track five parameters for maximum visibility:
- Source: The origin of the traffic (e.g., github, newsletter).
- Medium: The category of the source (e.g., social, email).
- Campaign: The specific promotion or release (e.g., v3_release).
- Term: The keyword targeted (used for paid ads).
- Content: The specific element clicked (e.g., header_link, footer_button).
Standardize naming conventions. Document UTM tags in a shared file for project maintainers. Consistent tagging prevents fragmented data in the dashboard.
Monitoring Custom Events and Conversion Funnels
Pageviews show traffic volume. Custom events show user actions. Tracking specific interactions exposes how developers use the documentation.
Bind event listeners to crucial elements on the page. Track when a user clicks the "Copy Code" button on the installation snippet. Monitor downloads of compiled binary releases.
Send custom event payloads to the analytics platform. Define an event category and action for each interaction.
// Example of tracking a custom event with Swetrix
const copyButton = document.getElementById("copy-install-cmd");
if (copyButton) {
  copyButton.addEventListener("click", () => {
    swetrix.track({
      ev: "Copy Code",
      meta: {
        section: "Installation",
        os: "Linux",
      },
    });
  });
}
Build a conversion funnel in the dashboard using these events. Define step one as a landing page view. Set step two as viewing the installation guide. Designate step three as clicking the copy button.
Identify the drop-off points. Users viewing the installation guide but failing to click copy signals that the instructions require a rewrite. Use these insights to optimize the developer experience.
Stop trading user privacy for basic project metrics. Deploy an analytics platform built to respect visitor anonymity while delivering robust insights. Start a 14-day free trial at Swetrix.com/signup to capture cookieless data for your open-source project.