- Date
500 Status Code: Causes, SEO Impact, and Fixes
 Andrii Romasiun
HTTP is a client/server request/response protocol, and each server response includes a status code. IETF RFC 9110 defines the shared semantics of those messages, while leaving what occurs behind the server interface unspecified. That means a 500 status code signals an unexpected server-side condition without identifying the underlying process failure.
Your visitor sees a generic error page, while your application logs, web server logs, proxy logs, and platform logs contain the useful diagnostic details. A 500 response does not mean your entire infrastructure is offline. Instead, it indicates that the application logic or environment responsible for handling that request has broken down. Relying solely on raw server logs gives you the technical trace, but leaves you blind to user behavior. Swetrix serves as a companion to your server monitoring by connecting backend failures to product impact, helping you map server errors to dropped sessions and abandoned conversion funnels. That product context is missing from raw logs.

500 vs. 502, 503, and 504
Web servers and reverse proxies use the 5xx class of status codes to indicate server-side problems, but these codes are not interchangeable. Their semantics help you identify exactly which layer of the network or application requires investigation.
| Status | Meaning | Use when |
|---|---|---|
| 500 Internal Server Error | The server encountered an unexpected condition that prevented it from fulfilling the request. | The failure is unexpected and no more specific server-error status applies. |
| 502 Bad Gateway | A gateway or proxy received an invalid response from an inbound server. | A reverse proxy, gateway, or load balancer cannot interpret the upstream response. |
| 503 Service Unavailable | The server is temporarily unable to handle the request due to overload or scheduled maintenance. | The unavailability is temporary and the client may reasonably retry later. |
| 504 Gateway Timeout | A gateway or proxy did not receive a timely response from an upstream server. | The upstream service did not respond within the required network window. |
Begin your investigation at the application or local server for a 500 response, but move to the proxy-to-upstream connection and upstream response format if you see a 502. Check overall availability, capacity, and planned maintenance schedules for a 503, or look at upstream latency and dependency timeouts for a 504. A reverse proxy passes an origin server's 500 status directly to the client rather than generating its own 502 or 504. Because these semantics matter to downstream clients and search engines, use 503 instead of 500 for planned outages, ideally accompanied by a Retry-After header.
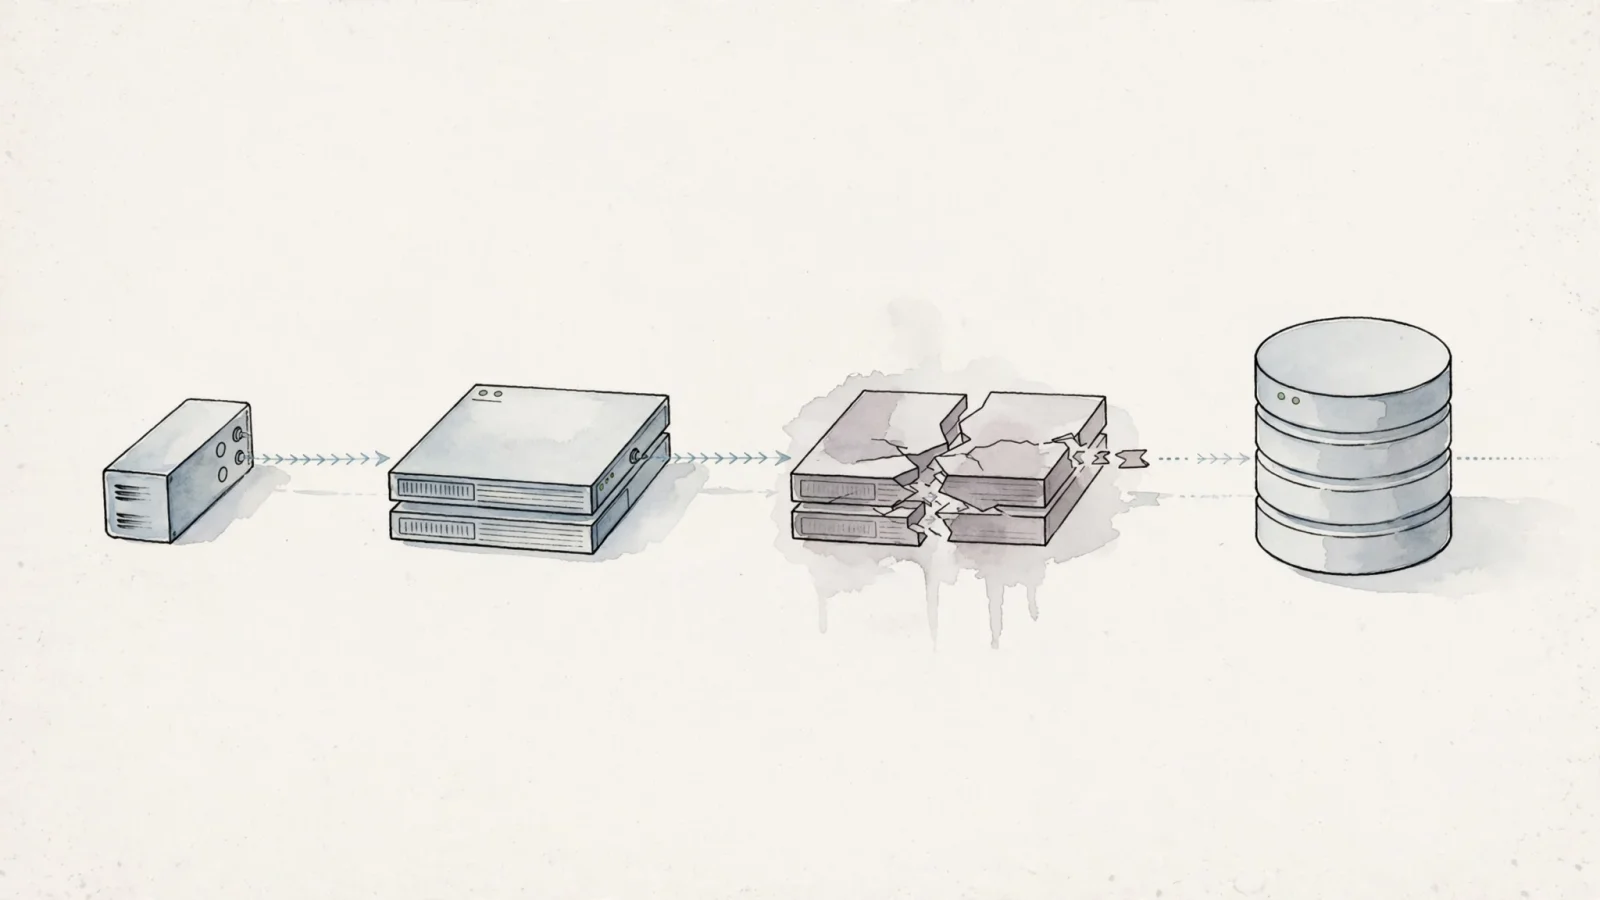
Find the Failing Layer
Because a 500 response is a generic catch-all, diagnosing the underlying issue requires investigation by server owners or administrators. The MDN Web Docs list improper server configuration, out-of-memory conditions, unhandled exceptions, and improper file permissions as possible causes.
Start by mapping the failure to one of these common infrastructure layers:
- Application code: Unhandled exceptions, failed template rendering, or invalid route logic. Look for stack traces and recent code releases.
- Configuration: Missing environment variables, invalid server directives, or incompatible deployment settings. Inspect recent infrastructure changes.
- Dependencies: The database, cache, message queue, or external API is unavailable. Check connection health and timeout logs.
- Resources: Out-of-memory conditions or exhausted worker capacity. Review container, host, and runtime metrics.
- Filesystem: Incorrect permissions or inaccessible files. Verify service-account permissions and directory ownership.
- Reverse proxy: Rewrite or internal-redirection cycles can occur in incorrect configurations. For instance, when a request reaches the limit of 10 internal redirects, NGINX returns a 500 response, according to NGINX documentation.
- Error handler: A custom error page or fallback route generates another error while trying to render, masking the original problem.
Use the scope of the failure to narrow your search. A sitewide outage points toward shared configuration, deployment mechanisms, infrastructure, or a primary database dependency. Conversely, a failure isolated to one specific route typically indicates flawed application logic, bad templates, corrupt data, or missing permissions for that endpoint. Check whether the error occurs only for POST requests, only for authenticated sessions, or only in specific geographic regions to eliminate healthy layers of your stack and focus your attention on the exact failure point.
How to Troubleshoot a 500 Error
Troubleshooting requires reproducing the failure, tracing the request through your logs, and verifying the fix using a structured workflow rather than guessing at configuration changes.
First, reproduce the exact request because a page returning a healthy status does not prove its associated API calls, checkout flow, or authenticated routes are functioning. Record the URL, query parameters, HTTP method, authentication state, request headers, request body, and timestamp. You can run a check from your terminal that prints the response headers without the body:
curl -sS -D - -o /dev/null https://www.example.com/problem-page
For an API or form endpoint, recreate the relevant method and payload against a non-destructive test target:
curl -sS -D - -o /dev/null \
  -X POST \
  -H 'Content-Type: application/json' \
  --data '{"test":true}' \
  https://www.example.com/api/example
Next, check your web server and application logs for a request ID, timestamp, route, HTTP method, authentication state, request headers, request body, runtime ID, deployment version, upstream service, and the corresponding exception. Correlate the access log entry with the error log entry to see exactly when the application failed. Keep detailed diagnostics in protected logs and return a generic error message in the browser rather than exposing raw stack traces to your visitors.
Once you locate the exception, check your dependencies and resource limits for database connection drops, cache availability issues, API timeouts, memory pressure, or container restarts. Compare the timestamp of the first error with your recent release logs. If the issue aligns with a deployment, consider a controlled rollback or disabling the new feature via a flag while you investigate.
If the application logs show no errors, the failure likely occurred before the request reached the application. Inspect the web server or reverse proxy, and check your NGINX or Apache error logs for rewrite cycles, internal redirection limits, or upstream connection refusals.
Finally, return the status that matches the condition, and never configure your server to mask a failure by returning a 200 OK status with an error page. Test the dependent forms, APIs, internal links, and canonical URLs from more than one environment. Running your entire sitemap through an Http Status Bulk Checker helps verify that the fix applies to all related routes, not just the single page you refreshed in your browser.

The Impact of 500 Errors on SEO
Server errors directly affect search visibility, but the severity depends on the scope and duration of the outage. As detailed by Google Crawling Infrastructure, search crawlers slow down their request rate when encountering 5xx responses, and they ignore the content received from URLs returning these errors.
Google decreases its crawl rate in proportion to the number of URLs returning server errors. A brief, isolated failure will not permanently damage your rankings because the crawler backs off and retries the URL later. However, URLs that persistently return server errors over several days face a high risk of being dropped from the index entirely.
The most common SEO mistake during an outage is trying to hide the failure by returning a 200 OK status for a page that failed to load its content. Google interprets a successful response containing an error message as a soft 404, which creates confusion in the index. Avoid redirecting every failed server request to your homepage, and do not use a 404 Not Found status to mask a temporary server overload.
Use the semantic definitions correctly by returning 200 when the content serves, 404 when the resource does not exist, 301 or 308 for a permanent move, 503 for temporary maintenance, and 500 for an unexpected server failure. If your server returns a 500 for the robots.txt file, Googlebot stops crawling the entire site until the file becomes accessible again because it assumes the site is down. You can check how crawlers perceive your recovered pages by running them through an Ai Search Llm Crawlability Checker after you restore service.
Monitor 500 Errors With Privacy in Mind
A significant gap exists between technical server monitoring and product analytics. A client-side tracking script cannot reliably observe an HTML request that fails before the page loads. If your reverse proxy generates a 500 error, the browser receives an error page, the analytics script never executes, and your dashboard records zero traffic. Because of this blind spot, CDN, reverse-proxy, web server, and platform logs remain required for diagnosing origin-level failures.
As a privacy-focused Google Analytics alternative, Swetrix bridges this gap by adding the user-impact layer without compromising visitor privacy. You can capture unhandled JavaScript errors that occur after a page loads using the client-side trackErrors() method. For backend failures, you can report application exceptions directly from your server middleware using the server-side SDK's trackError() method before returning the explicit 500 response.
This adapted Express.js pattern records the error context server-side, then returns a generic response to the client:
app.use((err, req, res, next) => {
  swetrix.trackError(req.ip, req.headers["user-agent"], {
    name: err.name || "Error",
    message: err.message,
    stackTrace: err.stack,
    pg: req.path,
  });

  res.status(500).json({ error: "Internal Server Error" });
});
Reporting errors directly from the application layer allows you to connect a failure to a specific route, release, or product event, showing exactly how many checkout flows or signup attempts failed during a database timeout.
Always sanitize your error messages, stack traces, and route parameters before transmission. Strip out passwords, authorization headers, payment details, session tokens, and unnecessary personal metadata. The goal is to measure the precise impact on your conversion funnels and user sessions, not to collect invasive granular data.
Verify Recovery and Prevent Repeat Failures
Do not declare an incident fixed based on a single successful browser refresh, as browser caching and CDN edges can serve a stale successful page while the origin server continues to fail. Before closing the issue, systematically verify the route and all its dependencies.
Confirm that the original request returns the intended status, headers, and complete content body. You can use an Http Headers Checker to inspect the raw response from a clean network environment. Check that the relevant request ID has no unresolved exceptions in the proxy or application logs, and ensure your database connections, memory usage, and resource limits have stabilized under normal traffic loads.
Test the affected HTML pages, API calls, forms, authenticated paths, internal links, and canonical URLs. From there, confirm that any temporary maintenance flags using 503 have been lifted, missing resources correctly return 404, moved resources redirect with 301 or 308, and failed pages are no longer disguised by 200 OK responses.
Review Google Search Console for crawler-visible errors a few days after the server returns to health. Preserve the route, release version, request ID, and error context in your incident documentation. Add a regression test, an automated health check, or a specific alerting threshold to catch the underlying condition before it reaches the user again. Your infrastructure logs prove that the technical failure is resolved, while your analytics show that users can successfully navigate the product once more.
Track the errors that affect real users, not just the requests that reach your server logs. Swetrix combines cookieless traffic analytics with client-side and server-side error monitoring, helping you connect backend failures to user behavior and conversion drops. Keep your site fast, compliant, and reliable. Start tracking with Swetrix today.