- Date
500 Server Error: Causes, Fixes, and SEO Impact
 Andrii Romasiun
A 500 server error means the server encountered an unexpected condition and could not complete the request. This status code acts as a symptom rather than a specific diagnosis, as it does not identify whether the failure came from application code, a misconfigured environment variable, exhausted memory, incorrect file permissions, or a failed database connection. It indicates that the server received the request, failed while processing it, and returned an error response instead of completing it.
Because this response applies to a specific request, a 500 error on one URL does not automatically mean the entire website or host is down. One complex database query, specific form submission, or API method might fail repeatedly while static files, cached pages, and neighboring routes continue serving traffic normally. The server response body might contain custom HTML, a JSON object, or nothing at all, while the response will still carry a 500 status code.
If you are visiting a site, refresh the page once to see if the failure was momentary. You can also try again a few minutes later, check the company's status page, or send the owner the exact URL, the time, and any incident ID displayed on the screen, because visitors cannot fix a true origin failure.
If you build or manage websites, finding the failing layer quickly is your first priority. Moving to a cookieless Google Analytics alternative does not require giving up technical error visibility. Privacy-first analytics platforms like Swetrix bridge the gap between backend error reporting, browser-side failures, and affected user sessions. Because a hard origin failure occurs before the HTML and tracking scripts load, combining server-side instrumentation with client-side analytics gives you the complete picture.
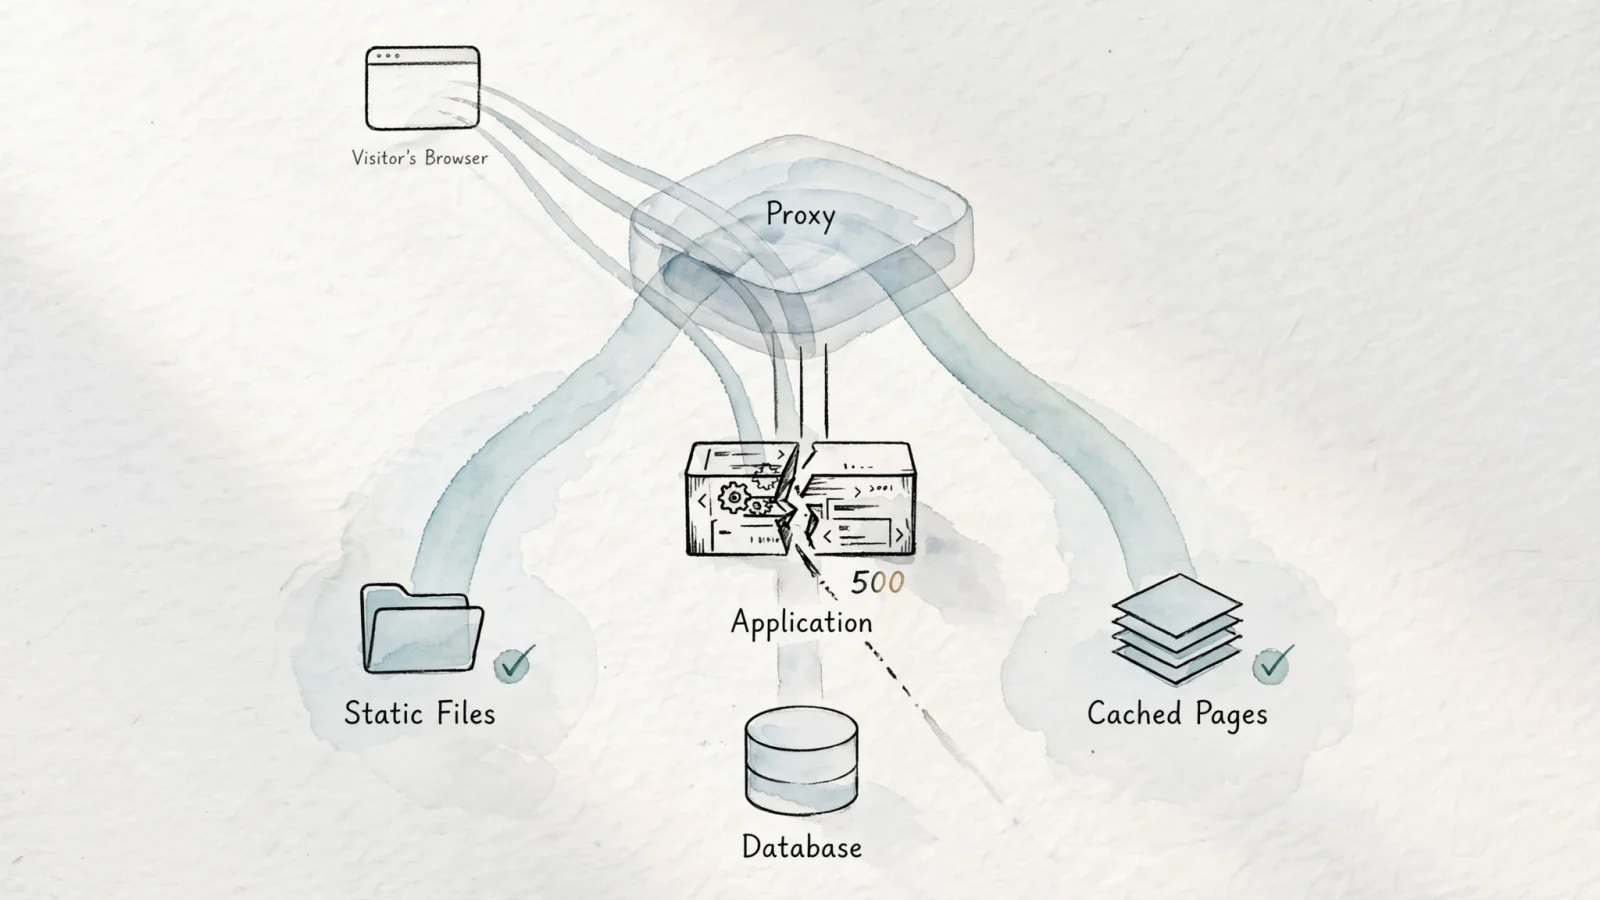
Distinguishing 500 Errors From Other 5xx Status Codes
HTTP clients, including browsers and web crawlers, determine what to do next based on received status codes and content. The HTTP Semantics standard defines status codes that describe responses and places requirements on roles including clients, servers, proxies, and gateways.
| Status Code | Meaning | Practical Interpretation |
|---|---|---|
| 500 Internal Server Error | The server encountered an unexpected condition and could not fulfill the request. | Investigate application code, configuration, permissions, memory, or local dependencies. |
| 502 Bad Gateway | A gateway or proxy received an invalid response from an upstream server. | Inspect the reverse proxy, upstream application formatting, or network path. |
| 503 Service Unavailable | The server is temporarily unable to handle the request due to overload or maintenance. | Use for known temporary outages. Include a Retry-After header. |
| 504 Gateway Timeout | A gateway or proxy did not receive a timely response from an upstream server. | Inspect upstream latency, long-running queries, queues, and network timeouts. |
Choose the status code that matches the failure. If you take a database offline for scheduled maintenance, configure your proxy to return a 503 Service Unavailable, which tells search engines to keep their current index and try crawling again later. If a reverse proxy waits too long for an application worker to finish rendering a page, return a 504 Gateway Timeout to direct your investigation toward slow queries rather than broken application logic.
Never return a 200 OK status for a failed page to display a friendlier error screen. Disguising a failure as successful content trains search engines to index your error messages and breaks automated monitoring tools that rely on accurate status codes to trigger alerts.
Where to Look for the Cause of a 500 Server Error
Organize your investigation into structural buckets, because 500 errors can have multiple causes. Developer documentation identifies improper server configuration, unhandled exceptions, and improper file permissions among those possible causes.
Application and Deployment Failures
Application logic causes the majority of unexpected server errors. You will often find unhandled exceptions, rejected promises, or invalid user input that bypasses validation and reaches an unexpected code path. For example, a failed template render caused by a missing variable passed from a controller will crash the request. Deployment failures happen when code requires an environment variable that is missing in production, or when an incompatible dependency upgrade introduces breaking changes. Similarly, database migrations that rename a column before the new code finishes deploying will trigger 500 responses on queries referencing the old schema.
Resources, Permissions, and Dependencies
Servers run out of capacity. Out-of-memory conditions prompt the operating system to kill processes, resulting in dropped connections or generic 500 errors from the remaining workers. When worker pools and file descriptors are exhausted or disks are full, the application can no longer open new files or accept new network requests.
Permissions frequently break after migrations or server upgrades. If the application user lacks the necessary access to read a template directory, write to a cache folder, or access uploaded media, the resulting file-system error becomes a 500 response on the visitor's screen.
Dependencies fail independently of your application. When a database connection drops, a caching layer evicts required data, a message queue fills up, or a third-party payment API times out, your application needs to handle that failure gracefully. Without proper error handling to catch the dependency timeout, the framework converts the resulting crash into a 500 server error.
Proxy and Upstream Confusion
Modern infrastructure routes requests through Content Delivery Networks (CDNs), load balancers, and reverse proxies like NGINX before hitting the application. A misconfigured proxy might fail to parse the upstream response, or the application might send headers that exceed proxy buffer limits. While these issues often surface as 502 Bad Gateway errors, internal application proxies catching timeouts or invalid formatting can map them back to generic 500 responses.
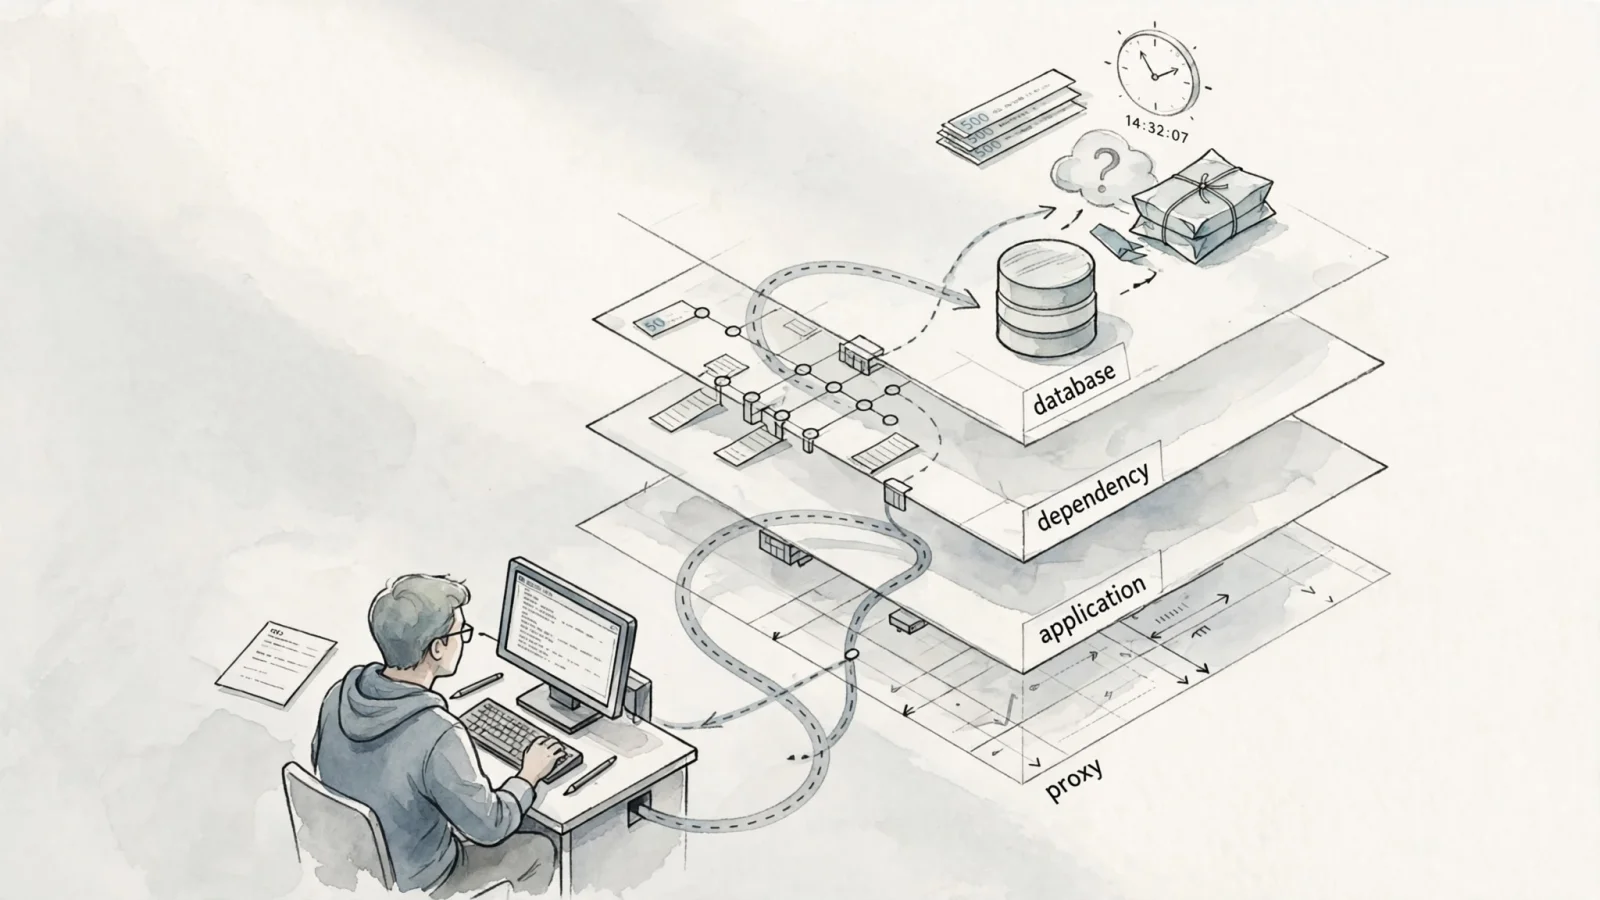
Steps to Troubleshoot a 500 Server Error
Treat every 500 error as an evidence-gathering exercise. Before restarting services, capture the current evidence, because a restart can destroy memory state and erase the context of the failure. Reading about causes and fixes for an HTTP 500 error ahead of time helps build a standard incident response playbook.
Confirm the Response and Scope
Because the browser's visual wording often masks the true HTTP status, capture the actual response headers from a terminal using curl.
To see the headers and the body:
curl -i https://example.com/problematic-path
To see only the headers without downloading a massive error payload:
curl -sS -D - -o /dev/null https://example.com/problematic-path
Check the HTTP status, the format of the response body, and whether a CDN, reverse proxy, or the origin server generated it to define the scope of the incident. You can test one route versus the whole site, or request a static file to see if the web server is completely down compared to only dynamic processing failing. Finally, test anonymous flows against authenticated flows, and check if the error only occurs on POST requests or API methods.
Correlate Logs, Changes, and Dependencies
Trace the request backward from the edge to the database, starting with the timestamp, the failing route, the request method, and the client IP. Search your CDN or load-balancer logs to confirm the request reached your infrastructure before checking your reverse-proxy error logs for upstream connection failures.
Next, open the application logs and look for a stack trace matching the exact timestamp of the failed request. If your application logs a request or correlation ID, use it to search across your database, cache, and internal API logs.
Inspect recent changes by comparing the failing request timing against the last known-good deployment. Review environment variables, runtime changes, schema migrations, and recently toggled feature flags. A rollback can restore service quickly, but you should preserve the original error details and logs beforehand, because a successful rollback restores availability without explaining why the failure happened.
Fix, Verify, and Watch for Recurrence
Apply a specific corrective action based on the evidence, whether that involves handling an exception in the code, correcting a missing configuration value, or changing ownership of the cache directory. You might also need to increase the memory limit for the container or disable a failing third-party feature flag.
After applying the fix, verify the exact original URL and method through the public network path. Test a known healthy route to ensure the fix did not break neighboring functionality, and monitor the application logs for recurrence after the next traffic spike or deployment cycle.
Building a Safe Custom Error Page
A raw 500 error page generated by an application framework often leaks sensitive infrastructure details, so a custom error page needs to balance helpful public messaging with secure internal diagnostics.
Give Visitors a Useful, Generic Response
Retain the actual HTTP 500 status code on the custom page, but give visitors a calm explanation that the request failed alongside a safe retry or navigation option. Include a link to a status page or support channel, and display a generated request or incident ID on the screen so the user can send it to your support team.
For APIs, return a small, machine-readable JSON response instead of an HTML page.
{
  "error": "Internal Server Error",
  "requestId": "a1b2c3d4-5678-90ef"
}
Security guidelines from OWASP recommend generic error messages for users and advise against exposing sensitive information in error responses. The guidance says not to expose debugging or stack trace information, system details, session identifiers, or account information.
Keep Diagnostics in Protected Logs
Centralize your error handling in middleware using frameworks like Express, which allow you to catch failures consistently, log the exact details to a secure internal system, and return the safe public response shown above.
Internal records should include the exact timestamp, correlation ID, route template, HTTP method, release identifier, exception class, sanitized dependency context, and the relevant status code. This separation ensures developers have the stack trace they need to fix the bug without turning a crashed request into a data breach.
SEO Impact of Internal Server Errors
Google's crawling documentation states that 5xx responses temporarily slow crawling, and says that Google decreases the crawl rate for a site returning a 500 error, with the decrease proportionate to the number of individual URLs returning a server error.
Google ignores any content received from a URL returning a 5xx status. If URLs persistently return server errors over an extended period, Google eventually removes them from the search index entirely. The crawl-rate reduction relates directly to how many individual URLs return server errors, so a brief, isolated failure on a single route has a negligible impact. Conversely, repeated, sitewide errors prevent Google from processing updated content and damage search visibility, though crawling gradually increases back to normal levels once successful 200 OK responses resume.
Verifying Recovery for Important URLs
After an incident, confirm the recovery using an HTTP status bulk checker to verify that affected URLs return the intended 200 OK status through the actual CDN and origin path. You should also review server logs for continued 500 responses that might be triggering intermittently.
Inspect critical URLs in Google Search Console to ensure the crawler sees the recovered page. Confirm your custom error page is not accidentally returning a 200 OK status, which creates soft 404s or error-message indexing issues. Preserve the original URL when the content still exists, rather than creating replacement URLs because a temporary outage occurred.
Measure Search and Conversion Impact
Compare organic clicks, impressions, average position, referral traffic, and conversions before and after the incident. Swetrix’s SEO dashboard combines Google Search Console data with referral analytics and page-level performance. Because Search Console processing takes one to two days, rely on server logs and real-time error instrumentation during the active incident, and use the SEO reporting dashboard afterward to measure the long-term impact of the downtime on your organic traffic.
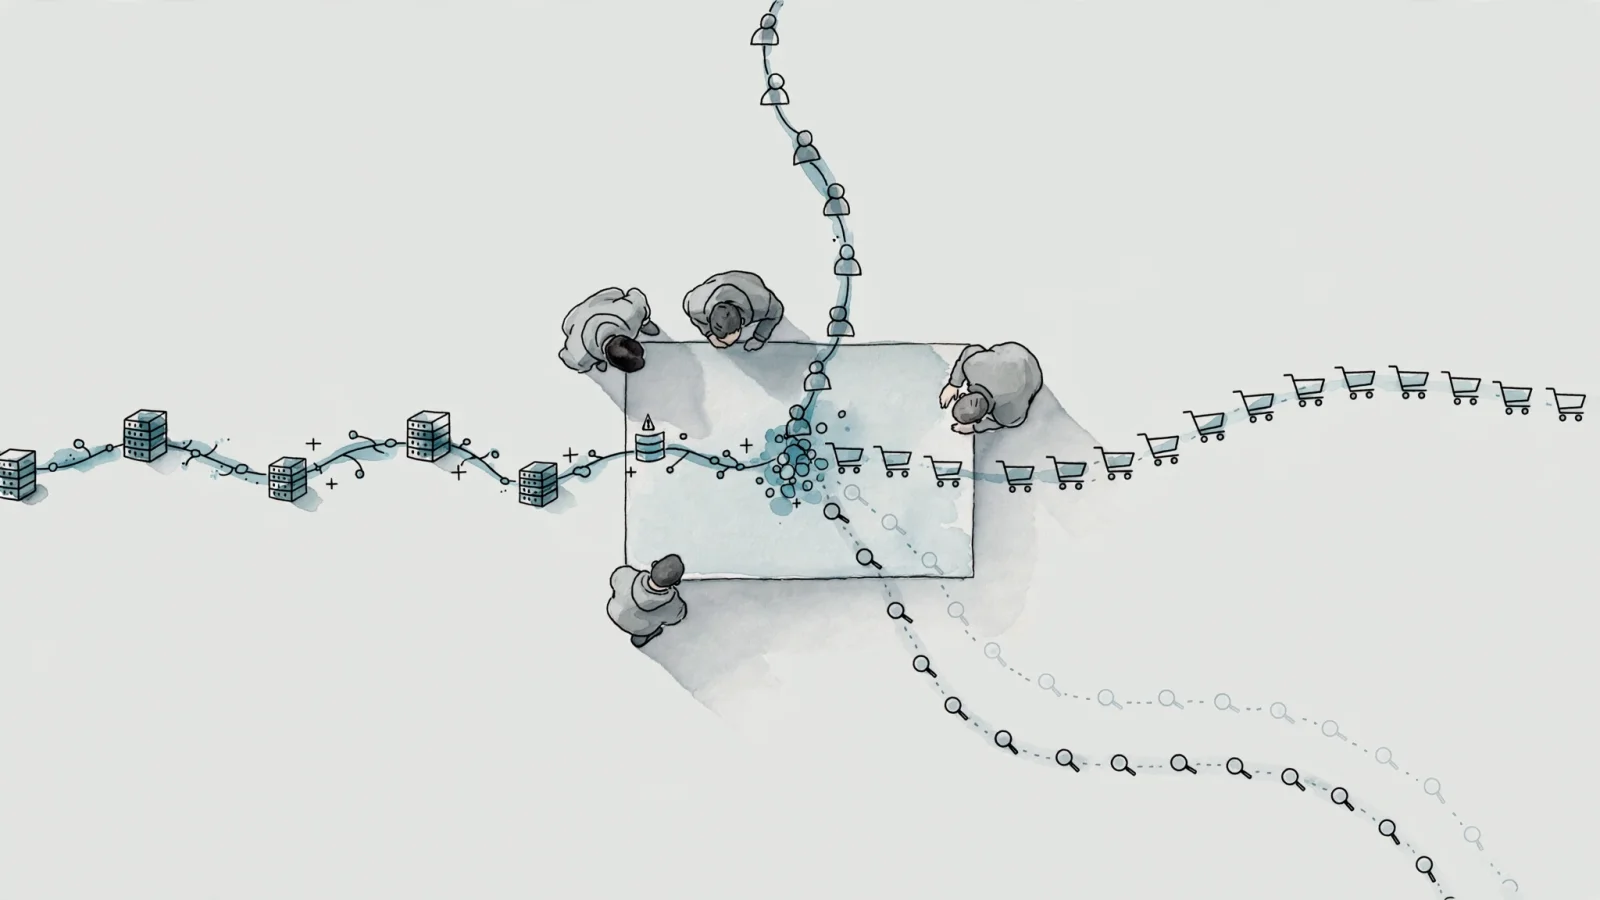
Monitor 500 Errors With Privacy in Mind
Because analytics and error monitoring usually exist in separate silos, centralizing this data requires dedicated error tracking that handles both server-side exceptions and client-side JavaScript failures without violating user privacy.
Cover the Server and Browser Layers
Swetrix functions as a complementary monitoring layer alongside your application logs. Using the Swetrix Express integration and the @swetrix/node package lets you report backend failures directly from your centralized error middleware. This approach allows you to send sanitized context, like an error class, route template, release identifier, and request ID, while the application returns the controlled 500 response to the visitor.
For errors that occur in the browser after a page loads, use the trackErrors() capability to capture the error name, message, file, line, column, stack trace, and session context. The capability applies filtering before transmission to remove sensitive DOM data. Covering both layers is necessary because a hard origin failure happens before HTML and browser analytics arrive, making server-side instrumentation mandatory for complete coverage.
Connect Failures to User Impact
Once data flows from both sides of the stack, break down the failures by page, device, browser, and affected session. Compare spikes in server errors with drop-offs in signups, purchases, form submissions, and checkout completions. Identifying that a specific server error blocked fifty checkout attempts provides more business context than seeing fifty generic crashes in a terminal log.
Session replay tools help visualize how users react to failed routes, though you need to keep privacy requirements in focus. Because replays can capture page content and non-password input values, implement strict masking rules, manage consent, establish a legal basis, and enforce data minimization policies separately from basic traffic analytics.
Frequently Asked Questions
What does a 500 error mean? It means the server encountered an unexpected condition and could not complete the request. It is a generic response indicating a failure somewhere in the application, configuration, or local environment.
Is a 500 error my fault as a visitor? No, because a 500 status indicates a server-side error. While bad input can sometimes trigger a poorly written application to crash, the failure belongs to the server for not handling the input gracefully.
Will refreshing fix a 500 error? Usually no, unless a transient server issue or brief deployment interruption has already cleared.
What is the difference between 500 and 503? A 500 means something unexpectedly broke, whereas a 503 Service Unavailable means the server cannot handle the request right now, typically due to known scheduled maintenance or severe overload.
Can a 500 error hurt SEO? Yes, as Google temporarily slows crawling when it encounters 5xx responses. Persistent errors prevent Google from reading your content and can lead to URLs dropping out of the search index.
Should a custom error page return 200 or 500? It needs to return a 500 status code. Returning 200 OK tells browsers and crawlers the request succeeded, creating misleading analytics data and causing search engines to index your error message as valid content.
Can browser analytics detect every 500 error? No, because if the server crashes before it sends the HTML document, the browser tracking script never loads. You need server-side logging or backend instrumentation to catch those failures.
Which logs should I check first? Start with the CDN and reverse-proxy logs to confirm the request reached the application, then check the application error logs for stack traces.
See exactly where errors happen, understand which visitors they affect, and connect technical failures directly to your conversions and search performance. Start building a faster, more reliable website with privacy-first analytics at Swetrix.