- Date
HTTP 500 Internal Server Error: Causes, Fixes, and SEO Impact
 Andrii Romasiun
An HTTP 500 response means the server handling a request encountered an unexpected problem. The status code indicates a failure on the server side, but it does not diagnose the root cause, so it serves as a generic signal that something broke between the initial request and the final output.
When diagnosing an internal server error, your primary tools are application and infrastructure logs, but measuring the exact impact of those failures involves a different approach. Swetrix provides a privacy-first context layer that connects server-side failures with traffic, conversion, and SEO signals, helping you measure the business cost of an outage while keeping your application logs secure.
What HTTP 500 Means
The Internet Engineering Task Force's RFC 9110: HTTP Semantics describes HTTP as an application-level protocol whose semantics include status codes that describe responses. HTTP presents a uniform interface without defining what occurs behind it, so a status code alone does not identify the underlying cause.
Because the status code lacks specificity, it functions as a generic catch-all response. The MDN web docs explain that servers use this code when they cannot find a more specific 5xx status to return, and they list improper server configuration, out-of-memory issues, unhandled exceptions, improper file permissions, and other complex factors as possible causes.
A single response does not necessarily mean your entire infrastructure is down. A failure can isolate itself to a specific route, a single HTTP method, one tenant in a multi-tenant application, a recent deployment, or a specific region. Unauthenticated visitors might load a cached page perfectly while authenticated users hit an internal server error upon logging in. Locating the broken layer determines how quickly you can restore service.
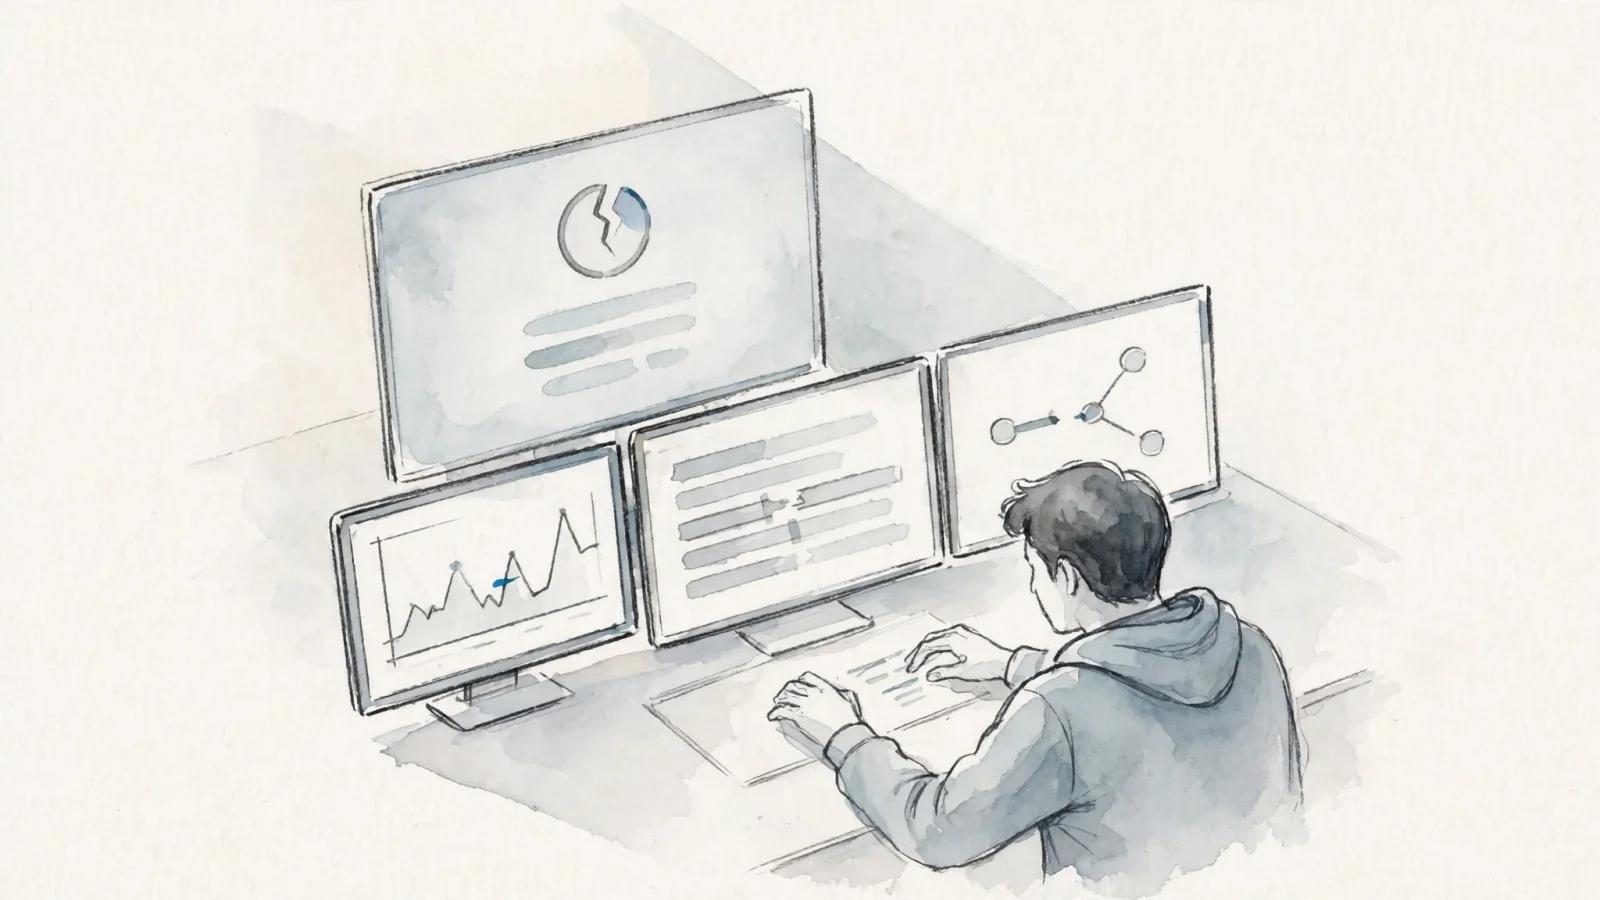
The Most Common Causes of HTTP 500
Grouping potential causes by diagnostic category gives you a place to start. Server-side failures generally fall into application exceptions, external dependencies, or infrastructure configuration.
Application Exceptions and Bad Input
Within that category, code-level exceptions are a common cause of internal server errors. If a route handler encounters a null or undefined value where it expects an object, it can throw an exception or produce an invalid response. Parsing malformed JSON, receiving an unexpected input type, or failing to serialize a complex object can also surface as an error, and the application may return 400 or 500 depending on how it handles the failure.
In Node.js applications, unhandled promise rejections or middleware failures can surface as server errors. Whether the process exits or the framework returns a 500 depends on the runtime and framework configuration, so logs should establish what happened instead of relying on the status code alone.
Dependencies, Configuration, and Resources
A route can fail when it cannot connect to needed external services, for example because of a database connection timeout, failed authentication with a primary data store, or an unreachable payment or email provider.
Configuration mistakes often surface after a deployment. A production secret might be missing from the environment variables, or a database URL might point to a deprecated cluster. Feature flags with invalid values, unapplied database migrations, missing dependencies, or runtime version mismatches also prevent the application from starting or processing requests.
Resource exhaustion causes unpredictable failures even when the application code is sound. An out-of-memory condition can kill the active process, while exhausted connection pools can block new database queries. Operating systems impose limits on open file descriptors, CPU execution time, and disk space. A traffic spike can trigger these limits, but a memory leak can exhaust resources even under normal load.
Permissions, Rewrites, and Edge Failures
Incorrect file ownership or strict system permissions prevent the web server from reading required files or executing CGI scripts. This can occur in PHP environments or when managing generated cache directories.
Routing rules create their own class of failures. A poorly written regular expression in a reverse proxy can create an internal redirect cycle, which the server may abort with an error response.
Edge architecture introduces another boundary. A content delivery network might generate the error directly if an edge worker fails. Alternatively, the proxy might successfully reach the origin, receive a 500 response, and pass that origin-generated error straight to the visitor.
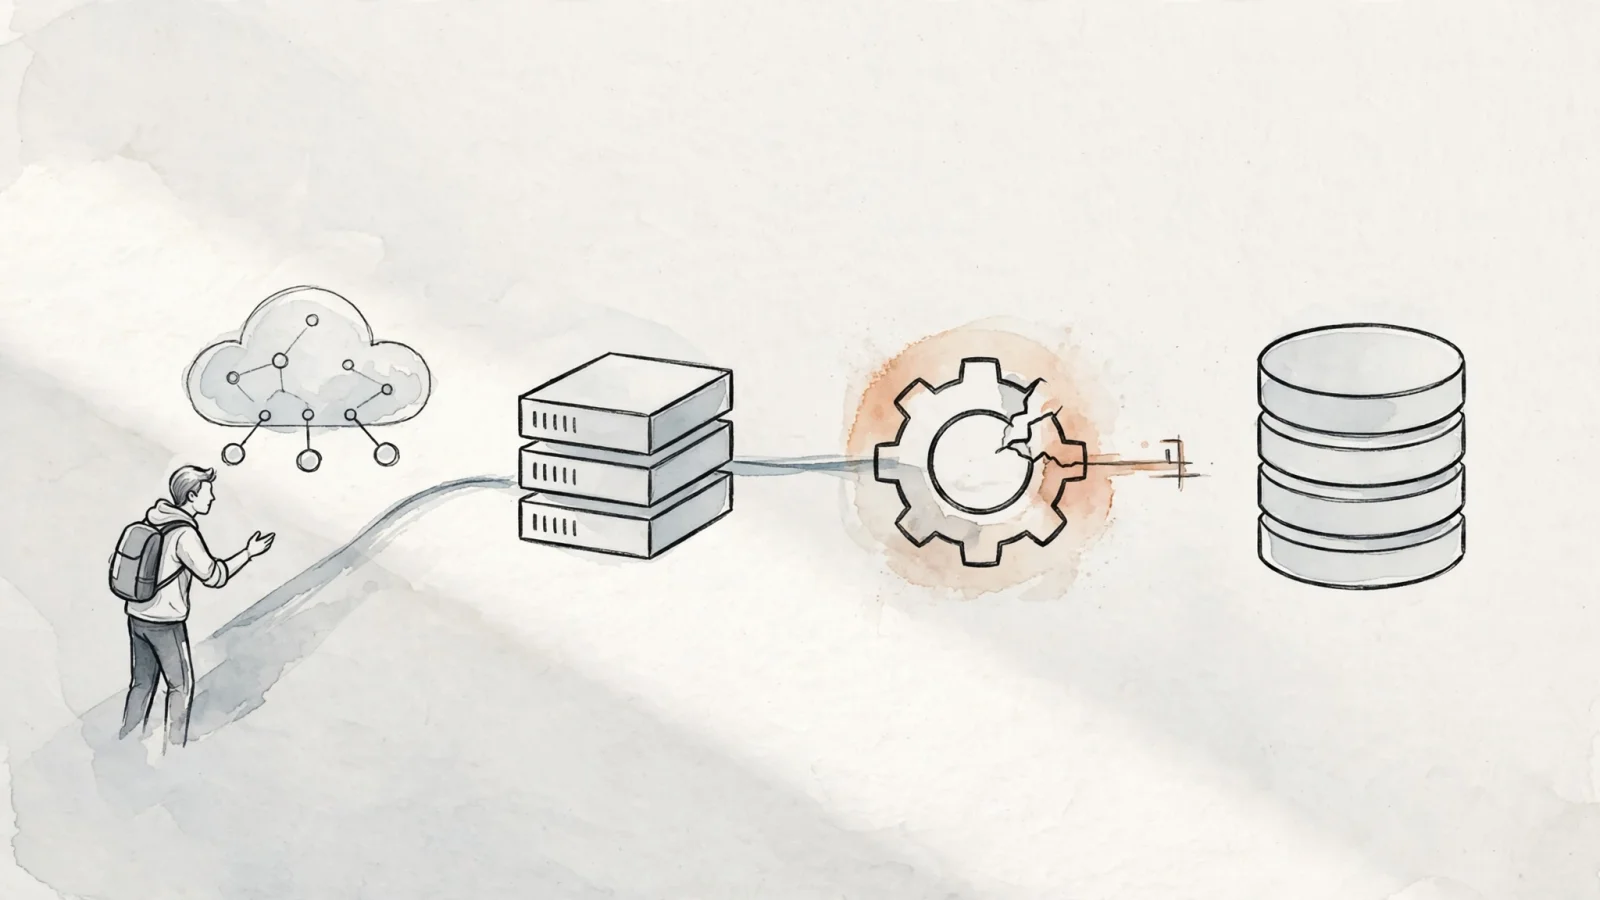
A Practical Workflow for Fixing HTTP 500
Resolving a server failure involves isolating the exact request, identifying the failing layer, correlating the timestamp with system logs, and checking that the repair worked.
Confirm the Response and Its Scope
To start, capture the exact response headers and body. You can use a command-line tool to display them:
curl -i https://example.com/failing-path
If you want to discard the response body and print only the status code, use:
curl -sS -o /dev/null -w '%{http_code}\n' https://example.com/failing-path
Record the complete URL, path, HTTP method, exact timestamp, timezone, and response status. Look for a request ID in the headers and identify the active deployment version, then test whether authenticated and unauthenticated requests behave differently. Never publish authorization headers, passwords, session tokens, or sensitive request bodies in a public bug tracker or internal communication channel.
Find the Failing Layer in Logs
Determine whether the application, web server, load balancer, CDN, or edge function generated the response. Branded CDN error pages or provider-specific headers offer clues, but you still need to check the origin's behavior. If safe, send a controlled request directly to the origin server, bypassing the proxy, to see if the origin itself is failing.
Review web server logs before rewriting application code. For Apache, run syntax checks and tail the error log:
apachectl -t
tail -f /var/log/httpd/error_log
For NGINX, test the configuration syntax and watch the output:
nginx -t
tail -f /var/log/nginx/error.log
If you use containerized deployments, inspect the standard output and standard error of the running container:
docker logs <container-name>
Once you locate the general failure, search your application logs using the timestamp, route, HTTP method, request ID, or error signature, and compare them against the web server logs.
Check Recent Changes and Verify the Fix
Infrastructure failures often follow a recent change or capacity event. Compare the timestamp of the first failure with your recent deployment history, looking for configuration changes, dependency updates, database migrations, DNS modifications, CDN rule changes, secret rotation, or runtime updates. If the impact is severe and the error began immediately after a deployment, a controlled rollback can restore service while you investigate the root cause offline.
After deploying a fix, repeat the original request. Test nearby routes, alternative HTTP methods, and both authentication states while checking the application logs to ensure no silent exceptions remain. Read your framework's error-handling documentation to ensure your custom error pages preserve the correct status code. That matters because, for Google Search, returning a 200 OK on a page that says "Something went wrong" leads Search Console to show a soft 404.
Replace detailed stack traces with safe public error responses, outputting a static message and a request ID that visitors can share with your support team. Store the raw database strings, secrets, and internal file paths only within restricted server logs.
HTTP 500 vs Other Status Codes
Diagnosing web failures relies on understanding the precise boundaries between client, server, and proxy. The HTTP protocol assigns specific status blocks to different failure types.
| Status | Meaning | Diagnostic focus |
|---|---|---|
400 Bad Request | The server cannot process the request due to invalid syntax or input. | Request validation, payload structure, missing parameters. |
404 Not Found | The server cannot find the requested resource. | URL routing, deleted content, missing files. |
500 Internal Server Error | The server encountered an unexpected condition. | Application exceptions, configuration, resources. |
502 Bad Gateway | A gateway or proxy received an invalid response from an upstream server. | The network boundary between the proxy and the origin. |
503 Service Unavailable | The server is temporarily unable to handle requests. | Overload, scheduled maintenance, scaling events. |
504 Gateway Timeout | A gateway did not receive a timely response from an upstream server. | Upstream latency, database locks, slow network connections. |
The boundary between 500, 502, and 504 relies on reverse proxies. If your application process crashes while processing a request, NGINX might return a 502 because the upstream process closed the connection unexpectedly. If the application takes longer than the proxy's configured timeout to format a massive report, the load balancer might return a 504.
For planned maintenance or known temporary overload, configure your server to return a 503 Service Unavailable response that communicates the temporary condition rather than letting the application crash.
How HTTP 500 Errors Affect SEO
Search engines interpret server errors as signals about technical health and crawl capacity. Google’s automated systems adjust their behavior based on the frequency and persistence of these responses.
What Google Does With Persistent 5xx Responses
According to Google Search Central's HTTP status guidance, 5xx responses prompt Google's crawlers to temporarily slow their crawl rate. For 500 responses, the reduction is proportionate to the number of individual URLs returning server errors.
Google ignores content returned alongside a 5xx response. Its status-code guidance says already indexed URLs are preserved at first, but URLs that persistently return server errors are eventually removed from the index.
When 503 Is Better for Maintenance
Scheduled maintenance calls for clear communication with automated crawlers, so choose a response that reflects the service's temporary condition.
Recovering Search-Critical URLs
After resolving a widespread server outage, you can use an HTTP status bulk checker to scan search-critical URLs and confirm they return a 200 OK.
Check your Search Console crawl reports to see if Google encountered the errors, and inspect affected URLs using the URL Inspection tool to confirm the live status code. If content or routing changed during the fix, update your XML sitemap. You can request a recrawl for a small number of critical pages, then monitor Search Console for the result.
Connecting server errors to business impact demands a clear workflow. Identify the routes that experienced elevated server-side errors, compare them with your organic landing pages, and review your Search Console metrics for drops in clicks or impressions. Monitor your conversion funnels to see exactly which visitor journeys the outage disrupted.

Monitor HTTP 500s Before They Spread
A server process can crash long before browser-based JavaScript executes. If your analytics system relies entirely on client-side tags, a broken backend route often results in a measurement gap: the visitor sees an error screen, but the analytics payload never fires.
Combine Server-Side and Client-Side Signals
Server-side monitoring identifies requests that fail before returning a usable application state. Client-side tracking adds visibility into JavaScript failures after a page reaches the browser. Combining both signals helps separate backend infrastructure outages from frontend browser incompatibilities.
Swetrix bridges this measurement gap as a privacy-focused, server-side alternative to traditional analytics. It tracks events on the server without depending on browser execution, so you can continue collecting server-side error data when visitors disable JavaScript or client-side blockers interfere with browser requests.
Connect Errors to Traffic, Conversions, and SEO
Sending server-side error events to your analytics platform connects technical telemetry with product behavior. Rather than sifting through raw access logs to guess how an outage affected campaigns, you can see error events alongside traffic sources and custom conversions.
The official Swetrix Express integration allows you to capture these errors in middleware before returning the standard HTTP status.
app.use((err, req, res, next) => {
  swetrix.trackError(req.ip, req.headers["user-agent"], {
    name: err.name || "Error",
    message: err.message,
    stackTrace: err.stack,
    pg: req.path,
  });

  res.status(500).json({
    error: "Internal Server Error",
  });
});
Using this integration groups events by route, error type, and safe operational metadata. Review the context from the GSC export analyzer to correlate these tracked server errors with specific ranking drops or missing index data.
Keep Error Data Useful and Private
When passing diagnostic data to an analytics platform, practice strict data minimization. Never send request bodies, plain-text passwords, authorization headers, or payment details, and filter out sensitive query parameters before logging URLs. Keep full, unredacted stack traces locked inside restricted infrastructure logs, passing only the error class, release ID, and affected route to your product analytics dashboard. This keeps the analytics payload narrow while still giving your marketing and engineering teams the context they need.
HTTP 500 FAQ
Is HTTP 500 My Browser’s Fault?
No. The status indicates a problem in the server-side request path. A visitor can retry the request once and report the exact URL and timestamp to support, but resolving the issue involves action from the site owner, developer, or hosting provider.
Can Refreshing Fix a 500 Error?
A page refresh occasionally succeeds if the underlying problem was a transient dependency failure, a temporary lock, or an overloaded process that has since recovered. However, refreshing does not identify or repair the root cause. If the error repeats consistently, the server requires administrative investigation.
Can a Database or CDN Generate It?
Yes. A failed database connection is a common backend dependency issue that surfaces as an internal server error. A Content Delivery Network or edge proxy might generate the response itself if an edge worker crashes, or it might pass through a failure generated by the origin server. Checking response headers, edge logs, and conducting direct origin tests will separate proxy failures from origin crashes.
Stop flying blind when your backend infrastructure fails. Swetrix connects server-side error monitoring with privacy-first traffic, conversion, and SEO data, giving you a clearer picture without relying on client-side tracking. Start monitoring your critical routes today at Swetrix.com.