- Date
500 Internal Server Error: Causes, Fixes & SEO Impact
 Andrii Romasiun
Seeing “500 internalservererror”? Start Here
Visitors encountering a broken page often search for the exact string they see, typing "500 internalservererror" into their browser to diagnose the failure. The standard technical name for this response is the 500 Internal Server Error, a server-side fault indicating that a backend component encountered an unexpected condition and could not fulfill the request.
The Standard Name: 500 Internal Server Error
As a generic catch-all belonging to the 5xx class of status codes, this response communicates that the server encountered an unexpected condition while processing the request and could not fulfill it. The status code alone cannot diagnose the problem, confirming only that the failure occurred somewhere in the backend infrastructure rather than on the visitor's device.
The underlying fault could live in the application code, the server configuration, a reverse proxy, the database layer, or a third-party dependency. Identifying the failing component requires investigating the specific request path.
What the Status Code Tells You and What It Does Not
HTTP status codes describe server responses, and clients examine them to determine whether a request succeeded. The authoritative RFC 9110 specification explains that each server response includes a status code. Because browsers and spiders are HTTP user agents, they can use those standardized codes to interpret the response.
Fixing the failure requires two distinct perspectives: engineering teams rely on server and application logs to pinpoint the exact backend fault, while product teams need to understand how the crash affects site visitors. Swetrix provides this second layer of visibility. While server logs record the technical failure, privacy-first analytics reveal the user impact by showing exactly which conversion funnels, landing pages, and traffic campaigns were disrupted by the downtime.

If You’re a Visitor, Try These Safe Recovery Steps
Encountering a server error interrupts your intended task, so your immediate goal is to determine if the failure was a temporary glitch without making the situation worse.
Retry a Safe Request Once
HTTP separates requests into safe and non-safe methods. Reading a blog post or loading a product page relies on a safe GET request, which is idempotent. Repeating these requests multiple times yields the same result without altering backend data. If you see a 500 error while browsing an article, waiting a few minutes and refreshing the page once is a reasonable step, because temporary load spikes or momentary database restarts often resolve themselves quickly.
Avoid automatically retrying non-idempotent requests. Submitting a payment, completing a signup form, or placing an order forces the server to process a state-changing action. If the server processed your payment but failed to generate the confirmation page, refreshing your browser might submit a duplicate charge. Check your email for a confirmation receipt or verify your account dashboard before attempting the transaction a second time.
Record the Failure and Avoid Duplicate Submissions
When a safe retry fails, document the context. Site owners cannot fix errors they cannot reproduce, meaning vaguely reporting a broken site provides no diagnostic value. Record the exact URL, the time of the failure, your local timezone, the browser you used, and any specific error code or request ID displayed on the screen.
Send this documented information to the support team or site owner. If you manage a content platform, check whether a specific post fails while the rest of the site functions normally. You can then review Google Search Console to see if an important campaign page is returning errors to search engines, which provides concrete evidence to your hosting provider.
Site-Owner Workflow: Find and Fix the Failure
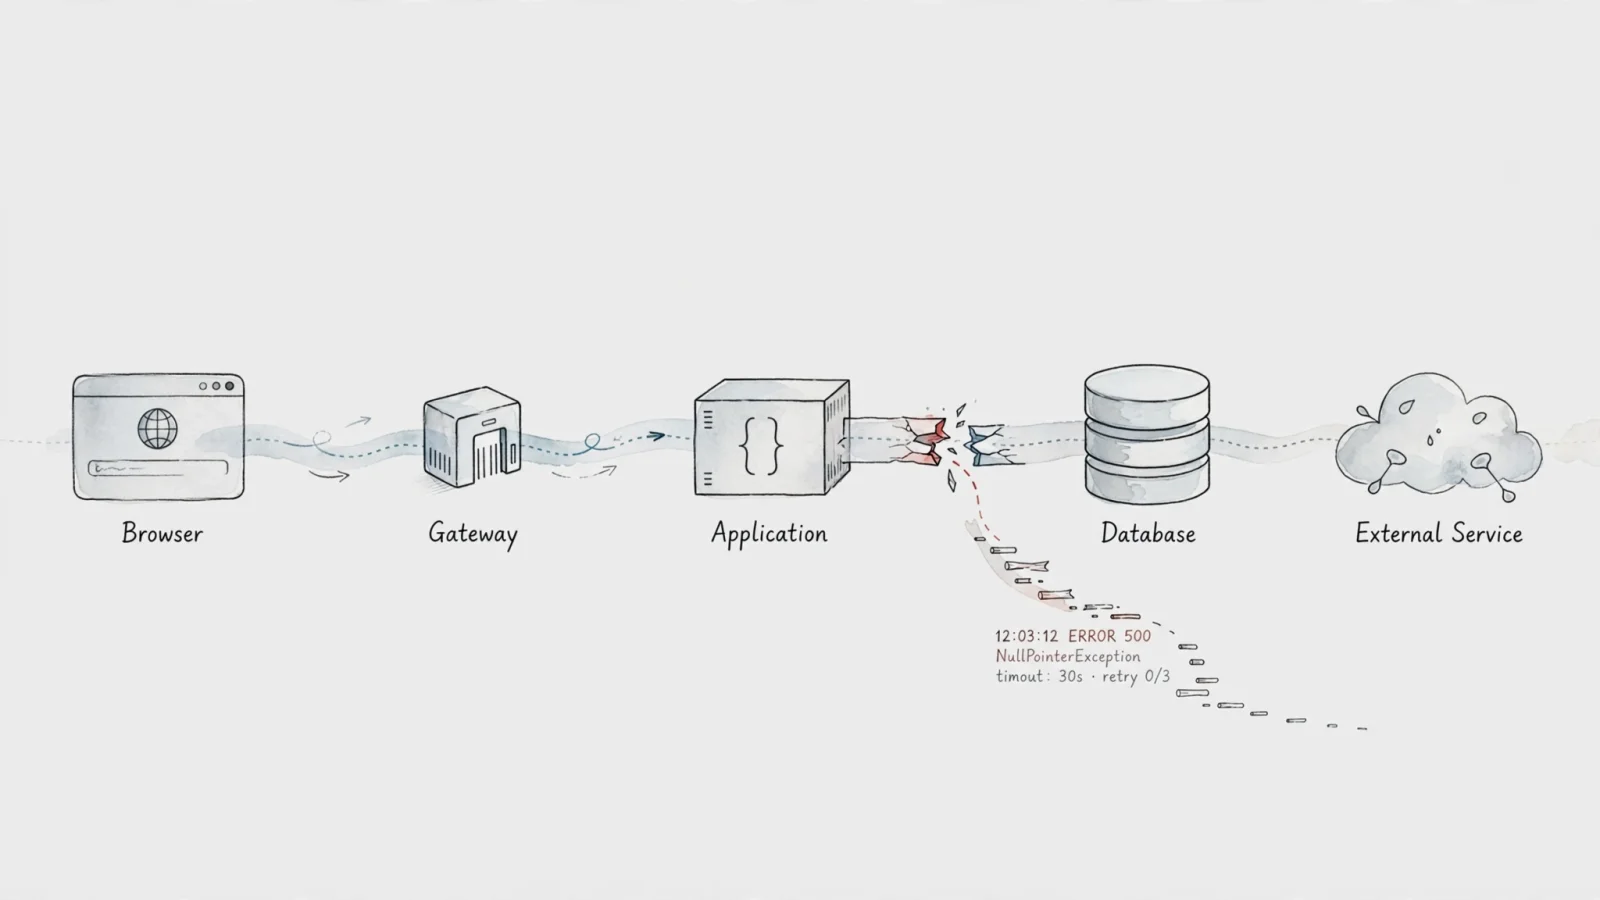
A reported 500 error triggers a diagnostic workflow designed to move from a generic symptom to a specific root cause by systematically ruling out layers of your infrastructure.
Reproduce the Request and Define Its Scope
Start by defining the blast radius of the failure, using the visitor's report to replay the exact URL and HTTP method. If the failure is intermittent, note the time and check whether it coincides with a traffic spike or an automated background job.
Determine the exact scope by testing different paths. A failure affecting the entire domain usually points to infrastructure or deployment issues, while an error restricted to a single landing page suggests a problem with that specific template or content record. Identify whether the error triggers for anonymous visitors, authenticated users, or specific account roles, which prevents you from tearing down web servers when a broken image link is the real culprit.
Trace Each Layer and Inspect the Logs
Modern web requests travel through multiple layers before returning a response. The visible 500 page gives no indication of which layer failed, so check the logs at each step in the path.
Begin at the edge by checking your Content Delivery Network or reverse proxy to confirm whether the request reached your origin. Next, inspect the web server logs to see if the request was successfully forwarded to your application runtime. If the web server logged an upstream failure, examine the application logs for unhandled exceptions before verifying the health of your database connections, cache servers, message queues, and external APIs. Running affected URLs through an Http Status Bulk Checker verifies whether specific routes return 500 consistently across different endpoints.
Compare Changes, Repair, and Validate
Errors rarely appear spontaneously. They usually follow a system change. Review your recent deployments, environment variable updates, and dependency upgrades to identify altered routing rules, modified database schemas, or recently rotated API secrets.
After identifying the discrepancy, deploy a fix or roll back the recent change. Validate the repair by replaying the original request, testing the related routes, and confirming that both anonymous and authenticated sessions function as expected. Development teams supporting multi-tenant architectures should log the endpoint, method, environment, and non-identifying tenant context to verify that systems route data securely after the patch.
Common Causes of HTTP 500 Errors
Because a 500 status is a generic catch-all, diagnosing the underlying issue involves considering multiple possible system causes. The MDN technical reference lists possible causes such as unhandled exceptions, improper server configuration, out-of-memory conditions, and improper file permissions.
Application and Configuration Failures
Application bugs remain a frequent cause of server errors. A missing environment variable crashes an application on startup, returning a 500 error for every page on the site. Syntax errors in a configuration file prevent a web server from routing traffic correctly, while incompatible dependencies or broken feature flags introduced during a recent deployment trigger immediate application-layer failures.
Resource and Access Problems
Servers operate within strict hardware limits, triggering 500 errors through memory exhaustion, CPU saturation, and full disks when the application can no longer allocate resources to process incoming requests. Exhausted database connection pools cause applications to hang and eventually crash during traffic spikes. Incorrect file permissions prevent the web server from reading template files or writing to local logs, resulting in persistent application or routing failures.
Dependency and Route-Specific Failures
Application logic can function perfectly while a dependency fails. If a third-party payment gateway times out or a managed database cluster rejects a query, the application must handle the failure gracefully. Lacking proper error handling, the unhandled exception bubbles up to the user as a 500 error.
To streamline your investigation, use diagnostic heuristics based on the symptoms:
| Observed Symptom | Likely Investigation Path |
|---|---|
| Every page returns 500 | Check application boot logs, server configuration, and global database connectivity. |
| One route or page returns 500 | Inspect route-specific code, template logic, and specific content records or payloads. |
| Form or checkout failure | Verify validation rules, database write permissions, and third-party payment service health. |
| Failure follows a release | Compare recent code changes, missing secrets, and dependency mismatches; initiate a rollback. |
| Intermittent load failures | Monitor memory limits, CPU usage, connection pool exhaustion, and queue backlogs. |
Reviewing the 500 Server Error Meaning Explained provides broader context on backend architecture behavior and terminology.
500 vs 502, 503, and 504
Sending an inaccurate incident report to an engineering team delays recovery. The 5xx class contains several distinct statuses that narrow down the investigation path to specific failure points.
What Each Status Code Suggests
While 500 acts as a generic failure bucket, related codes describe specific infrastructure states. A 502 Bad Gateway indicates that a server acting as a proxy received an invalid response from an upstream server. A 503 Service Unavailable means the server cannot handle the request temporarily due to deliberate maintenance or severe overload. A 504 Gateway Timeout occurs when a proxy server does not receive a timely response from an upstream service.
Choose the Investigation Layer
Understanding these distinctions directs your debugging efforts to the correct system component:
| Status Code | Meaning | Investigation Path |
|---|---|---|
| 500 Internal Server Error | Unexpected server-side condition. | Inspect application exceptions, configuration files, and recent deployments. |
| 502 Bad Gateway | Proxy received an invalid upstream response. | Check proxy-to-application communication and upstream server health. |
| 503 Service Unavailable | Temporary overload or maintenance. | Verify capacity limits, active maintenance modes, and Retry-After headers. |
| 504 Gateway Timeout | Upstream server failed to respond in time. | Investigate slow dependencies, long-running database queries, and timeout settings. |
500 Errors, SEO, and Real-User Impact
A server error damages more than the immediate visitor experience. When search engines encounter broken pages, they adjust their behavior to protect their indexes and avoid overwhelming struggling hardware.
How Google Treats Persistent 5xx Responses
Googlebot relies on HTTP status codes to govern its crawling operations. According to Google Crawling documentation, 5xx responses prompt Google's crawlers to temporarily slow down crawling, while 500 responses decrease the crawl rate in proportion to the number of individual URLs returning a server error.
Search engines ignore any content served alongside a 5xx error. If the errors persist over an extended duration, Google removes the affected URLs from the search index. A brief, isolated incident will not result in an immediate ranking penalty, but sustained downtime on landing pages degrades search visibility. Once the server begins returning successful 200 OK responses, Google gradually restores the normal crawl rate.
Why Returning 200 Can Create a Soft 404
Returning a page that tells users it doesn't exist with a 200 OK status code creates a soft 404, and such pages are excluded from Search. The Google Search Central troubleshooting guide also says that displaying or suggesting an error while returning a 200 status creates a poor user experience.
Google detects that the page lacks meaningful content and treats it as missing, dropping it from search results entirely. This approach also breaks automated monitoring tools, which receive a success code and fail to alert you to the broken page. Return the appropriate 5xx or 4xx status code when a failure occurs.
Connect Errors to Users and Conversions With Swetrix
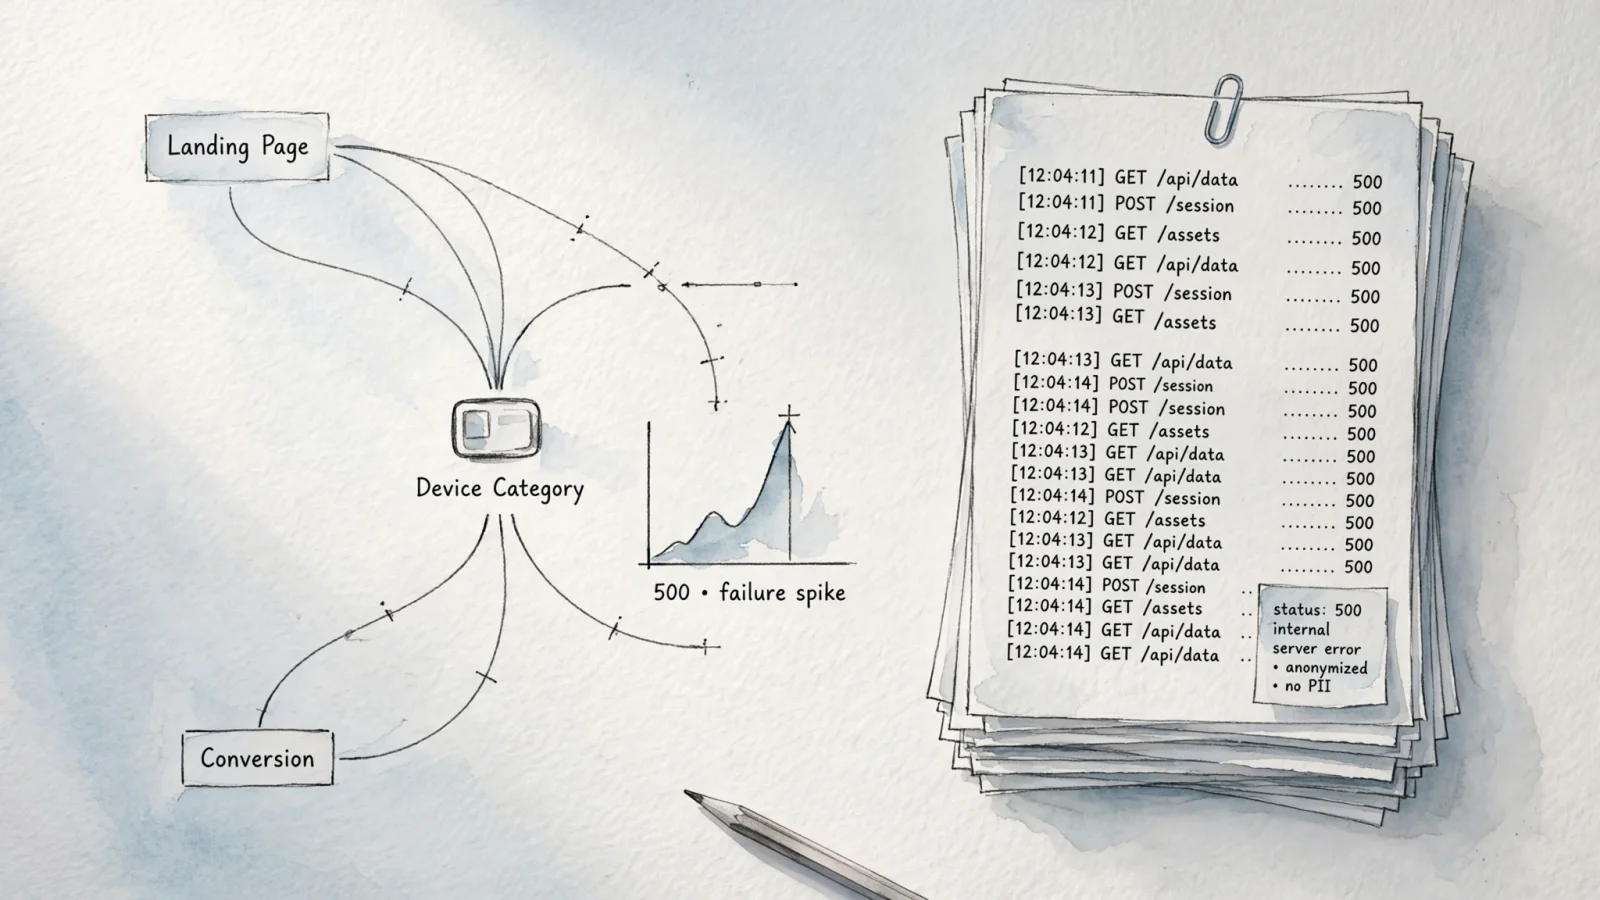
Server logs indicate which line of code triggered the failure, though they do not specify who was affected or what those users were trying to achieve. Swetrix acts as a privacy-first context layer that bridges the gap between infrastructure faults and business impact.
Using Swetrix's documented client-side trackErrors() flow captures unhandled browser exceptions and monitors the frontend symptoms of backend failures. The Error Tracking dashboard displays exact error details, organizing failures by page, device, browser, and geographic location without relying on intrusive cookie banners.
Comparing the timing of a backend 500 error against your conversion funnels reveals specific traffic drops. If a server log shows a database timeout at 2:00 PM, Swetrix reveals how many anonymous users abandoned their shopping carts or failed to complete a signup flow during that minute. Associating non-identifying metadata like release versions or environment names builds a complete picture of the failure's business cost while maintaining full GDPR compliance.
Prevent Recurring 500 Errors
Resolving a single server error solves the immediate crisis, but preventing the next one requires shifting your focus from reactive repair to proactive reliability.
Build Checks Around Releases and Dependencies
Automate your quality control before code reaches production. Implement release smoke tests that verify priority routes after every deployment. Validating configuration files and secrets during the build process ensures missing environment variables block the release rather than crashing the live application.
Treat database migrations with strict scrutiny, verifying schema changes against a staging environment to prevent lock-ups on large production tables. Third-party dependencies frequently cause unexpected timeouts, requiring health checks that monitor external payment gateways, CRM APIs, and search services. Use feature flags to safely roll out risky logic, allowing engineering teams to disable failing components instantly without deploying a full rollback.
Alert on Failures and Verify Recovery
Monitoring systems need to detect failures before visitors report them. Configure alerts segmented by specific routes, endpoints, and error rates, prioritizing notifications for high-value journeys. A broken checkout process or a failing paid landing page requires immediate paging, whereas an isolated error on an obscure legacy blog post warrants a daily summary review.
After deploying a fix, verify the recovery comprehensively. Monitor the original failing request, and run affected URLs through a GSC Export Analyzer to identify lingering crawl errors reported by Google. Confirm that error rates return to baseline and remain stable during subsequent traffic peaks.
FAQ: Retry, SEO, and Monitoring Questions
Is a 500 error caused by the visitor's internet connection? No. The visitor's local connection functions normally while a server-side component fails. The error indicates a breakdown on the application, proxy, gateway, or a database dependency.
How should a visitor respond to this error? Retry a standard page request once after a brief wait. Do not repeatedly submit payment forms, signups, or orders, as this risks duplicate transactions. Document the URL and time, then contact the site owner.
Can persistent 500 errors harm SEO rankings? Yes. Google temporarily slows its crawl rate upon encountering 5xx errors. If the errors persist, the affected content is ignored, and URLs may eventually drop from the search index entirely until stable 200 responses return.
What is the difference between a 500 and a 503 status? A 500 indicates a generic, unexpected internal failure within the application or configuration. A 503 indicates that the service is temporarily unavailable, usually due to deliberate maintenance or severe hardware overload.
Can frontend analytics detect backend server errors? Analytics platforms measure user impact, capturing browser exceptions and tracking funnel abandonment during downtime. Diagnosing the specific backend fault still requires server-side application and infrastructure logs.
Should a site owner return 200 instead of 500 to protect search visibility? No. Returning a 200 OK status for an error page creates a soft 404. Search engines recognize the page lacks relevant content and exclude it from search results while also breaking your automated monitoring tools.
Diagnosing infrastructure failures requires detailed server logs, but understanding the business impact requires clear behavioral data. Connect technical downtime to user journeys, conversion drops, and affected segments without sacrificing visitor privacy. Start analyzing your traffic and product flows ethically with Swetrix today.