- Date
500 Server Error Meaning Explained
 Andrii Romasiun
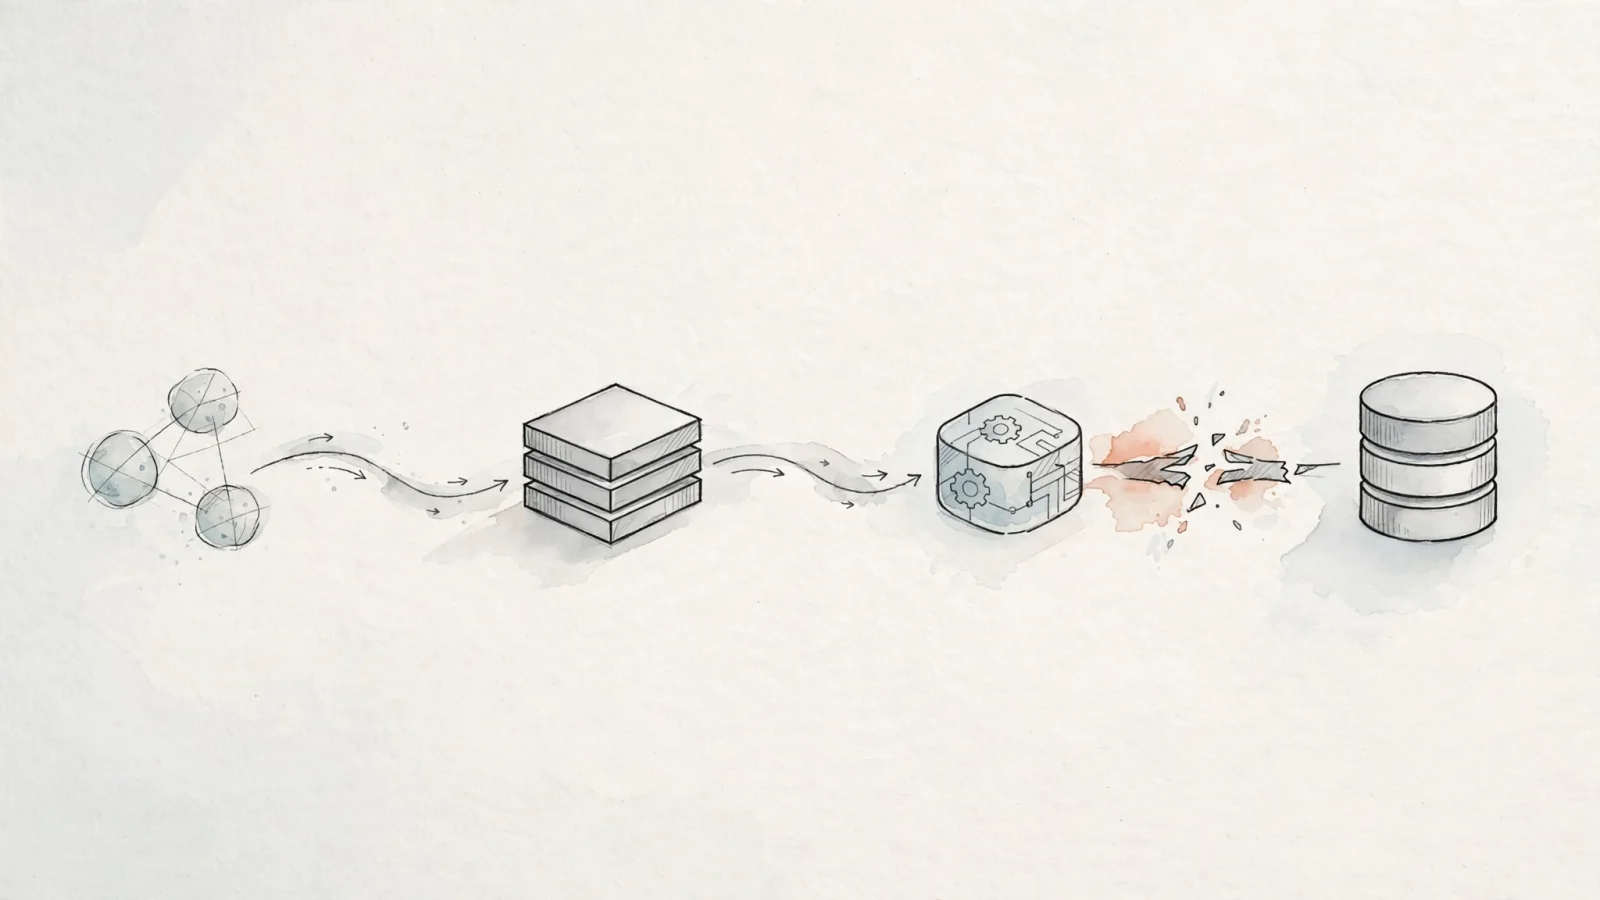
The 500 server error meaning points directly to backend infrastructure: the server or server-side processing layer encountered an unexpected condition and could not complete the request. The status code confirms a backend failure, but it does not diagnose the exact fault. The underlying cause could be a typo in a configuration file, an exhausted memory limit, a crashed database connection, or an unhandled exception in application code.
Resolving these failures requires matching the protocol error to the business impact. Server and application logs explain why a particular request crashed, while privacy-first analytics platforms like Swetrix connect those technical failures to the people who experienced them, showing which visitors, devices, and conversion journeys were interrupted.
The Technical Meaning of a 500 Status Code
HTTP uses status codes as part of its standardized semantics. According to the HTTP Semantics standard, RFC 9110, HTTP responses include status codes that describe the response.
This code acts as a generic catch-all designation for server-side problems. Because revealing a full stack trace or database connection string to a public visitor creates a vulnerability, the browser usually displays a plain error page to keep the technical details hidden from the client. The useful explanation of the failure lives exclusively in the application, web server, deployment, or dependency logs on the backend.
The 500 status code applies to a specific request, not necessarily the entire domain. Your homepage might load perfectly while a contact-form submission, a specific API route, or a checkout callback returns a 500 error, which points toward a route-specific application bug or dependency problem rather than proving that every part of the website is unavailable.

What Causes a 500 Internal Server Error?
Because the status code covers any unexpected server condition, troubleshooting requires checking multiple layers of the application stack.
Application logic and configuration changes are frequent sources of failure. For example, a recent deployment might contain an unhandled exception in custom code, or an invalid directive in an .htaccess file or NGINX configuration block will immediately break the routes it governs. Missing environment variables, altered routing rules, or faulty WordPress plugins can also force the server to abandon a request.
Resource limits and system permissions dictate whether an application can execute its commands. Out-of-memory conditions kill running processes mid-request, and incorrect file permissions prevent the web server from reading an executable file or writing to a designated cache directory. Additionally, failed connections to a primary database, an external queue, or a required third-party authentication service surface as a 500 error if the application lacks a graceful fallback mechanism.
Official Cloudflare documentation identifies origin web server problems, including an error establishing a database connection, as common causes of HTTP 500 responses. It also lists Cloudflare Worker runtime exceptions and Page Rules configuration issues as causes.
Troubleshooting a 500 Error Based on System Access
The path to finding the root cause depends entirely on your level of access to the system infrastructure.
Troubleshooting as a Site Visitor
A 500 response indicates a failure in server-side processing rather than a problem with your browser, meaning that while a malformed input can occasionally expose a bug, the server still failed to handle that input correctly.
Refresh the page once to test whether the failure was a momentary timeout, and wait a short interval before trying the URL again. You can also open another page on the same domain to see whether the problem is limited to one specific route. If the issue persists, record the exact URL, the time, the action that caused the error, and any visible request ID on the screen to share with the site owner or hosting provider. Modifying your browser settings or repeatedly refreshing the page will not repair a server-side exception.
Troubleshooting as a WordPress Administrator
Begin by identifying what changed immediately before the error appeared, and determine whether the failure affects the public site, the WordPress dashboard, or only one specific action like publishing a post.
Review your hosting panel logs, PHP error logs, and application logs. If the site reports a fatal error, use WordPress Recovery Mode. This built-in feature pauses a faulty plugin or theme for the administrator’s session and displays notices identifying the problematic component so you can regain access to the dashboard.
Temporarily isolate suspected plugins, themes, or custom code changes by deactivating them one at a time, and verify the database access credentials in your wp-config.php file. Check your available PHP memory limits and directory permissions, testing the affected URL after each isolated change to confirm exactly which component broke the request.
Troubleshooting as a Developer or Platform Operator
Define the scope of the incident before making changes by determining whether the failure isolates to one URL, one HTTP method, a specific user action, a geographic region, or an entire deployment cluster.
Reproduce the exact request from a terminal to inspect the raw headers and payload:
curl -i https://example.com/affected-path
Check the application log for the specific exception, stack trace, failed dependency, or missing configuration value, and correlate that application event with the web server log using the timestamp. Review recent deployments, environment variable updates, database migrations, routing rules, and infrastructure configuration changes. Finally, inspect downstream dependencies including databases, caches, queues, file systems, and external APIs.
If a reverse proxy or CDN handles traffic, compare the edge response to a direct origin request to isolate the failing layer. Test the original route and the specific business action that failed to confirm recovery, because returning a 200 OK status on the homepage does not guarantee that a POST request to an API endpoint is working again.
For B2B platforms, collect a customer-safe incident record that logs the affected tenant, URL, HTTP method, timestamp, deployment identifier, and correlation ID. Expose a clear explanation of the public status to end users while keeping stack traces, secrets, and internal remediation states securely inside internal monitoring tools.
500 vs. 400, 404, 502, 503, and 504
Web servers use specific status codes to distinguish client mistakes, missing resources, and different categories of server failure.
| Status | Meaning | Practical interpretation |
|---|---|---|
| 400 Bad Request | The server cannot process the request because the request is invalid. | Investigate request syntax, parameters, or validation. |
| 404 Not Found | The requested resource is not available at that URL. | Check the URL, routing, or whether the page was removed. |
| 500 Internal Server Error | The server encountered an unexpected condition. | Inspect application and server-side logs. |
| 502 Bad Gateway | A gateway or proxy received an invalid response from an upstream server. | Check the proxy, upstream application, or network path. |
| 503 Service Unavailable | The server is temporarily unable to handle the request. | Indicates planned maintenance or deliberate overload protection. |
| 504 Gateway Timeout | A gateway or proxy did not receive a timely upstream response. | Investigate slow dependencies, complex queries, or upstream timeouts. |
The distinction between a 500 and a 503 response dictates how automated systems handle the failure. A 500 represents an unexpected crash, whereas a 503 indicates that the server is temporarily unavailable due to known conditions such as scheduled maintenance or deliberate rate limiting. A 503 response often includes a Retry-After header to suggest when a client should try the request again. Returning an unexpected 500 error during routine maintenance confuses clients, and returning a successful 200 OK status for an error document misrepresents the request outcome entirely.
Can a 500 Error Hurt SEO and Conversions?
Google's crawlers adjust their crawl rate in response to HTTP status codes. According to documentation from Google Crawling Infrastructure, 5xx and 429 responses prompt them to temporarily slow crawling.
Google ignores any content returned with a 5xx status code, which means URLs that persistently return server errors over an extended period risk being removed from the search index entirely. However, one isolated 500 response does not trigger an immediate ranking penalty, and crawling generally increases again once the server consistently returns successful responses.
Monitor Google Search Console for crawl-related errors, and test the actual HTTP response of your pages using curl or browser developer tools to ensure you are not serving soft errors. As you troubleshoot, prioritize the stability of indexable landing pages, primary articles, product directories, and sitemap URLs.
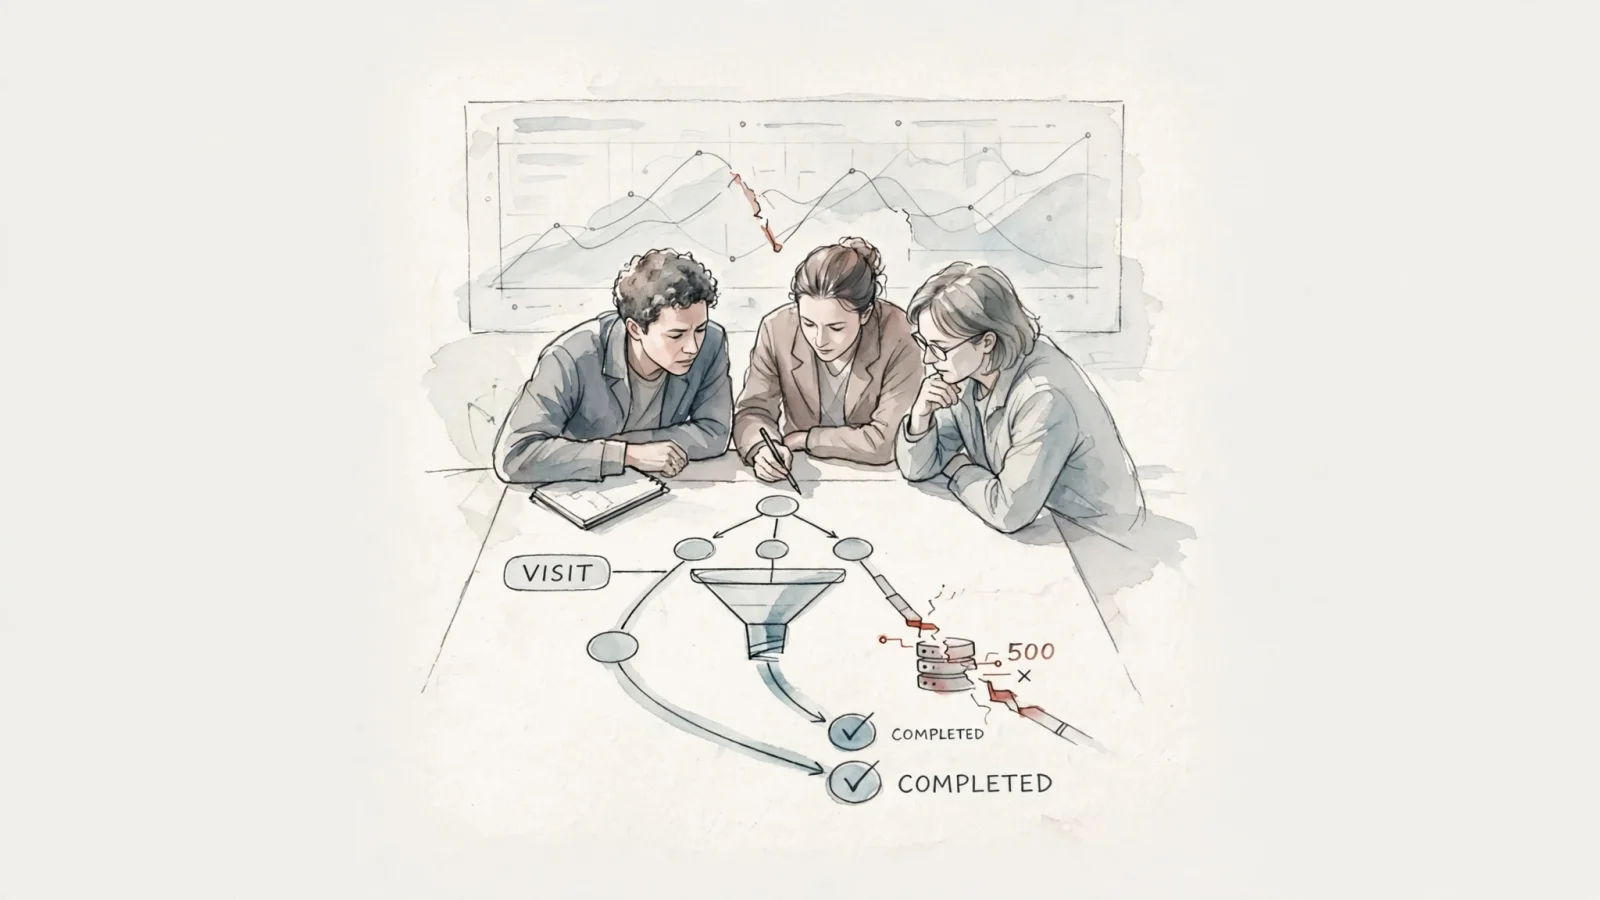
Beyond indexation, server errors directly interrupt business operations. A website can appear healthy on basic uptime monitors while a critical conversion path silently drops user requests. For instance, a contact form, account signup flow, login page, checkout callback, or frontend API might return persistent 500 errors while the homepage continues serving cached content flawlessly. Connecting these backend failures to frontend analytics helps teams estimate the business impact, track lost leads, and prioritize engineering fixes based on user friction rather than log volume alone.
Monitoring 500 Errors With Logs and Swetrix
Effective monitoring pairs backend diagnostics with behavioral data. Server logs contain the stack traces, failed database queries, and environment details required to fix the underlying fault, while Swetrix adds the behavioral context to show exactly which visitors, devices, pages, and marketing campaigns the error interrupted.
Relying exclusively on browser-based tracking leaves a visibility gap because client-side tracking scripts require the HTML page to load before they can execute. If a server request fails entirely and returns a blank 500 error document, the browser script may never initialize, meaning the client-side monitor never sees the failure. Swetrix provides a documented trackErrors() function for capturing client-side JavaScript exceptions, though backend failures require a different instrumentation approach.
For complete coverage of HTTP 500 errors, you can instrument your backend application to communicate directly with the analytics platform. When the server catches an unexpected exception, it writes the stack trace to the internal application log and then fires a sanitized server-side event to the Swetrix Events API.
This workflow bridges the gap between infrastructure and behavior. When a request fails, the application log captures the root cause, and the backend sends a grouped http_500 event to Swetrix. The analytics dashboard then reveals the affected pages and interrupted journeys, allowing the marketing or product team to verify recovery after the engineering team ships a fix.
Configure the server-side payload to include actionable properties:
- Error type (e.g.,
http_500) - Route or page category
- HTTP method (GET, POST, PUT)
- Release or deployment identifier
- Server environment (production, staging)
- Whether a defined conversion action was in progress
Never send raw passwords, authorization headers, payment data, or unredacted personal information to an analytics endpoint; keep the event payload restricted to structural metadata that groups the failures and measures their frequency.
500 Server Error FAQs
What is the 500 server error meaning?
A 500 Internal Server Error means the server encountered an unexpected condition and could not complete the requested action. The status code confirms that the failure occurred on the server side, though it does not identify the specific configuration problem, memory limit, or application bug causing the crash.
Is it my browser, and is the whole site down?
A 500 error is usually a website-side problem rather than an issue with your local browser. The error applies to a specific request, meaning it does not prove the entire domain is down; one specific API endpoint, form submission, or deployment might fail while other pages continue working normally.
Will refreshing help, and what about SEO or Swetrix?
Refreshing the page may succeed if the issue was caused by a temporary network timeout or a momentary resource spike, but it does not diagnose or fix an underlying configuration or logic error.
Repeated 5xx responses pose a significant SEO risk because they slow down search engine crawlers, cause indexing systems to ignore the returned content, and can eventually lead to URLs being dropped from search results.
To improve service stability, server administrators can log 500 responses with details about the initiating requests, as MDN Web Docs explains.
Server logs tell you why a 500 error happened, and Swetrix helps you understand what it interrupted. Built as an open-source, cookieless alternative to Google Analytics, Swetrix gives you full visibility into website traffic, user events, and interrupted conversion funnels without requiring cookie banners or compromising visitor privacy. Start bridging the gap between your backend infrastructure and your user journeys at swetrix.com.