- Date
What is statistical significance in A/B testing? A practical guide to p-values
 Andrii Romasiun
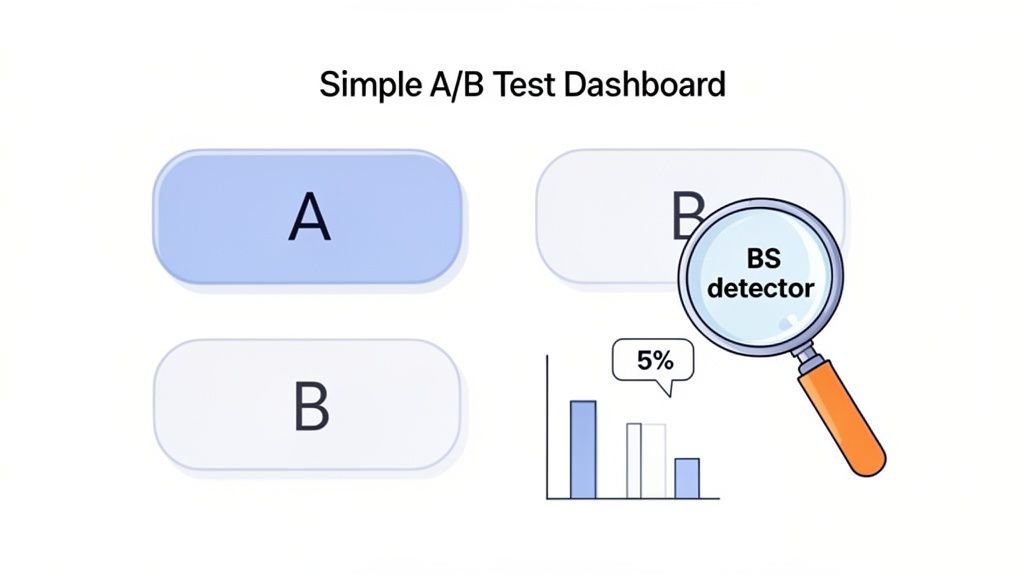
Statistical significance is just a fancy way of asking: "Is this result real, or did I just get lucky?"
Let's say you run an A/B test and your new headline (Variant B) gets a 5% higher conversion rate. That sounds great, but is that 5% lift a genuine improvement, or is it just random noise in the data? Statistical significance acts as your built-in BS detector, helping you tell the difference between a real win and a random fluke.
What Do Your A/B Test Results Really Mean?
Imagine you've just spent a week testing a new call-to-action button, and the numbers show it's outperforming the original. The first instinct is to pop the champagne and deploy it everywhere. But hold on. How can you be sure the win isn't just a fluke? What if you ran the exact same test next week and the old button came out on top?
This is precisely the uncertainty that statistical significance helps you manage. It gives you a mathematical framework to make confident decisions. Without it, you're essentially guessing, and you could end up wasting time and money on changes that do nothing—or even hurt your performance.
Separating Signal From Noise
At its heart, statistical significance is a tool for risk management. Think of it as separating the "signal" (the actual impact of your change) from the "noise" (the everyday, random fluctuations in user behavior). When a result is statistically significant, it means the signal is strong enough to cut through the noise. It’s a strong indicator that what you’re seeing is not just a random event.
This idea has been around for centuries. Back in the early 1700s, a physician named John Arbuthnot studied 82 years of London birth records. He noticed more boys were born than girls every single year and wondered if it was intentional or just chance. He calculated the odds of this happening randomly were astronomically low, so he concluded it must be an act of "Divine Providence."
That early hypothesis test is the direct ancestor of the A/B tests we run today. Modern tools like Swetrix now let us run sophisticated, cookie-less experiments, but the core principle remains the same. You can learn more about the history of statistical significance on Wikipedia.
A Roadmap for This Guide
Getting a handle on these concepts is non-negotiable if you want to make truly data-informed decisions. Before we dive deep, let's get acquainted with the key terms we'll be covering.
Core Concepts at a Glance
This table gives you a quick summary of the key terms you'll need to understand statistical significance.
| Concept | What It Tells You |
|---|---|
| P-Value | The probability of seeing your results (or even more extreme ones) if your change actually had no effect at all. |
| Alpha (Significance Level) | The cutoff you choose (usually 5% or 0.05). If your p-value is below this threshold, you call the result significant. |
| Type I & II Errors | The two ways you can be wrong: a false positive (Type I) or a false negative (Type II). |
| Practical Significance | Asks if a statistically significant result is actually big enough to matter to your business. |
Getting these fundamentals down will help you move beyond just looking at the final conversion numbers and start interpreting your experiment results like a seasoned pro.
How to Decode the P-Value
When you run an experiment, your analytics tool spits out a bunch of numbers, but the p-value is the one that gets all the attention. So what is it, really? Forget the textbook definitions for a moment. Let's think about it like a courtroom trial.
Your Experiment on Trial
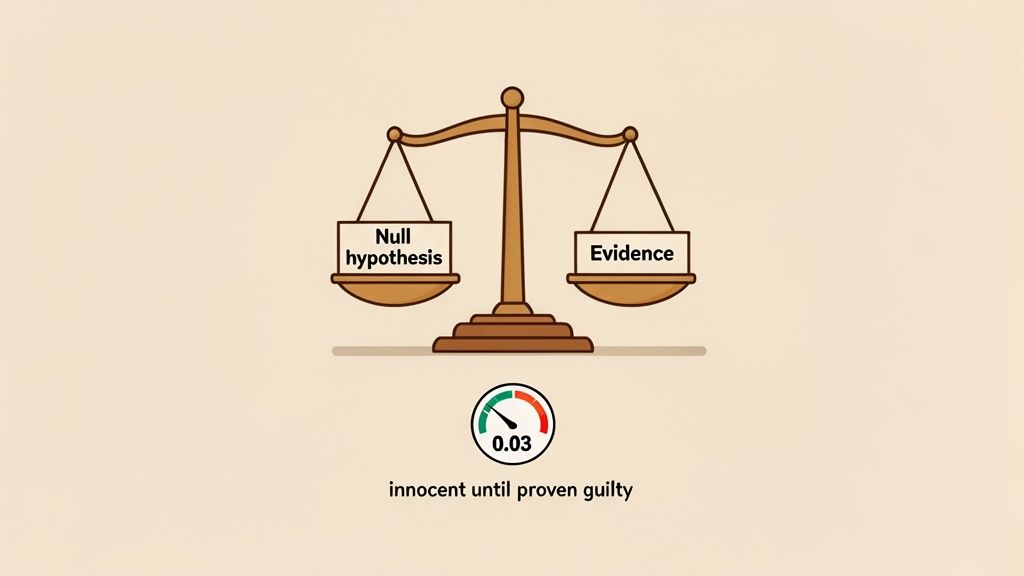
Imagine putting your new feature or design on the stand. The "defendant" in this trial is the original version—the status quo. And in our court, the guiding principle is "innocent until proven guilty."
This starting assumption, the idea that nothing has changed, is what statisticians call the null hypothesis. It's the default belief that your shiny new button or clever new headline has no real effect on what users do.
The data from your A/B test is the evidence you present to the jury. The p-value, then, is the weight of that evidence.
What is the p-value? It's the probability of seeing the results you got (or something even more dramatic) if the null hypothesis were true. Put simply, it answers the question: "If my new button actually did nothing, how likely is it that we'd see a 5% lift just by random chance?"
A tiny p-value means your results are highly unlikely to be a random fluke. It’s strong evidence that allows you to "convict" the defendant—in other words, to reject the null hypothesis and confidently say your change made a real difference.
Setting the Bar for Evidence
So, how small does a p-value need to be to declare a winner? Just like in a courtroom, we need a clear standard to decide between "guilty" and "not guilty." This is where the significance level, or alpha (α), comes into play.
By far, the most common alpha level used in product and marketing is 0.05, or 5%.
When you set your alpha to 0.05, you're drawing a line in the sand. You're saying, "I'm willing to accept a 5% risk of being wrong about this." If your test produces a p-value less than 0.05 (say, 0.03), you call the result statistically significant. You can reject the null hypothesis because there’s a very small chance (less than 5%) that you're just looking at random noise.
- P-value < 0.05: The evidence is compelling. You can reject the null hypothesis and conclude your change had a genuine impact.
- P-value > 0.05: The evidence is weak. You fail to reject the null hypothesis. This isn't the same as proving your change did nothing; it just means your test didn't gather enough evidence to make a strong case.
That 0.05 isn't some magical number handed down from the heavens. It’s simply a long-standing convention that strikes a sensible balance between being too quick to celebrate a random fluctuation and being so skeptical that you never act on your results.
Where Did the 0.05 Rule Come From?
This now-standard threshold was popularized way back in 1925 by a statistician named Ronald Fisher in his landmark book, "Statistical Methods for Research Workers." He proposed these "tests of significance" as a practical filter for researchers to decide if their findings were worth a second look. He figured that a 1 in 20 chance (5%) of a result being a fluke was a reasonable cutoff. You can discover more about the historical context of statistical methods if you're curious.
Today, product teams using platforms like Swetrix apply that very same logic. Imagine running a test with feature flags that drops the bounce rate from 45% to 32%. If the test collected data from 5,000 sessions and came back with a p-value under 0.05, the team can be 95% confident that this improvement is real, not just a lucky break.
Avoiding Common Data Traps and Errors
So, your A/B test is done, the results are in, and you’ve got a low p-value that seems to point to a clear winner. It's incredibly tempting to pop the champagne and declare victory. But hold on. A huge part of understanding statistical significance is knowing all the ways the numbers can fool you.
Think of it like a courtroom. Even with what looks like strong evidence, sometimes the verdict is just plain wrong.
When you're sifting through experiment results, you have to be on guard against two major types of errors. These aren't just simple math mistakes; they're the inherent risks you take anytime you make a big decision based on a small slice of data. Knowing what they are helps you strike the right balance between confidence and caution.
Type I Error: The False Positive
A Type I error is what we call a false positive. In our courtroom analogy, this is like convicting an innocent person. Your data leads you to reject the null hypothesis, making you think your new feature is a game-changer when, in reality, it did nothing. The "lift" you celebrated was just random statistical noise that happened to look like a real pattern.
For a business, this is arguably the more dangerous error of the two. A false positive can trick you into:
- Wasting resources: You could sink a ton of time and money into rolling out a feature that delivers zero actual value to your users or your bottom line.
- Adding useless complexity: Every feature, even a useless one, adds clutter to your UI and can actually make the user experience worse.
- Building on a shaky foundation: Future product decisions might be based on the false assumption that this change was a success, leading you further down the wrong path.
How does this even happen? The odds of making a Type I error are something you control directly with your significance level, or alpha.
When you set your alpha to 0.05, you are quite literally accepting a 5% chance of being fooled by a false positive. Put another way, for every 20 experiments that show a significant result, one of them could be a fluke.
It’s a trade-off you have to make. You could lower your alpha to something like 0.01 to be more cautious, but that dramatically increases the risk of the opposite problem.
Type II Error: The False Negative
A Type II error is a false negative—the flip side of the coin. This time, you’re letting a guilty person walk free. Your test simply fails to see a real effect that’s actually there. You look at the data, fail to reject the null hypothesis, and conclude your change had no impact when it really did.
This is the error of missed opportunities. You might scrap a fantastic idea or a profitable feature just because your test wasn't sensitive enough to pick up on its signal. A brilliant redesign that genuinely boosts user engagement could get tossed aside because the data didn't scream "success!" loud enough.
The probability of making a Type II error is known as beta (β). And the inverse of that—the probability of correctly spotting an effect when it exists—is what we call the statistical power of a test.
One of the most effective ways to minimize both types of errors is to focus on your data collection from the very start. To make more confident calls, you can dig into strategies for how to improve data quality in your analytics. A clean, trustworthy dataset is the bedrock of any good experiment. The better your data, the lower your risk of being fooled by randomness, which ultimately lets you run tests with much higher statistical power.
Why a Low P-Value Is Not Enough
It’s easy to feel like you’ve hit the jackpot when your experiment’s p-value dips below that magic 0.05 threshold. But while that’s an important signal, it’s not the finish line. It's just the start of the story.
A statistically significant result simply means that the effect you're seeing is probably real and not just a fluke of random chance. It tells you nothing about the size of that effect or whether it actually matters.
This is one of the most common traps in product and marketing. If you rely only on a p-value, you might pour engineering resources into a change that delivers a laughably small real-world return. Not all statistical "wins" are created equal when it comes to business impact.
The real danger here is that with enough traffic, even the most microscopic, useless change can look statistically significant. Imagine an A/B test with millions of users where a new button color lifts conversions by a paltry 0.01%. Your tool might spit out a p-value of 0.001, but is that change really worth the engineering time to implement and maintain? Almost certainly not.
Introducing Effect Size: The "So What?" Factor
To get from statistical noise to actual business impact, you need to ask a much better question than "Is this real?" You need to ask, "How big is the difference?"
This is where effect size comes in. It’s a straightforward, standardized measure of just how large the change you observed really is.
Think of it this way: a p-value answers, "Is there an effect?" while the effect size answers, "How much of an effect is there?" It cuts right through the statistical jargon and gives you a clear sense of how powerful your change was. A large effect size points to a meaningful, substantial improvement, whereas a small one signals something minor—maybe even too small to care about.
Let's look at two hypothetical test results:
- Test A: A button color change on your homepage, tested with 2 million users. It gives you a 0.05% conversion lift with a p-value of 0.01. The result is statistically significant, but the effect size is minuscule.
- Test B: A headline rewrite on your pricing page, tested with 10,000 users. It drives a 15% conversion lift with a p-value of 0.04. The result is also statistically significant, but the effect size here is massive.
A manager fixated on p-values might see both as wins. But an experienced product owner knows that Test B is the one that will actually move the needle for the business.
Practical significance asks the ultimate business question: "Is this change actually big enough to matter?" It’s the crucial filter that separates interesting statistical quirks from impactful business decisions.
Using Confidence Intervals to See the Full Picture
Another incredibly useful tool for sizing up your results is the confidence interval. Instead of just giving you a single number for the lift (like "a 5% increase"), a confidence interval provides a range of likely outcomes.
For example, an A/B testing tool like Swetrix might tell you that your new feature increased signups by 8%, with a 95% confidence interval of [5%, 11%].
Here’s what that actually tells you:
- Your best guess for the outcome is an 8% lift.
- You can be 95% confident that the true, real-world lift is somewhere between 5% and 11%.
- Because the entire range is positive (above zero), you can be pretty sure the result is statistically significant.
Confidence intervals are fantastic for gauging risk and potential ROI. A narrow interval, like [10%, 12%], points to a very predictable and reliable outcome. On the other hand, a really wide interval, like [1%, 25%], still tells you the result is significant, but it also screams that the true impact is highly uncertain. That context is absolutely essential for making smart decisions about where to spend your team's time.
Statistical vs Practical Significance
It's crucial to understand that these two ideas serve different purposes. One validates that an effect is real, while the other tells you if that effect is worth caring about. This table breaks down the key differences.
| Aspect | Statistical Significance | Practical Significance |
|---|---|---|
| Primary Question | "Is this result likely due to chance?" | "Is this result large enough to be valuable?" |
| Key Metric | P-Value | Effect Size (e.g., percentage lift, revenue increase) |
| Main Influencer | Sample Size (larger samples detect smaller effects) | Magnitude of the observed change |
| Business Goal | To validate that an effect is real | To ensure the effect justifies the implementation cost |
In the end, a low p-value is just your starting point—a green light to dig deeper. By combining that signal with a clear-eyed analysis of the effect size and the confidence interval, you can move from simply knowing what’s statistically sound to truly understanding what's important for your business.
How to Run Experiments You Can Trust
Putting theory into practice is how you turn a jumble of numbers into a real engine for growth. Running a trustworthy experiment is so much more than just launching a test and waiting for the p-value to drop below 0.05. It’s about having a disciplined, repeatable process that protects you from your own biases and the randomness that’s always present in data.
Without a solid framework, it’s far too easy to fall into common traps that kill your results. You might be tempted to stop a test the moment it looks promising, or maybe you'll cherry-pick a metric that supports the outcome you wanted all along. A well-designed experiment, on the other hand, gives you insights you can actually build a business on.
This flowchart boils the decision-making process down to its essentials: first, check the p-value for significance, then look at the effect size to gauge the impact before making the final call.
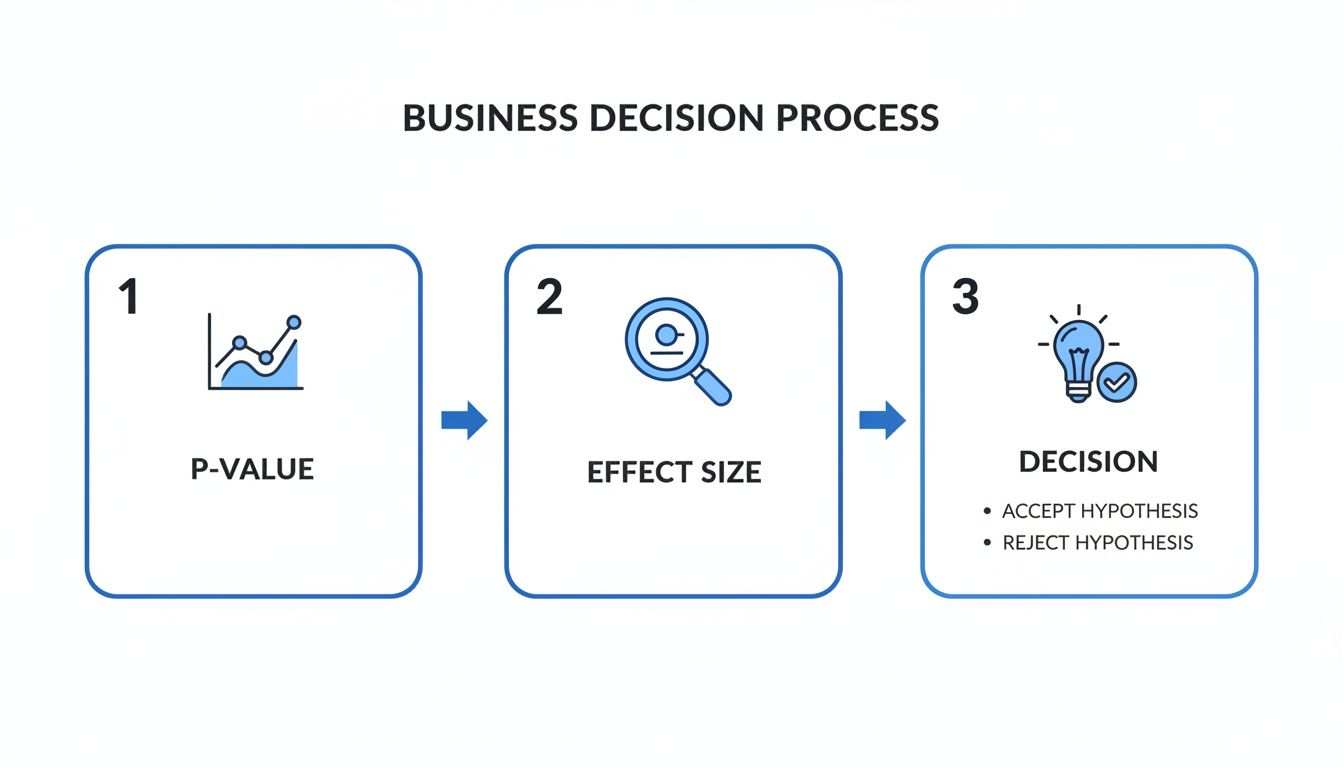
This simple flow ensures you’re not just confirming statistical validity; you're also making sure the business impact is big enough to matter.
Define Your Hypothesis and Metrics First
Before a single line of code is written or a pixel is moved, you have to clearly state what you expect to happen. A strong hypothesis isn't a vague goal like "improve the signup page." It has to be specific, measurable, and falsifiable.
For instance, a much better hypothesis would be: "Changing the signup button text from 'Get Started' to 'Create My Free Account' will increase account creations by at least 10% over a two-week period."
Just writing that down does two incredibly important things:
- It forces clarity. You know exactly what success looks like (a 10% lift in signups).
- It prevents goalpost-moving. You can’t go back later and claim victory because some other random metric went up.
Choosing your primary metric is just as vital. Are you trying to boost signups, increase revenue per user, or lengthen time on page? You need to pick one primary metric to be your North Star. You can absolutely monitor secondary metrics, but your final decision has to rest on the one you chose from the very beginning.
Calculate Your Required Sample Size
One of the biggest mistakes I see teams make is running a test "until it looks significant." This is a guaranteed recipe for false positives. You must figure out your required sample size before you launch anything.
Think of it like a political poll. You wouldn't trust a poll of only 10 people to predict a national election, would you? Your A/B test is no different—it needs enough "voters" (users) to give you a reliable result.
To calculate your sample size, you'll need three key inputs:
- Baseline Conversion Rate: How your metric is performing right now.
- Minimum Detectable Effect (MDE): The smallest improvement you’d actually care about from a business perspective (the 10% in our example).
- Statistical Significance Level: Your confidence level, which is usually 95% (this corresponds to an alpha of 0.05).
There are dozens of free online calculators that can do the math for you. This step tells you exactly how many users need to see each version of your test before you're allowed to look at the results. For a deeper dive, check out our guide on A/B testing for landing pages.
Running a test until it reaches its predetermined sample size is non-negotiable. Peeking at the results early and stopping when one variant pulls ahead is a form of p-hacking that completely invalidates your findings.
Analyze Results Without Bias
Once your experiment has hit the required sample size, it’s finally time to analyze the data. This is where all the concepts we’ve talked about—p-values, confidence intervals, and practical significance—come together.
Modern analytics platforms like Swetrix can automate a lot of this, showing you conversion rates, uplift, p-values, and confidence intervals right in your dashboard. If you're using tools like feature flags for a controlled rollout, you can tie custom events (like signup_completed or purchase_made) directly to your experiment variants.
Here's your final analysis checklist:
- Check the p-value. Is it below your 0.05 threshold? If it's not, you can't claim a statistically significant result. End of story.
- Examine the confidence interval. What is the range of likely outcomes? A narrow, positive range like [8%, 12%] is a strong signal of a reliable win.
- Evaluate practical significance. Is the observed lift (the effect size) actually big enough to justify the engineering and design costs? A 0.1% lift, even if it's statistically significant, probably isn't worth the effort.
By following this simple, structured approach—hypothesize, calculate, run, analyze—you move from guessing to knowing. You start building a repeatable process that generates trustworthy insights, making sure every decision is backed by solid, unbiased evidence.
Putting It All Together for Better Decisions
The ideas behind statistical significance aren't just for A/B tests. Once you start seeing the world in terms of signal versus noise, you’ll find opportunities everywhere to make smarter decisions. It's a mental shift that takes you from simply reacting to data to interpreting it with real confidence.
Take a look at your main dashboard. Did your bounce rate really drop by 7% this week, or is that just the metric bouncing around like it always does? By thinking about significance and effect size, you can start telling the difference between a meaningful trend and the random daily jitter. This logic is just as powerful when you're digging into funnel performance or trying to figure out which marketing campaigns are actually paying off.
From Experiments to Everyday Insights
This way of thinking forces you to ask better questions about all your data. Instead of just seeing that a number changed, you start wondering why, and more importantly, if the change is big enough to do anything about. Was that dip in conversions caused by the new feature we just shipped, or is it just a bit of seasonal noise we see every year?
Adopting this mindset builds a stronger, more curious team culture. People learn to challenge their assumptions and look for real evidence, which leads to far more resilient strategies. When every major decision is held to this standard, you can be sure you're acting on solid ground, not just a gut feeling or a number you glanced at.
At its core, understanding what is statistical significance is about managing risk. It’s a framework that helps you make confident calls in an uncertain world, making sure you’re putting time and money into changes that truly move the needle.
A Recap of Core Principles
We’ve covered a lot of ground, but it all boils down to a few powerful ideas. Getting these right will fundamentally change how you look at data.
- Significance Separates Signal from Noise: Its whole job is to help you decide if what you're seeing is a real effect or just random chance doing its thing.
- P-Values Are Just One Piece of the Puzzle: A low p-value is an encouraging sign, but it's the start of the story, not the end. It tells you an effect is likely real, but it says nothing about how big or important that effect is.
- Practical Impact Drives Real Growth: Always follow up statistical analysis with a reality check. Ask yourself: "Is this change actually big enough to matter to our business?"
When you weave these concepts together, you get the full picture. This complete view is what you need to make smart, sustainable decisions that lead to growth. For more ways to apply these ideas, check out our guide on conversion rate optimization best practices.
Leaning into this framework lets you build products and run campaigns with much more certainty. It helps you cut through the noise of user data to find what’s really going on—all while using ethical, privacy-first tools like Swetrix. That commitment to rigorous analysis is the bedrock of genuine, data-driven growth.
Got Questions? We've Got Answers.
Even when you've got the theory down, things can get tricky when the rubber meets the road. Here are a few common questions that pop up when teams start applying these statistical concepts to their own experiments.
Can a P-Value Be Zero?
In theory? No. A p-value is a probability, and there's always some vanishingly small, one-in-a-gazillion chance that the results you're seeing are just a wild fluke of randomness.
But in practice, you might see a p-value reported as 0.000. Most analytics tools do this when the actual number is incredibly tiny (like 0.0000012). When you see that, just interpret it as extremely strong evidence against the null hypothesis. It’s the data’s way of screaming that your result is highly significant.
What’s a Good Sample Size for an A/B Test?
This is the classic "it depends" question, and for good reason. There’s no magic number. The right sample size for your test hinges on a few crucial factors:
- Your baseline conversion rate: It's much easier to spot a change on a page that converts at 50% than one that converts at 1%.
- The minimum detectable effect (MDE): Are you looking for a massive 20% lift or a subtle 2% improvement? Detecting smaller changes requires a much larger audience.
- Your desired statistical power: You'll typically want to aim for 80% power. This gives you a good chance of spotting a real effect and avoiding the frustration of a false negative.
Do yourself a favor: use a sample size calculator before you launch. Seriously, this isn't a step you can skip if you want reliable results.
Remember, the point of calculating sample size isn't just about hitting that p < 0.05 milestone. It's about giving your test enough power to confidently tell you if a meaningful change actually happened.
What Should I Do If My Result Isn't Significant?
So, your p-value came in over 0.05. It’s tempting to feel like the test was a failure, but that's not quite right. What it means is you "failed to reject the null hypothesis"—in other words, your test didn't find enough evidence to prove your change made a difference.
Here’s what you can do next:
- Accept the null: The most straightforward path. Conclude that your change didn't have the desired effect, and stick with what you’ve got.
- Rethink the hypothesis: Maybe your change was too timid. Was a button color swap really going to move the needle? Perhaps a bolder redesign is needed to get a clear signal.
- Run a new test: If you have a strong belief in the idea but suspect the first test was underpowered, you could design a new experiment, this time ensuring you have a large enough sample size to detect a smaller effect.
Ready to run experiments you can trust? With Swetrix, you can implement feature flags, run A/B tests, and track key metrics with a privacy-first analytics platform. Start your free 14-day trial and make better, data-driven decisions today.