- Date
A Practical Guide on How to Improve Data Quality for Modern Teams
 Andrii Romasiun
Fixing your data quality isn't just about cleaning up messes after the fact. It's about building a proactive system—defining what "good" looks like, auditing your most important data, setting up automated guardrails, and fostering a culture where everyone feels responsible for data integrity. When you get this right, you turn unreliable data from a liability into your most valuable strategic asset.
Why Bad Data Is Quietly Killing Your Growth
Let's be blunt: poor data quality is more than a technical nuisance. It's a direct threat to your bottom line. When your analytics are built on a shaky foundation, every decision you make is a roll of the dice.
Marketing teams burn through their budgets on campaigns that look good on paper but are completely misattributed. Product teams ship features based on a skewed understanding of user behavior. Before you know it, your leadership team starts to lose faith in the very numbers meant to guide the company forward. This isn't just an inconvenience; it's a silent killer operating inside your business.
The problem is massive and expensive. A recent study found a staggering 64% of organizations worldwide now see data quality as their top data integrity challenge—a huge jump from 50% just a year earlier. And the financial hit is real. A Forrester survey highlighted by Precisely found that over 25% of data teams globally estimate losing more than $5 million a year from bad data alone. For 7% of them, that number balloons to over $25 million.
Where Bad Data Hits You in the Real World
Let's get out of the abstract and talk about what this actually looks like.
Imagine your UTM tags are a mess. One campaign uses utm_source=google while another uses utm_source=Google. That simple casing difference splits your most valuable traffic source into two seemingly weak channels in your reports. You might slash your budget for what looks like an underperformer, accidentally kneecapping your best lead-gen engine.
Or picture this: a bug in your code makes the user_signup event fire twice for certain users. Suddenly, your acquisition numbers look fantastic. You're celebrating a huge win, but your actual growth has flatlined. These aren't just hypotheticals; they happen every day and lead to serious problems:
- Wasted Marketing Spend: You can't trust your attribution, so you have no real idea what your ROI is. You end up pouring money into the wrong channels.
- Broken User Funnels: Incomplete tracking means you can't see where users are dropping off. That makes it impossible to fix critical UX issues.
- Misguided Product Decisions: If your feature adoption data is wrong, you might double down on something nobody wants while ignoring what your users are actually asking for.
Ultimately, it all comes down to trust. When stakeholders can't rely on the data, they go back to making decisions based on gut feelings and anecdotes. The entire promise of being a "data-driven" company goes right out the window.
This guide is your playbook for fixing that. We’re going to skip the high-level theory and give you a step-by-step framework to diagnose, fix, and—most importantly—prevent data quality problems from happening in the first place. You'll learn how to set clear standards, run audits that actually work, and build automated checks to ensure your data is always reliable and ready to fuel real growth.
Kicking Off Your First Data Quality Audit
We've all been there. You have that nagging feeling that your data is "bad," but a feeling isn't something you can fix. To get anywhere, you need to turn that vague sense of doubt into a concrete diagnosis. That's exactly what a data quality audit is for—it’s your chance to systematically pinpoint what’s broken, where, and by how much.
Don't try to boil the ocean here. The key is to start small and focus on the data that truly matters. I'm talking about the metrics and events that your leadership team uses for strategic decisions, the numbers that drive revenue, and the data that informs your product roadmap.
Figure Out What Data Actually Matters
First things first, you need to identify the data your business absolutely can't live without. A short, focused list is infinitely more powerful than a sprawling one you can never get through.
I typically see these assets at the top of everyone's list:
- User Sign-up Events: This is the absolute top of your funnel. If this data is wrong, your entire acquisition model is built on sand.
- Purchase and Revenue Data: This one's a no-brainer. It directly impacts financial reporting and LTV calculations. Accuracy has to be airtight.
- Key Feature Adoption Metrics: This is the data that tells you whether your last six months of product development were a success or a flop.
- Marketing Campaign Data: Your UTM parameters are gold. Without clean UTMs, you're just guessing at your marketing ROI.
Once you’ve got this shortlist, you can start profiling the data. This just means running some queries and checks to get a baseline understanding of what you're working with. If you need a refresher on setting things up correctly from the start, our complete guide to tracking data is a great resource.
Define What "Good" Looks Like
Next up, you have to define what "good" actually means for each of those critical data points. You do this by applying clear standards across the core dimensions of data quality.
Let’s take campaign tracking as a real-world example. It's an area where things go wrong all the time.
- Accuracy: Is the
utm_sourcevalue even correct? I’ve seen it all—“googl”,“facebook-ad”,“Face-book”. These are obviously wrong and need to be flagged. - Completeness: Are all five UTM parameters (
source,medium,campaign,term,content) actually present when they should be? ANULLvalue in theutm_campaignfield for a paid ad click makes that row of data basically useless. - Consistency: Is the casing and format the same every time? You’d be amazed how often you find
“Google”and“google”in the same column. This simple mistake splits your traffic, completely skewing your reports.
Going through this process turns a vague goal like "improve UTMs" into a specific, measurable target. The framework below shows how this process fits into the bigger picture of building a culture that actually cares about data.
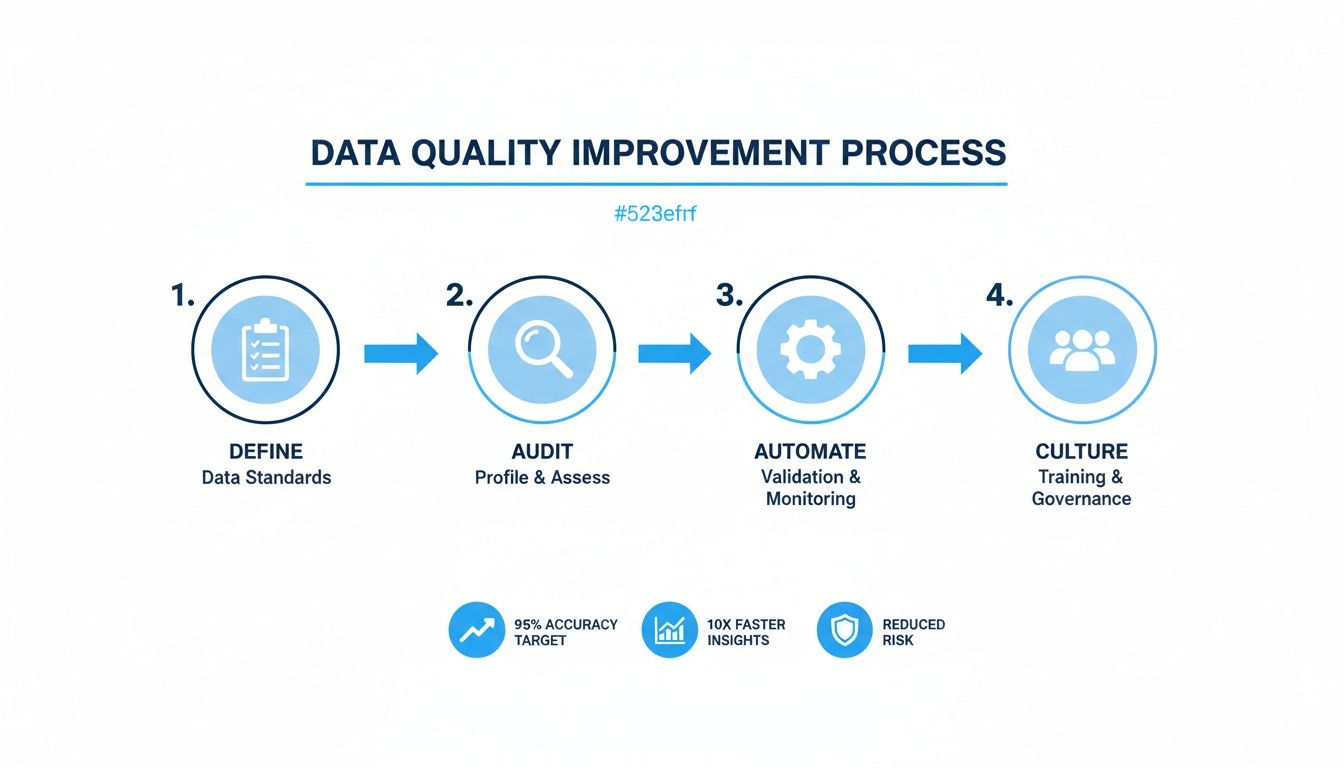
As the visual shows, it’s a journey that starts with defining standards and, ideally, ends with data quality being second nature to your team.
Set Realistic Data Quality SLAs
With your standards clearly defined, you can now set realistic Service Level Agreements (SLAs). An SLA is just a fancy term for a specific, measurable promise you make about your data. It essentially turns your standards into a pass/fail test.
An SLA isn't about hitting 100% perfection overnight. It's about setting a clear, achievable bar for quality and making someone accountable for keeping it there.
Here are a few examples of strong, no-nonsense data quality SLAs:
- "99.5% of purchase events must have a valid, non-null transaction ID."
- "No more than 1% of new user sign-ups can have a temporary or disposable email address."
- "100% of events from paid marketing channels must have values for
utm_source,utm_medium, andutm_campaign."
These SLAs give your team unambiguous targets. They create a clear framework for prioritizing what to fix first and give you a benchmark to measure your progress against.
Building a Bulletproof Analytics Tracking Plan
Most data quality problems don’t start in a complex data warehouse; they start the moment data is created. Messy, inconsistent, and poorly documented event tracking is the original sin of analytics. If you really want to fix your data quality, you have to go back to the source.
That means creating a clear, disciplined, and bulletproof analytics tracking plan before a single event ever gets fired.
The whole point of a great plan is consistency. Without it, your data will inevitably fracture into unusable pieces. The goal is to build a system so clear that any developer or marketer can look at it and know exactly how to track a new feature or campaign without ever having to ask.
![]()
Establish a Clear Naming Convention
Your first move? Standardize how you name things. I’ve found the Object-Action framework to be a simple and incredibly powerful way to do this. The structure is intuitive: you identify the "thing" the user is interacting with (the object) and then the "action" they performed.
- Object: Document, Button, User, Form
- Action: Signed, Clicked, Upgraded, Submitted
This simple rule transforms chaotic event names like user_signed_up_new or SignedDocumentClick into a clean and predictable format: Document-Signed or User-Upgraded. Everyone on the team immediately gets it, and your data becomes incredibly easy to query.
For a deeper dive, our comprehensive guide to event tracking covers these fundamentals in more detail.
Once you have your convention, document it. Put it in a shared repository like Notion, Confluence, or even a well-maintained Google Sheet. For every single event, you must define:
- Event Name: The official name (e.g.,
Document-Signed). - Description: A plain-English explanation of what triggers this event.
- Properties: The extra data you're sending (e.g.,
document_id,plan_type). - Data Types: The format for each property (e.g.,
String,Number,Boolean).
The Critical Importance of UTM Discipline
Nowhere does data quality break down faster than with UTM parameters. This is one of the most common and damaging self-inflicted wounds in marketing analytics. A single campaign can splinter into dozens of rows in your reports just because of minor typos or inconsistent casing.
The most frequent offender is casing. To most analytics tools, google, Google, and GOOGLE are three different sources. Just like that, your attribution data is completely fragmented.
Your tracking plan must include a rigid, non-negotiable set of rules for UTMs. This isn't a suggestion; it's a requirement for trustworthy marketing data. Create a shareable link to a UTM builder template and make it the only way your team is allowed to generate campaign URLs.
Your UTM policy should enforce:
- Lowercase Only: All parameters must be lowercase. No exceptions.
- No Spaces: Use dashes (
-) or underscores (_) instead of spaces. - Mandatory Fields: Define which parameters are always required (usually
utm_source,utm_medium, andutm_campaign).
Validate Data Before It Leaves the Browser
Even the best tracking plan is useless if it's not implemented correctly. This is where client-side and server-side validation come into play. Think of it as your first line of defense, making sure data is in the right format before it even hits your analytics platform.
Client-side validation happens right in the user's browser. It’s a quick check to catch obvious mistakes. For instance, before sending a Product-Purchased event, you can add a simple JavaScript check to ensure the price property is actually a number and not a string with a "$" in it.
Server-side validation is your second, more robust line of defense. It happens on your server after the data arrives but before it’s passed along to your analytics tool. This is crucial because a savvy user could potentially bypass client-side checks.
Here’s a practical example using the Swetrix API. Let's say we're tracking a document signing event. We can perform a simple check before we send it off.
// A simple client-side check const documentId = 'doc-xyz-123'; const plan = 'premium';
if (typeof documentId === 'string' && documentId.length > 5) {
// swetrix is the Swetrix tracking object
swetrix.track({
event: 'Document-Signed',
props: {
document_id: documentId,
plan_type: plan,
},
});
} else {
console.error('Validation failed: Invalid documentId');
}
This tiny snippet of code is a powerful data quality tool. It prevents a malformed documentId from ever polluting your analytics, ensuring that every Document-Signed event you record is clean and correct from the very start.
Automating Data Validation and Monitoring
Even with a flawless tracking plan, data is fragile. A simple code deployment, a change in a third-party API, or an accidental schema update can break your pipeline in an instant. Relying on manual checks to catch these issues is like trying to find a needle in a haystack—it’s slow, inefficient, and you'll almost always find the problem too late.
This is where you shift from being reactive to proactive. The goal isn't just to clean up messes after the fact; it's to build a safety net that catches problems the moment they happen. This is the core idea behind data observability—treating your data's health with the same urgency as your application's uptime.

Setting Up Your First Automated Tests
You don’t need some complex, enterprise-level platform to get started. You can begin improving data quality right away by implementing simple, automated tests that continuously scan your data for common issues. These tests act as your first line of defense, tirelessly monitoring your most critical metrics.
Think of them as smoke detectors for your data. They’re always on, and they only make noise when there’s a real problem. This approach transforms data quality from a massive, dreaded quarterly project into a continuous, automated habit.
Here are a few high-impact tests you can set up today:
- Volume Checks: Keep an eye on the number of events being recorded. A sudden 90% drop in
User-SignedUpevents is a massive red flag that something is broken. - Freshness Checks: Make sure your data is arriving on time. If your marketing dashboard hasn't received new data in the last 24 hours, you need to know immediately.
- Null Rate Monitoring: Track the percentage of null values in critical fields. A spike in nulls for
transaction_idin your purchase events could be devastating for financial reporting. - Schema Change Alerts: Get notified if a new property is added or, more critically, if an existing one is removed or has its data type changed.
These automated checks aren't just about finding errors. They're about building trust. When your team knows there’s a system in place to guarantee data reliability, they can finally make decisions with confidence.
The industry's rapid adoption of these practices is telling. Driven by regulations like GDPR and the massive growth of data in key sectors, the global market for data quality tools is exploding. It’s projected to surge from $2.1 billion to $7.19 billion, a clear signal that companies are shifting from manual cleanup to proactive management. You can find more details on this trend in the full data quality tools market research.
The table below breaks down just how significant this shift from manual to automated really is.
Manual vs Automated Data Quality Checks
| Aspect | Manual Checks | Automated Monitoring |
|---|---|---|
| Timing | Reactive (after the problem occurs) | Proactive (real-time alerts) |
| Speed | Slow, often done weekly or monthly | Instantaneous, 24/7 coverage |
| Scope | Limited to spot-checks and known issues | Comprehensive, covers entire datasets |
| Human Effort | High; tedious and error-prone | Low; set it up once and it runs forever |
| Cost | High hidden costs in lost revenue and wasted time | Lower TCO, prevents costly errors |
| Trust | Low; data is often outdated or suspect | High; builds confidence in data integrity |
Ultimately, automation frees up your team to focus on analysis and strategy instead of spending their days hunting for broken data points.
From Alerts to Actionable Insights
An alert is useless if it doesn't lead to a quick resolution. The final piece of the automation puzzle is connecting your monitoring system directly to your team's daily workflow. This means configuring alerts that are specific, contextual, and sent to the right place.
Instead of a generic "data error" email that gets lost in a crowded inbox, set up targeted notifications that can't be ignored. A great alert system should:
- Pinpoint the Problem: The alert must clearly state what broke (e.g., "Null rate for
utm_sourceexceeded 5%"). - Quantify the Impact: It should show the scope of the issue (e.g., "Affecting 1,200 events in the last hour").
- Deliver to the Right Channel: Send the alert directly to the team responsible, whether that’s a marketing channel in Slack or a high-priority ticket in Jira.
Imagine a world where a deployment accidentally breaks UTM tracking for your Google Ads. Within minutes, an automated alert pops up in your marketing team's Slack channel: "Warning: 95% of events from source: google-ads are missing the utm_campaign property."
The team can immediately roll back the change or push a hotfix, preventing days of corrupted data from ever polluting your reports. This isn't some futuristic ideal; it's what effective, automated data monitoring looks like today.
Fostering a Culture of Data Ownership
Automated tools and a rock-solid tracking plan will get you far, but they only solve half the problem. The other half is human. If you want to see lasting improvements in your data quality, you have to build a culture where data integrity is everyone’s job—not just an engineering task to be patched with more code.
This starts by taking the fear out of "data governance." For most teams, that term conjures up images of bureaucratic red tape and endless meetings. But in reality, good governance is just about creating clarity. It answers two simple but critical questions: Who is responsible for this data? And what does this data actually mean?
Assigning Clear Data Domains
First things first: stop treating your data like one giant, nebulous blob that "someone" owns. The most effective approach I've seen is to break it down into logical domains and assign clear owners—the people who are closest to where the data comes from and how it’s used.
This isn't about giving someone a new full-time job. It’s about making the informal ownership that already exists official. Think about it:
- Marketing Team: They live and breathe campaign data. Make them the official owners of all UTM parameters, ad spend, and lead source attribution. They define the standards and keep everyone consistent.
- Product Team: They’re obsessed with how people use the app, so they should own all in-app behavioral events. This covers everything from feature adoption metrics like
Feature-Enabledto critical user actions likeDocument-Signed. - Sales Team: The CRM is their world. They’re responsible for making sure deal stages, lead statuses, and customer information are accurate and current.
When you assign ownership, you create a direct line of accountability. If the UTMs are a mess, everyone knows to talk to Marketing. If a key product event stops firing, the Product team is on it. This simple change gets rid of the confusion that lets data quality issues fester for weeks. For a deeper dive, our article on what is data ownership breaks this down even further.
Creating a Living Data Dictionary
Once you know who owns what, the next step is to make sure everyone is speaking the same language. This is where a data dictionary comes in. It's a central document—your single source of truth—that defines every key metric and event your company tracks.
A data dictionary isn't a one-and-done project you create and then bury in a folder somewhere. It has to be a living resource, constantly updated as your business evolves, you launch new features, and your metrics get more refined.
You don't need a fancy, expensive tool for this. A simple table in Notion or even a shared Google Sheet is a fantastic starting point.
Here's a basic template that works wonders:
| Metric / Event | Owner | Description | Calculation / Trigger |
|---|---|---|---|
| Active User | Product | A user who has logged in and performed at least one key action in the last 7 days. | COUNT(DISTINCT user_id) WHERE last_seen < 7 days |
| Document-Signed | Product | Fired when a user successfully signs a document. | Triggered on callback from the e-signature API. |
| MQL | Marketing | A Marketing Qualified Lead, defined as a user who submitted a demo request form. | Fired on successful form submission event. |
A simple table like this prevents one of the most common reasons for mistrusting data: different teams using different definitions for the same metric. You know the drill—Marketing and Sales show up with conflicting reports, and the rest of the meeting is spent arguing about whose numbers are "right." A shared dictionary puts an end to that.
A Simple Workflow for Fixing Issues
With clear owners and definitions locked in, the final piece is having a straightforward process for when things (inevitably) break. A clean remediation workflow means issues get reported, triaged, and resolved fast.
Here’s a practical, four-step process you can steal and adapt:
- Report: Anyone on the team can flag a data quality issue in a dedicated Slack channel (like
#data-quality-alerts) or by creating a Jira ticket. The report should briefly describe the problem and link to the broken dashboard. - Triage: The relevant Data Owner gets tagged. They are responsible for investigating within 24 hours to confirm it's a real problem and figure out how bad it is.
- Resolve: The Data Owner coordinates the fix. If it's a tracking bug, they'll loop in engineering. If it’s a manual data entry error, they’ll work with the right operations team to get the source data corrected.
- Verify: Once the fix is live, the Data Owner confirms the data is flowing correctly and closes the loop by posting an update in the original Slack thread or ticket.
This closed-loop process does more than just fix bugs; it builds confidence across the entire company. It shows everyone that data quality is taken seriously and that there's a reliable system for making things right. This is how you stop talking about data quality and start embedding it into your team's DNA.
Frequently Asked Questions About Data Quality
Even with a solid plan, questions always come up when a team really digs into improving its data. Getting good answers to these common sticking points can be the difference between a project that stalls out and one that builds lasting trust in your numbers.
Let's walk through some of the most common questions we hear from teams getting serious about their data.
How Often Should We Conduct a Data Quality Audit?
It's tempting to think of an audit as a big, one-off project, but it's much more effective to treat it like a continuous habit. Once you've done that first deep dive to get your baseline, the real power comes from automated monitoring that keeps an eye on your most important data every single day. That's how you catch problems almost as they happen.
As for manual reviews, a quarterly check-in on your key data sources and dashboards is a great rhythm for most teams. It's also a really smart move to do a small, targeted audit right before and after a major feature launch or a big marketing campaign. This makes sure all your new tracking is firing exactly as planned from day one.
What Are the First Metrics We Should Fix?
When you're staring at a long list of issues, the answer is always to go where the money is. Prioritize the data that directly feeds into your revenue and core business decisions. Fixing these first gives you the biggest, fastest return on your effort.
I always tell teams to focus on these three areas for maximum impact:
- Core Conversion Events: Think sign-ups, demo requests, and purchases. If these are wrong or duplicated, your entire growth model is built on sand.
- Revenue Data: Get obsessive about this. Every transaction needs to be tied to the right user and the right marketing source. A small error here can completely wreck your LTV and CAC calculations, leading to some truly terrible decisions.
- User Identification: Without a consistent user ID, you can't see the full customer journey, calculate retention, or understand behavior over time. It's the one thing you can't compromise on.
Can a Privacy-First Analytics Tool Actually Improve Data Quality?
Yes, absolutely. In many ways, privacy-first tools improve data quality by their very design.
For instance, by not relying on third-party cookies, you automatically sidestep all the data gaps and inaccuracies caused by ad blockers, browser privacy features like ITP, and messy consent pop-ups. Right away, you're starting with a much cleaner and more complete dataset.
When you focus on first-party data, you’re building your analytics on a more reliable and trustworthy foundation. Controlling the data pipeline from end to end makes it so much easier to implement the robust validation, monitoring, and governance we've been talking about.
Tools that give you full ownership of your data are a huge advantage. You're not dealing with a black box. You have the power to enforce your own standards and ensure the data is clean from the moment it's collected.
What Is the Difference Between Data Cleaning and Data Quality?
This is a really important distinction to make.
Data cleaning is reactive. It's the frustrating, manual work of fixing errors after they're already in your system—deleting duplicate records, fixing typos, filling in missing values. It's necessary, but it's a sign that something upstream is broken.
Data quality is proactive. It's a strategic discipline focused on building the systems, processes, and culture to prevent bad data from ever being created. This includes everything from a clear tracking plan and automated validation rules to establishing who owns what and fostering a culture of accountability.
You'll probably always have to do some data cleaning, but a great data quality program means you'll be doing a lot less of it. The goal is to spend your time making confident decisions, not firefighting bad data.
Ready to build trust in your data with an analytics tool that puts quality and privacy first? Swetrix provides a clear, intuitive, and powerful platform to help you turn your website traffic into actionable insights without compromising user privacy. Start your 14-day free trial today and see the difference clean data can make.