- Date
Real User Monitoring Explained
 Andrii Romasiun
Imagine you've built a website. You run tests, check your servers, and everything looks great. The lights are on, so to speak. But are your actual visitors having a good experience? That’s the question Real User Monitoring (RUM) is designed to answer.
RUM is a type of performance monitoring that captures data directly from the browsers of your real users as they interact with your site. It’s not about checking things from a sterile lab environment; it’s about seeing your website's performance through your audience's eyes, giving you an unfiltered view of what they truly experience.
Uncovering the Real User Experience

Think of it this way: traditional server-side monitoring is like making sure your retail store has electricity and the cash register is working. You know the store is technically open for business, but you have no clue what’s happening on the shop floor.
Real User Monitoring is like having helpful staff discreetly observing every customer. They see when someone can't find what they're looking for, gets frustrated by a long checkout line, or trips over a misplaced box. It captures the messy, human side of the experience.
In the digital world, this means RUM tools passively collect essential frontend performance data from your users' devices. This isn't about spying—it's about understanding how your site performs "in the wild."
What RUM Actually Measures
Instead of just telling you if your server is online, RUM answers the questions that really matter for user happiness. By gathering data from every single session, you get a complete picture of your site's health. This includes crucial insights like:
- Page Load Times: How long does it really take for your page to load for someone in rural Australia on a shaky 3G connection?
- Interaction Delays: When a visitor clicks the "Add to Cart" button, is there a noticeable, frustrating lag before the site responds?
- Frontend Errors: Are specific JavaScript errors crashing your checkout page for everyone using an older version of Safari?
The Business Impact of RUM
This shift from just reacting to problems to proactively managing performance is a big deal. The Real User Monitoring market size was projected to hit about $10.5 billion in 2025, growing at an impressive annual rate of roughly 16%. This isn't just a tech trend; it shows that businesses are realizing that even small performance hiccups can lead to lost revenue and a damaged reputation. You can learn more about this growing market and what it means for companies today.
Ultimately, by collecting and analyzing this real-world data, you can pinpoint exactly where, when, and for whom your site is falling short. This gives you the power to make smart, data-backed decisions to build a faster, more stable, and genuinely better experience for everyone.
How RUM Technology Captures User Data

So, how does Real User Monitoring actually pull this off without bogging down your website? The secret is a small, lightweight snippet of JavaScript. Think of it as a discreet observer you place on your website.
This script runs quietly in the background of a user's browser, taking notes on critical performance events as they happen in real-time. It's watching everything from how long it takes for the page title to appear to whether a button click feels frustratingly slow.
Once it gathers this anonymous data, it sends it back to a central platform for analysis. This is how thousands of individual user sessions get stitched together into a clear, big-picture view of your website’s health.
The Asynchronous Advantage
Any time you add more code to your site, the first question is always: "Will this slow things down?" It's a valid concern. Fortunately, RUM scripts are built to avoid this very problem by loading asynchronously.
This simply means the RUM script loads completely independently of your main website content. Your page's text, images, and other critical elements can all render and become interactive without waiting for the monitoring script to do its thing. It’s like a delivery driver dropping off a package at the side door instead of blocking the main entrance—your customers can still get in and out without interruption.
This non-blocking approach is non-negotiable. One study found that a tiny 0.1-second improvement in site speed can boost conversions by 8.4%. A performance tool that actively hurts performance is worse than useless.
The script is smart enough to wait until the browser has a spare moment to send its collected data, often bundling multiple events into a single, efficient request. This keeps the impact on the user's network and device as minimal as possible.
From Raw Data to Actionable Insights
The RUM script captures a constant stream of timing events and interactions from every single user session. By itself, one user’s data is just a drop in the ocean. The real power of what is real user monitoring comes alive when all this data is aggregated and processed.
Your RUM platform takes these millions of individual data points and organizes them so you can spot patterns and trends. The whole process breaks down into three key steps:
- Data Capture: The JavaScript agent on your site collects performance metrics straight from the browser's own Navigation Timing API and logs user interactions.
- Data Processing: The platform receives this raw data, cleans it up, and starts sorting. It segments the information by browser, device type, country, and other useful dimensions.
- Data Visualization: Finally, all this processed data is presented in clear dashboards, charts, and graphs. You can instantly see things like, "Users in Australia on Firefox are seeing slow load times," which gives you a specific problem to start investigating.
By pulling all this data together, you can stop relying on anecdotal feedback and start making strategic decisions based on what your entire user base is actually experiencing.
The RUM Metrics That Actually Matter
Collecting data is easy. Knowing which numbers actually move the needle is the hard part. Real User Monitoring throws a ton of information your way, but the real skill is zeroing in on the metrics that directly impact how a visitor feels about your site.
It's not just us saying this—the market agrees. The global RUM market was valued at around USD 1.2 billion in 2024 and is expected to rocket to USD 3.75 billion by 2030. That’s a clear signal that businesses are waking up to the power of measuring what their users are really doing. You can explore the full market analysis to see the trend for yourself.
Understanding Core Web Vitals
If you want to understand modern web performance, you have to start with Google’s Core Web Vitals. These aren't just abstract numbers for developers; they are designed to quantify the actual experience of using a webpage.
Largest Contentful Paint (LCP): Think of this as the "time to useful content." It measures how long it takes for the main event—the largest image or block of text—to appear. On an e-commerce site, a slow LCP means your customer is just staring at a white screen instead of the product they came to see.
Interaction to Next Paint (INP): This is all about responsiveness. INP measures the delay between a user's click and the page actually reacting. When someone clicks "Add to Cart" and nothing happens for a second, the site feels broken. That's high INP in action, and it’s a huge source of frustration.
Cumulative Layout Shift (CLS): Ever tried to click a button, only for an ad to load and push it down, causing you to click the wrong thing? That's a layout shift. CLS measures how much your content unexpectedly moves around, which can make your site feel unstable and annoying.
Bottom line: Nailing these three metrics means your website feels quick, responsive, and reliable. They are the foundation of a great user experience.
Beyond the Core Metrics
While Core Web Vitals are critical, a few other metrics help you paint the full picture and diagnose problems more effectively. These often point to the "why" behind a poor Core Web Vital score.
To give you a clearer view, here’s a quick breakdown of the most important RUM metrics you should be watching:
Key Real User Monitoring Metrics Explained
| Metric Name | What It Measures | Why It's Important |
|---|---|---|
| Largest Contentful Paint (LCP) | The time it takes for the largest content element (image or text) to become visible. | Directly impacts the user's perception of loading speed. A slow LCP makes a site feel sluggish from the start. |
| Interaction to Next Paint (INP) | The latency of all user interactions (clicks, taps, key presses) with a page. | A high INP makes a site feel unresponsive and broken, leading to user frustration and abandonment. |
| Cumulative Layout Shift (CLS) | The amount of unexpected layout shift of visual page content. | High CLS creates a jarring, unstable experience where users might accidentally click on the wrong thing. |
| Time to First Byte (TTFB) | How long the browser waits to receive the first byte of data from the server. | A high TTFB points to server-side issues (slow database, inefficient code) that need to be fixed first. |
| JavaScript Error Rate | The frequency of JavaScript errors encountered by real users. | Spikes in this rate can indicate a broken feature, like a checkout process, that is actively costing you money. |
These metrics work together to give you a complete diagnostic toolkit. For example, a high Time to First Byte (TTFB) is a classic sign of a slow backend. No amount of frontend optimization will fix a server that takes too long to respond in the first place.
Similarly, keeping an eye on your JavaScript Error Rate is non-negotiable. If you push a new update and suddenly see this number spike, you can bet something important just broke for your users. Catching it early means you can fix the bug before it tanks your conversion rates.
If you want to dig deeper into these indicators, our complete guide on essential website performance metrics is a great next step.
RUM vs. Synthetic Monitoring: Choosing Your Tool
When you start digging into performance monitoring, one of the first questions that pops up is: what’s the difference between Real User Monitoring and Synthetic Monitoring? The easiest way to think about it is this: RUM is like having thousands of reporters sending live dispatches from the field, while Synthetic Monitoring is like running a controlled experiment in a lab.
RUM shows you what’s actually happening to your users out there in the wild, with all the messy, unpredictable variables that come with it. It uncovers problems that only surface on specific devices, sluggish networks, or in certain parts of the world.
On the other hand, Synthetic Monitoring runs automated scripts from a clean, stable server. The goal here is to create a consistent performance baseline and catch big, obvious problems before they ever make it to your users. It's perfect for pre-launch checks and basic uptime monitoring.
The Lab vs. The Real World
The fundamental difference comes down to where the data originates. Synthetic monitoring sends out robots—or automated scripts—to walk through specific user journeys, like a checkout flow or a login sequence, from predictable locations. It's designed to answer the question, "Is my site working as expected under ideal conditions?"
Real User Monitoring, however, gathers data from every single user session. This gives you a chaotic but incredibly honest picture of your site's performance. It answers a much more important question: "How is my site really performing for everyone—including the person on an old iPhone, with spotty Wi-Fi, and an aggressive ad-blocker?"
The smartest performance strategies don't pick one over the other; they use both. Synthetic monitoring sets the baseline and catches regressions, while RUM reveals the true, unfiltered user experience.
The flowchart below shows a typical troubleshooting process you might follow when RUM data flags an issue with your site's performance. It walks through how to evaluate loading, interactivity, and visual stability to find the root cause.
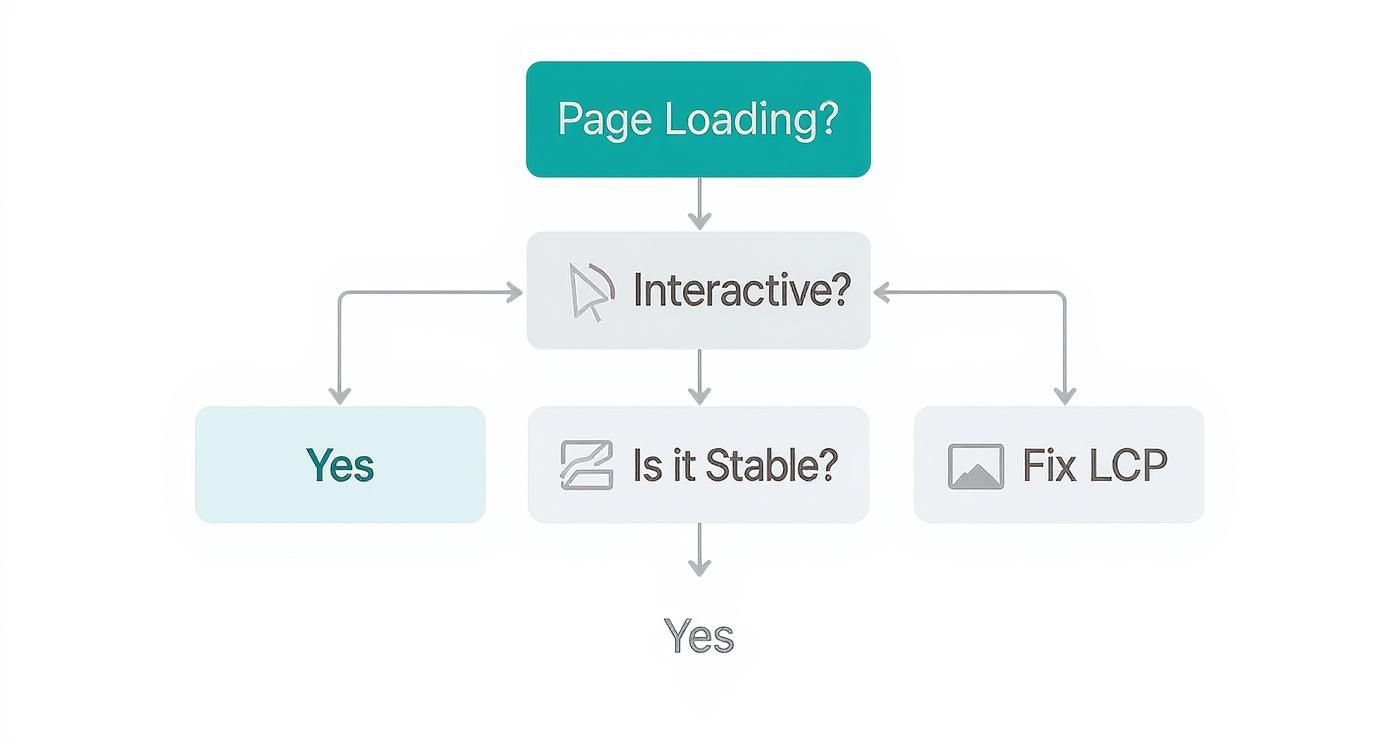
This kind of diagnostic flow is exactly what RUM enables, guiding developers from a high-level problem like "the site is slow" to a specific fix for a metric like Largest Contentful Paint (LCP).
A Side-by-Side Comparison
To make the distinction even clearer, let's break down how each approach stacks up across a few key features. This table provides a quick, side-by-side look at RUM and Synthetic Monitoring to help you decide which tool is right for the job.
| Feature | Real User Monitoring (RUM) | Synthetic Monitoring |
|---|---|---|
| Data Source | Actual user sessions | Automated scripts from controlled servers |
| Environment | Unpredictable real-world conditions | Stable, controlled lab environment |
| Primary Goal | Understand the true user experience | Establish a baseline and test for regressions |
| Best For | Diagnosing segment-specific issues | Uptime monitoring and pre-production testing |
| Typical Insights | "Users in Brazil on 3G networks see a 5-second LCP." | "The homepage load time increased by 200ms after the last deploy." |
| Coverage | Captures every user journey | Only tests predefined scripts and pathways |
While both have their place, RUM gives you the ground truth—the unfiltered story of what your users are actually experiencing.
When To Use Each Approach
Knowing when to deploy each method is crucial for building a solid monitoring strategy. And it’s a field that’s growing fast. The Real User Monitoring market was valued at around USD 1.8 billion in 2024 and is expected to hit USD 4.2 billion by 2033. A huge driver for this growth is the demand for better insights into mobile app performance, which you can read more about in this market analysis.
Here’s a simple breakdown of when to reach for each tool:
Use Synthetic Monitoring for:
- Uptime Monitoring: Get an instant alert the second your homepage goes down.
- Pre-Production Testing: Benchmark performance before a new feature is released to the public.
- Competitor Analysis: See how your site’s baseline speed compares to a competitor's.
Use Real User Monitoring for:
- Understanding Real-World Performance: See how your site holds up across thousands of different devices, browsers, and network speeds.
- Diagnosing Segment-Specific Issues: Figure out why users in a particular country or on a specific mobile network are running into trouble.
- Measuring Business Impact: Connect the dots between poor performance metrics and critical business outcomes, like bounce rates or conversion drops.
Ultimately, combining both creates a powerful feedback loop for your team. If you're looking to dive deeper, check out our guide to the best real user monitoring tools on the market today.
Putting RUM Data into Action
Insight without action is just data. The real magic of Real User Monitoring happens when you start using its metrics to solve actual business problems. RUM gives you the hard evidence to go from vague complaints like "the site feels slow" to specific, fixable issues that directly improve your user experience and boost your bottom line.
Think of it as the ultimate diagnostic tool connecting your site's technical health to real-world business outcomes. It shows you precisely where the friction is in a user’s journey, letting you make smart, informed decisions that actually move the needle.
Diagnosing a Conversion Killer
Here’s a classic e-commerce scenario. The marketing team sees a ton of abandoned carts. People are adding products, getting all the way to checkout, but then just... leaving. Standard analytics can't tell them why.
- Problem: High cart abandonment with no clear cause.
- Investigation: The development team turns to their RUM data and segments performance by geography. It doesn't take long to spot a glaring issue: users in Australia are hitting a wall during the payment step. Their Interaction to Next Paint (INP) for the "Confirm Purchase" button is over 2 seconds. That's an eternity when you're trying to give someone your money.
- Solution: The data points to a specific payment gateway API that’s just not cutting it in the APAC region. The fix? They switch to a more responsive payment provider for their Australian customers, and the latency vanishes almost overnight.
This is a perfect example of what is real user monitoring in action. It unearthed a hidden, revenue-draining problem that was impossible to see otherwise. The fix was simple, but finding it required drilling down into real user data.
Uncovering Third-Party Sabotage
Let's look at another common headache, this time for a digital publisher. Mobile readers are complaining the site is "jumpy" and hard to read. As a result, they're bouncing faster and not sticking around.
RUM doesn't just look at your code. It shows you exactly how third-party scripts—like ads, analytics tools, or social widgets—are affecting your users. These external scripts are often the secret culprits behind bad performance.
The team pulls up their RUM dashboard and filters for mobile devices. Right away, they see a huge spike in the Cumulative Layout Shift (CLS) metric, which tracks how much the page content unexpectedly moves around. Digging into the resource waterfall charts for sessions with high CLS, they nail the offender: a third-party ad script was loading late and aggressively resizing itself, making the whole page layout jiggle.
Once they knew the cause, the fix was easy. They configured the ad script to load inside a fixed-size container, which stopped it from shoving other content around. That one small change dramatically improved the reading experience, brought the CLS score back down to a healthy level, and helped win back their mobile audience.
How to Implement RUM Without Sacrificing Privacy
Let's clear up a common misconception: you don't have to choose between collecting user data and respecting privacy. Modern Real User Monitoring is all about measuring performance, not tracking individuals. You can absolutely get the insights you need to improve your website without breaking user trust or running afoul of regulations like GDPR and CCPA.
The secret lies in picking a RUM solution that was built with privacy at its core. These tools are designed from the ground up to only collect anonymous, aggregated data. They steer clear of any personally identifiable information (PII), which means you can never single out an individual from the performance metrics you're analyzing.
Anonymization Is the Standard
So how do they do it? Privacy-first RUM platforms have several safeguards built right in. These aren't just add-ons; they're fundamental techniques that ensure your monitoring stays compliant and ethical.
Here are a few of the key privacy-preserving methods in action:
- IP Address Anonymization: Your user's full IP address is never stored. It’s either partially masked or completely thrown away right after figuring out a general geographic location (like the country, not their street).
- No Cookies or Fingerprinting: Ethical RUM doesn't rely on persistent cookies or sneaky browser fingerprinting techniques that can follow users across different websites or sessions.
- No Session Recordings: Unlike some analytics tools that act like a screen recorder, privacy-focused RUM isn’t watching what users do. The data is purely about numerical performance metrics—things like load times and errors—not a video of their every move.
By focusing on these anonymous data points, you get a clear picture of how your site performs for different user segments—like users in a specific country or on a certain browser—without ever knowing who those users are.
This whole approach proves that you can have your cake and eat it too. Optimizing your site and respecting user privacy really can go hand-in-hand. To dive deeper, check out our guide on privacy-friendly analytics.
Still Have a Few Questions About RUM?
Even when you see the value, it's smart to ask a few practical questions before adding any new tool to your stack. Let's tackle some of the most common ones we hear about Real User Monitoring so you can move forward with confidence.
Will This Script Slow Down My Website?
This is easily the most important question, and the one we get asked the most. The short answer is no, as long as it's a well-designed script. Modern RUM tools are incredibly lightweight and built to load asynchronously.
This just means the RUM script loads on a separate track, completely independent of your main content. It doesn’t get in the way of your images, text, or interactive elements. Think of it as letting your visitors' car merge onto the highway first, while the monitoring script waits patiently on the on-ramp. It does its job without ever causing a traffic jam for the user.
Isn't This Just Like Google Analytics?
It's an easy mistake to make, but they actually answer two very different questions. Google Analytics is all about user behavior—it tells you what your users are doing. You’ll see which pages they visit, how long they stick around, and which marketing channels brought them to you.
Real User Monitoring, on the other hand, is about user experience—it tells you how the website performed for them during that visit. RUM is what alerts you when a page took forever to load, a button didn't respond when clicked, or a background script crashed and broke a feature.
To put it simply: Google Analytics tells you about your marketing effectiveness. RUM tells you about your website’s technical health. They work great together, but they don't do the same job.
Can I Use RUM for My Mobile App Too?
Of course! In fact, you definitely should. Performance on a mobile app is just as critical as it is on a website, if not more so.
Most RUM providers offer dedicated Software Development Kits (SDKs) for both iOS and Android. These aren't just web scripts shoehorned into an app; they’re built from the ground up to capture mobile-specific data like app start times, choppy screen transitions, and failed network requests. You get the same level of deep insight into your native app experience.
Ready to see exactly what your users are experiencing—without invading their privacy? Swetrix delivers powerful, privacy-first Real User Monitoring and web analytics that help you build a faster, more reliable website. Start your 14-day free trial today and start turning performance data into your competitive advantage.