- Date
Top 12 Real User Monitoring Tools for 2025
 Andrii Romasiun
In a competitive market, understanding your application's real-world performance is critical. Synthetic tests and lab environments only show part of the picture; they can't replicate the diverse browsers, devices, network conditions, and user interactions your application faces daily. This is where real user monitoring (RUM) tools become indispensable. They capture and analyze every user session, providing the ground-truth data needed to diagnose performance bottlenecks, javascript errors, and usability issues that directly impact user experience and conversions.
This guide is designed to help you navigate the crowded market of real user monitoring tools and find the perfect fit for your specific needs. We’ve moved beyond generic marketing claims to provide a detailed, practical comparison of the top 12 solutions available today. Whether you're a startup founder prioritizing privacy and self-hosting, a product manager mapping user journeys, or a DevOps engineer focused on end-to-end observability, this listicle has you covered.
Here, you'll find a comprehensive breakdown of each tool, including:
- Key Features: Analysis of core RUM metrics, error tracking, and session replay capabilities.
- Use Cases: Practical scenarios for product teams, developers, and agencies.
- Pros & Cons: An honest assessment of strengths and limitations.
- Pricing & Integrations: A clear look at cost structures and ecosystem compatibility.
- Privacy Focus: Special attention to GDPR compliance, self-hosting options, and how alternatives like Swetrix stand out.
Each entry includes screenshots and direct links, making it easy for you to evaluate your options and make an informed decision quickly. We'll cut through the noise to help you select a RUM tool that delivers actionable insights, improves your application's performance, and respects user privacy.
1. Swetrix
Swetrix is an open-source, privacy-focused analytics and real user monitoring (RUM) platform designed for developers, startups, and agencies who prioritize data ownership and user privacy. It offers a clean, lightweight alternative to mainstream analytics giants, focusing on essential metrics without the complexity or intrusive tracking.
Its core strength lies in its dual offering: a hassle-free cloud version and a self-hostable option. This flexibility makes it a top choice for teams needing full control over their data infrastructure to comply with GDPR, CCPA, and other privacy regulations. Swetrix collects performance data like First Contentful Paint (FCP) and Largest Contentful Paint (LCP), tracks JavaScript errors, and provides insights into user sessions, all while avoiding cookies and user fingerprinting by default.
The user interface is minimalist and intuitive, presenting data in a way that is immediately actionable without overwhelming users. For those seeking deeper integration, Swetrix provides a robust API for custom data pipelines and dashboards.
Key Features & Use Cases
- Privacy-First Analytics: Ideal for businesses targeting European markets or any organization that wants to respect user privacy without sacrificing key insights. It's a powerful tool for marketing teams needing GDPR-compliant campaign tracking.
- Self-Hosting Option: DevOps and engineering teams can deploy Swetrix on their own servers for complete data sovereignty and customization.
- Performance Monitoring: Developers use it to monitor Core Web Vitals and track JS errors in production, allowing them to quickly identify and resolve front-end performance bottlenecks.
Swetrix stands out as one of the best real user monitoring tools for those who demand both powerful analytics and ethical data practices. The ability to self-host is a game-changer for data-sensitive industries.
Pricing & Implementation
- Pricing: Swetrix offers a generous free tier for up to 10,000 events per month. Paid plans are affordable, starting from $5/month for the Startup plan and scaling up for higher traffic needs.
- Implementation: Setup is straightforward. You just need to add a small JavaScript snippet to your website’s
<head>tag. For self-hosting, Docker-based deployment simplifies the process significantly.
| Feature | Swetrix |
|---|---|
| Primary Focus | Privacy-first analytics, performance monitoring |
| Self-Hosting | Yes, fully supported and open-source |
| Core RUM Metrics | Core Web Vitals, page load times, JS errors |
| Session Analysis | User journey funnels, event tracking |
| Ease of Setup | High (simple script installation) |
| Ideal For | Startups, agencies, privacy-conscious companies |
Website: https://swetrix.com/
2. Datadog – Real User Monitoring (RUM)
Datadog offers a comprehensive, full-stack real user monitoring (RUM) solution designed for large-scale web and mobile applications. As part of its broader observability platform, Datadog's RUM provides deep insights into front-end performance by automatically capturing Core Web Vitals and over 30 other out-of-the-box metrics. It excels at correlating user-facing performance issues with back-end traces, logs, and infrastructure metrics.
This tight integration makes it an exceptional choice for engineering and DevOps teams already embedded in the Datadog ecosystem. Users can seamlessly pivot from a slow page load identified in RUM to the exact back-end trace or log error that caused it. The platform also includes powerful features like optional Session Replay, which provides visual context for user sessions and errors.
Datadog’s sophisticated dashboarding and alerting capabilities allow teams to build a holistic view of application health, from front-end user experience to back-end service performance. The long default retention period for metrics (up to 15 months) is also a significant benefit for historical trend analysis.
Key Features & Use Cases
- Integrated Observability: Ideal for engineering teams that need to connect front-end performance directly with back-end traces (APM) and logs, providing a single pane of glass for troubleshooting.
- Web & Mobile Monitoring: Product and mobile development teams use it to monitor user experience across different platforms, track errors, and analyze performance trends on both web and native mobile apps.
- Performance Baselining: DevOps can leverage its extensive metrics and alerting to set Service Level Objectives (SLOs) for user-facing performance and get notified of regressions immediately.
Datadog is one of the most powerful real user monitoring tools for teams seeking a unified observability platform. Its ability to correlate user experience data with back-end traces and logs is unparalleled.
Pricing & Implementation
- Pricing: Datadog RUM is priced per 1,000 user sessions, with transparent billing definitions. Costs can grow with add-ons like Session Replay and extended retention for raw data.
- Implementation: Setup involves installing a Datadog RUM SDK (available for browsers, iOS, and Android) and initializing it with a client token and application ID.
| Feature | Datadog – Real User Monitoring (RUM) |
|---|---|
| Primary Focus | Full-stack observability, integrated monitoring |
| Self-Hosting | No, SaaS-only platform |
| Core RUM Metrics | Core Web Vitals, 30+ built-in metrics, errors |
| Session Analysis | Session Replay (add-on), user journey views |
| Ease of Setup | Medium (requires SDK integration) |
| Ideal For | Enterprises, teams using Datadog APM/Logs |
Website: https://www.datadoghq.com/pricing/
3. New Relic – Browser (RUM) within the New Relic platform
New Relic offers Browser RUM as a core component of its comprehensive observability platform. It is designed for teams that want to consolidate their monitoring tools, combining front-end performance data with backend APM, infrastructure metrics, and logs in a single, unified interface. This approach eliminates vendor sprawl and simplifies troubleshooting across the entire stack.
Its strength lies in its "all-in-one" nature and a generous free tier that makes it accessible for teams of all sizes. New Relic captures vital Core Web Vitals, distributed traces, and JavaScript errors, providing a holistic view of the user experience. This integration allows developers to trace a front-end slowdown directly back to a specific backend service or database query, streamlining the debugging process.

The platform presents data through a powerful and customizable web analytics dashboard, enabling teams to correlate front-end performance with business outcomes. For organizations already invested in New Relic for APM, adding Browser RUM is a natural and highly effective extension.
Key Features & Use Cases
- Unified Observability: Ideal for DevOps and SRE teams who need to connect front-end user experience issues with backend performance problems without switching between different tools.
- Full-Stack Troubleshooting: Developers use its distributed tracing to follow a user request from the browser, through microservices, to the database, drastically reducing mean time to resolution (MTTR).
- Performance Baselining: Product teams can monitor Core Web Vitals and other RUM metrics over time to measure the impact of new feature releases on real-world performance.
New Relic excels as one of the best real user monitoring tools for organizations seeking a single, powerful platform to monitor their entire technology stack, from the user's browser to the underlying infrastructure.
Pricing & Implementation
- Pricing: New Relic provides a perpetual free tier with 100 GB of data ingest per month and one full-platform user. Paid plans are based on data ingest and the number of full-platform users, offering transparent, scalable pricing.
- Implementation: Setup is straightforward, typically involving the addition of a JavaScript snippet to your website or using an APM agent to auto-inject the script.
| Feature | New Relic |
|---|---|
| Primary Focus | Unified observability, full-stack monitoring |
| Self-Hosting | No, SaaS-only platform |
| Core RUM Metrics | Core Web Vitals, distributed tracing, JS errors |
| Session Analysis | Session traces, user-centric performance views |
| Ease of Setup | High (script installation or agent auto-injection) |
| Ideal For | Enterprises, DevOps teams, full-stack developers |
Website: https://newrelic.com/pricing
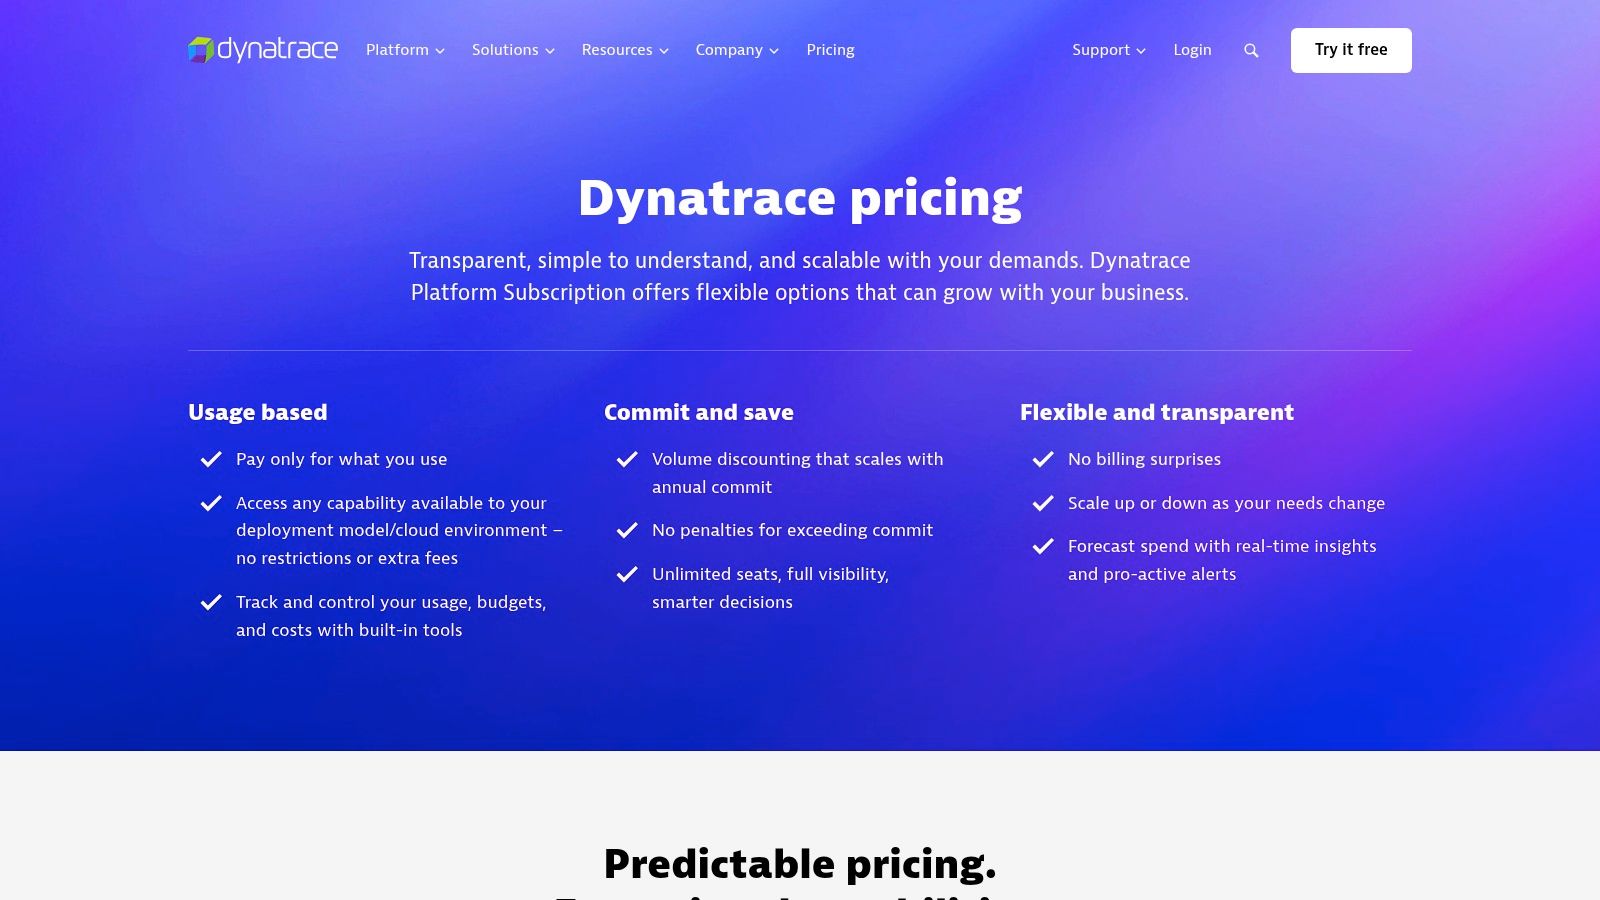
4. Dynatrace – Real User Monitoring
Dynatrace offers an enterprise-grade real user monitoring solution deeply integrated into its full-stack observability platform. It is designed for large organizations that require comprehensive visibility from the end-user's browser or mobile device all the way through their complex backend infrastructure. The platform leverages its AI engine, Davis, to automatically pinpoint the root cause of performance issues.
The core strength of Dynatrace is its ability to correlate user experience data with backend performance metrics in a single, unified view. It captures not just Core Web Vitals and JavaScript errors but also provides end-to-end transaction visibility, making it a powerful tool for DevOps and SRE teams in complex environments. Features like optional Session Replay further enhance its diagnostic capabilities.
Its predictable, session-based pricing model is transparent, which is a significant advantage for budget planning at the enterprise scale. While the platform's depth offers unparalleled insights, it can present a steeper learning curve for smaller teams or those new to advanced observability concepts.
Key Features & Use Cases
- Enterprise-Scale Observability: Ideal for large corporations with complex, multi-layered applications who need to connect user-facing performance issues directly to backend services, containers, or infrastructure problems.
- AI-Powered Root Cause Analysis: DevOps and SRE teams use Davis AI to automatically identify the precise cause of slowdowns or errors, drastically reducing mean time to resolution (MTTR).
- Digital Experience Monitoring (DEM): Product and digital experience teams leverage the combination of RUM and synthetic monitoring to proactively manage and optimize the entire user journey across web and mobile applications.
Dynatrace excels at providing a unified, AI-driven platform that makes it one of the best real user monitoring tools for enterprises needing to cut through complexity and find answers fast.
Pricing & Implementation
- Pricing: Dynatrace uses a transparent, usage-based pricing model. Real User Monitoring is priced per session, with separate costs for Session Replay. A published rate card is available on their website, though estimating traffic is necessary for budgeting.
- Implementation: Deployment involves adding the Dynatrace OneAgent to your hosts or a JavaScript tag to your website. While straightforward, full integration benefits from a planned rollout to leverage its extensive auto-discovery features.
| Feature | Dynatrace |
|---|---|
| Primary Focus | Full-stack observability, AI-powered root cause analysis |
| Self-Hosting | No, SaaS-based platform |
| Core RUM Metrics | Core Web Vitals, end-to-end transaction tracing, errors |
| Session Analysis | User journey analysis, optional Session Replay |
| Ease of Setup | Moderate (requires strategic deployment for full benefit) |
| Ideal For | Large enterprises, complex application environments, DevOps teams |
Website: https://www.dynatrace.com/pricing/
5. Splunk Observability Cloud – Real User Monitoring
Splunk Observability Cloud provides a powerful real user monitoring (RUM) solution designed for enterprise-grade applications where frontend performance is directly linked to backend services. Its primary strength is its native integration with Application Performance Monitoring (APM), offering a unified view that connects user experience with underlying infrastructure and application code.
The platform is built on OpenTelemetry, ensuring a modern, vendor-neutral approach to data collection. Splunk captures full-fidelity, no-sample RUM data, providing detailed session waterfalls and even Session Replay to help developers diagnose complex user-facing issues. This end-to-end visibility is crucial for DevOps and SRE teams tasked with maintaining performance across complex, distributed systems.
Splunk’s RUM is engineered for deep correlation, allowing teams to trace a poor user interaction on a website or mobile app directly to a slow database query or a failing microservice on the backend. This makes it one of the most comprehensive real user monitoring tools for organizations already invested in a broader observability strategy.
Key Features & Use Cases
- End-to-End Correlation: Ideal for DevOps and SRE teams needing to connect a slow page load (RUM) with a specific backend transaction trace (APM). This helps pinpoint the root cause of performance issues, whether in the browser or the server.
- Mobile Application Monitoring: Product and engineering teams with native iOS and Android apps use Splunk’s mobile SDKs to get the same level of performance insight and error tracking as their web applications.
- Session Replay and Diagnostics: Support and development teams use Session Replay to visually reconstruct user sessions, making it easier to reproduce bugs and understand user frustration without needing to ask for screenshots.
Splunk excels at unifying frontend and backend performance data, offering a level of cross-stack correlation that is essential for complex, modern applications. Its OpenTelemetry-native approach future-proofs your observability stack.
Pricing & Implementation
- Pricing: Splunk's pricing for RUM is often bundled within the broader Observability Cloud suite and typically requires contacting sales for a custom quote. This can be a barrier for teams looking for transparent, self-service pricing.
- Implementation: Setup involves using OpenTelemetry-native instrumentation for web applications or dedicated SDKs for iOS and Android. Splunk provides clear documentation and guided setup to streamline the process.
| Feature | Splunk Observability Cloud – RUM |
|---|---|
| Primary Focus | End-to-end observability, RUM-to-APM correlation |
| Self-Hosting | No, SaaS-only platform |
| Core RUM Metrics | Core Web Vitals, session waterfalls, mobile vitals |
| Session Analysis | Session Replay, full-fidelity tracing |
| Ease of Setup | Medium (requires instrumentation knowledge) |
| Ideal For | Enterprises, DevOps/SRE teams, complex apps |
Website: https://www.splunk.com/en_us/products/real-user-monitoring.html
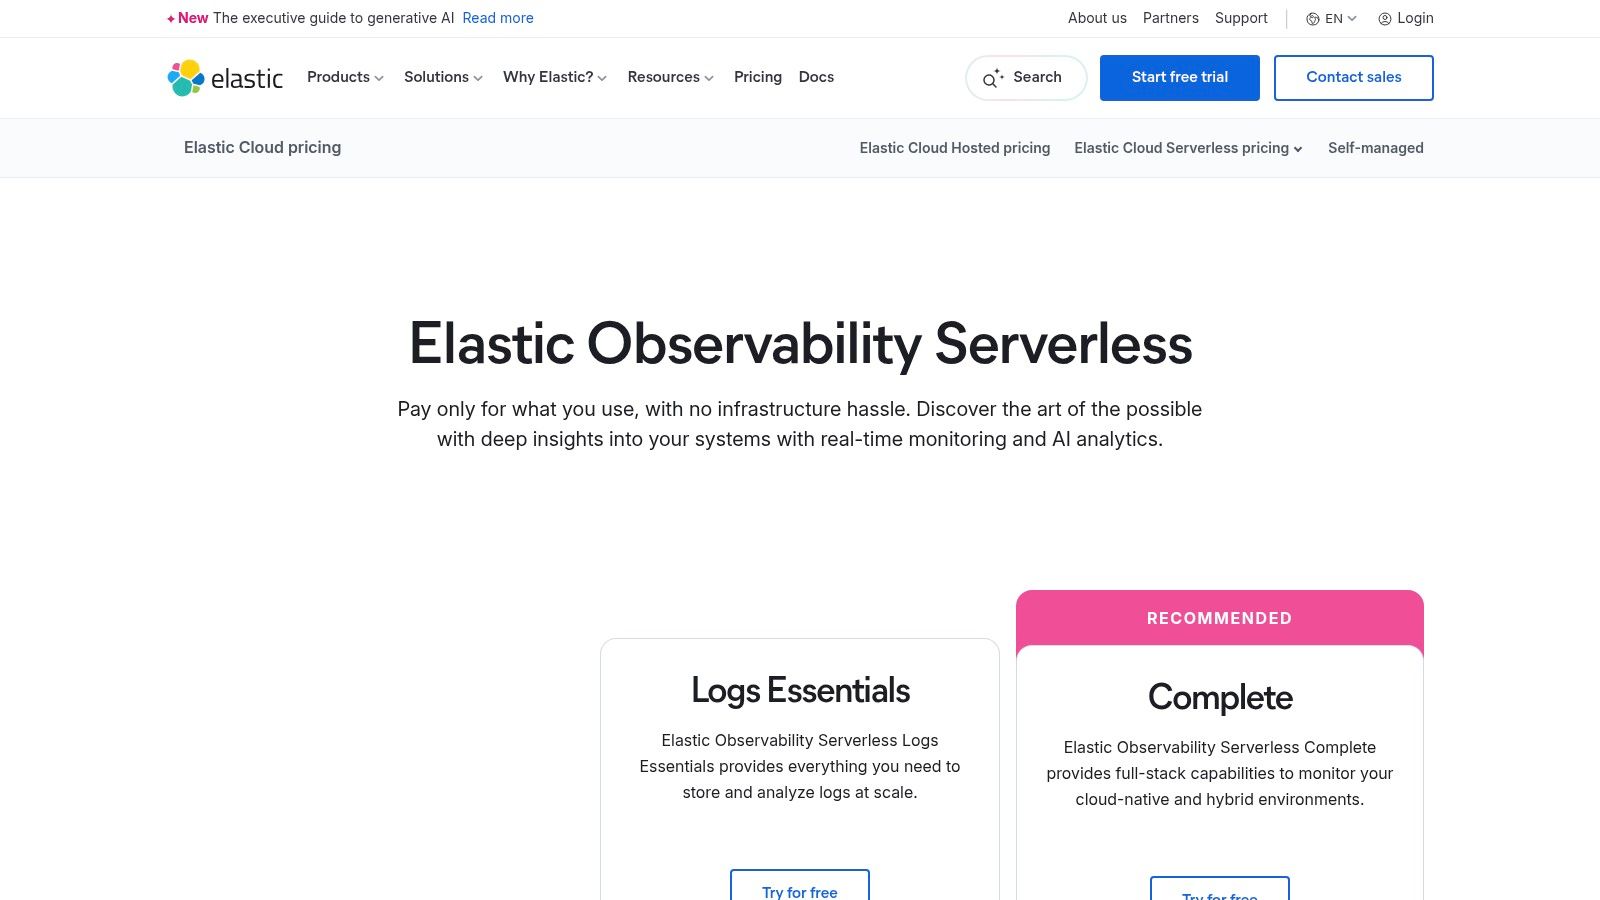
6. Elastic Observability (Elastic APM RUM)
Elastic Observability extends the powerful Elastic Stack (formerly ELK Stack) into the front-end with its Real User Monitoring capabilities, delivered via its APM JavaScript agent. It is designed for engineering and DevOps teams who already use or want to adopt the Elastic ecosystem for a unified view of their application performance, from server-side traces to client-side user interactions.
Its primary advantage is the integration of RUM data with logs, metrics, and APM traces within a single datastore. This allows teams to correlate a poor front-end experience directly with a back-end error or infrastructure issue using the powerful Kibana query and visualization tools. Available as a self-managed solution or on Elastic Cloud, it offers immense flexibility in deployment and data retention policies.
Elastic’s RUM agent captures critical performance telemetry, including Core Web Vitals, page load events, and JavaScript errors. This makes it an excellent choice for organizations that need to consolidate their observability tools and leverage a single, powerful platform for deep analysis.
Key Features & Use Cases
- Unified Observability: Ideal for teams that want to break down data silos. DevOps can trace a user-reported slowdown from the RUM dashboard directly to the specific back-end service trace and relevant logs.
- Powerful Data Analysis: Data engineers and SREs use Kibana to build custom dashboards, set up sophisticated alerts, and perform ad-hoc analysis on RUM data, far beyond what many standalone RUM tools offer.
- Flexible Deployment: Organizations with strict data residency or security requirements can opt for the self-managed version, while others can leverage the serverless Elastic Cloud for ease of use and scalability.
Elastic Observability is one of the most powerful real user monitoring tools for teams seeking to unify front-end performance data with their back-end logs, metrics, and traces in a single, highly searchable platform.
Pricing & Implementation
- Pricing: Elastic Cloud offers a usage-based, serverless pricing model based on data ingestion, storage, and querying. This can be cost-effective for smaller projects but requires careful cost modeling for high-volume applications. The self-managed option's cost depends on your own infrastructure.
- Implementation: Requires installing the APM JavaScript agent on your website and configuring the Elastic Stack (APM Server, Elasticsearch, Kibana) to receive and process the RUM data. While more involved than simple snippet-based tools, it offers far greater control.
| Feature | Elastic Observability (Elastic APM RUM) |
|---|---|
| Primary Focus | Unified observability, data correlation |
| Self-Hosting | Yes, a core offering of the Elastic Stack |
| Core RUM Metrics | Core Web Vitals, resource timings, JS errors |
| Session Analysis | User session views correlated with traces/logs |
| Ease of Setup | Moderate (requires Elastic backend configuration) |
| Ideal For | Enterprises, DevOps, teams using Elastic Stack |
Website: https://www.elastic.co/pricing/serverless-observability/
7. Sentry – Frontend Performance + Session Replay (RUM‑like)
Sentry is a developer-centric monitoring platform that excels at unifying errors, performance traces, and Session Replay into a single, cohesive workflow. While primarily known for its powerful error tracking, it has evolved into a robust solution for frontend performance, offering many capabilities found in traditional real user monitoring tools, but with a strong focus on code-level context and debugging.
Its core advantage is providing developers with a direct line from a poor user experience, like a slow page load or a UI freeze, straight to the offending lines of code and related API calls. It captures vital frontend metrics and user interactions, connecting them seamlessly with backend performance traces and error reports. This unified approach removes the friction of switching between different tools to diagnose and resolve issues. You can explore a deeper dive into modern error tracking solutions here.
Sentry's user interface is designed for engineering teams, presenting complex data in a way that accelerates the debugging process. The platform is highly extensible, with SDKs for nearly every major framework and language, making it a versatile choice for modern, complex applications.
Key Features & Use Cases
- Unified Error & Performance Monitoring: Ideal for frontend teams needing to see how performance issues (e.g., slow INP) and JavaScript errors impact the user experience. It directly links performance bottlenecks to specific code commits.
- Session Replay for Debugging: Developers use Session Replay to visually reproduce user sessions that led to an error or performance problem, providing critical context that logs alone cannot offer.
- Code-Level Diagnostics: DevOps and SRE teams use Sentry to get detailed stack traces, breadcrumbs, and performance data, enabling them to quickly identify the root cause of an issue in production environments.
Sentry excels by connecting frontend performance data directly to the code that caused it. For developer teams focused on rapid debugging and issue resolution, its unified platform is a significant productivity booster.
Pricing & Implementation
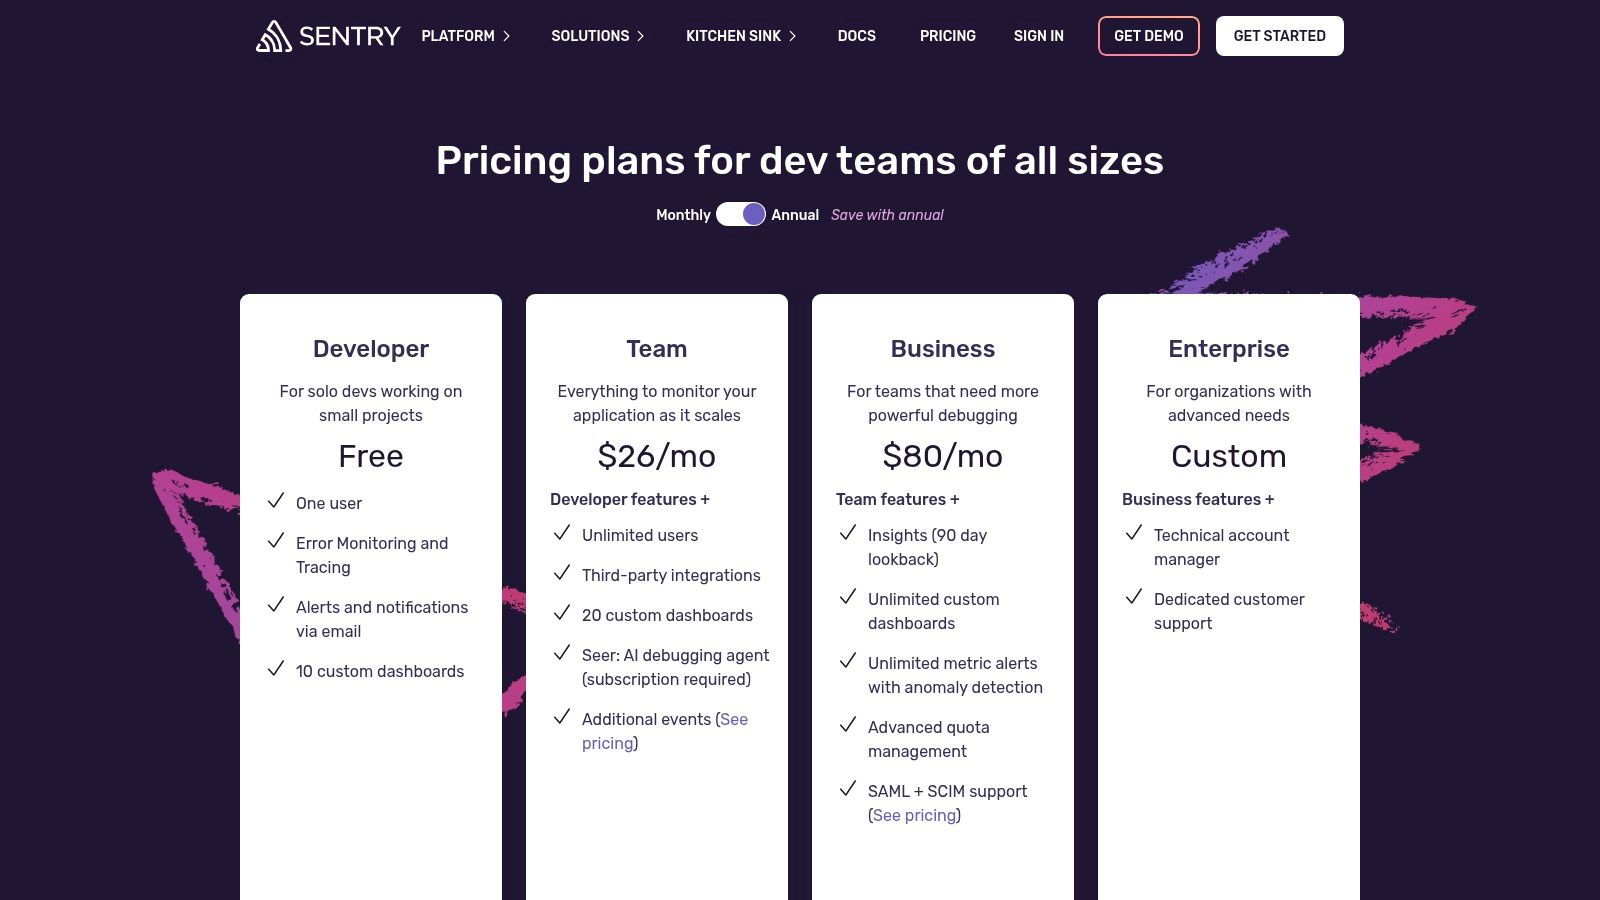
- Pricing: Sentry offers a free Developer plan suitable for personal projects. Paid plans (Team and Business) scale based on event volume and feature needs, with competitive pricing for small to medium-sized teams.
- Implementation: Setup is exceptionally fast, especially for JavaScript frameworks. Installing the relevant Sentry SDK and adding a few lines of configuration code is all that’s required to start monitoring.
| Feature | Sentry |
|---|---|
| Primary Focus | Error tracking, frontend performance, debugging |
| Self-Hosting | Yes, an open-source option is available |
| Core RUM Metrics | Web Vitals, transaction traces, crashes, replays |
| Session Analysis | Session Replay, breadcrumbs, user interaction traces |
| Ease of Setup | High (extensive SDKs and documentation) |
| Ideal For | Developers, frontend teams, engineering-led orgs |
Website: https://sentry.io/pricing/
8. SpeedCurve – Real User Monitoring and Synthetic Monitoring
SpeedCurve is a specialized web performance platform that powerfully combines real user monitoring (RUM) with synthetic monitoring. It’s purpose-built for performance engineers, developers, and UX teams who need to connect lab-tested data with real-world user experiences. The platform excels at translating complex performance metrics into actionable business and user experience insights.

Its main advantage is the tight integration between RUM and synthetic checks, allowing teams to correlate performance budgets and Core Web Vitals with actual user-facing issues. SpeedCurve's visualizations are a major highlight, offering unique dashboards like the "Luxury Index" which measures user-perceived performance beyond standard metrics. It also provides detailed filmstrips and waterfall charts to help pinpoint the root cause of slowdowns. For a deeper dive into similar tools, you can explore other website performance monitoring tools.
The platform's flexible, build-your-own pricing model allows organizations to create a plan that fits their specific needs for RUM page views and synthetic checks, making it an adaptable choice among real user monitoring tools.
Key Features & Use Cases
- Correlated Performance Data: Ideal for performance engineering teams that need to validate synthetic test results against real user data to prioritize optimizations effectively.
- Competitive Benchmarking: Marketing and product teams use SpeedCurve to continuously monitor competitor performance, gaining insights into how their site stacks up on key UX metrics.
- Third-Party Script Analysis: Developers can identify and analyze the performance impact of third-party scripts, helping them make informed decisions about which services to use or optimize.
SpeedCurve excels by offering a unified view of synthetic and real user data, providing performance-obsessed teams with the context they need to build genuinely fast user experiences.
Pricing & Implementation
- Pricing: SpeedCurve uses a transparent, usage-based model. You build your own plan by combining RUM page views (starting at $15/month for 100k views) and synthetic checks (starting at $15/month for 5k checks). A calculator is available on their site.
- Implementation: RUM implementation requires adding a small JavaScript snippet to your site. Synthetic monitoring is configured within the SpeedCurve dashboard by providing URLs and test parameters.
| Feature | SpeedCurve |
|---|---|
| Primary Focus | Correlating RUM and synthetic performance data |
| Self-Hosting | No |
| Core RUM Metrics | Core Web Vitals, custom timers, UX metrics |
| Session Analysis | Limited to performance-centric user segments |
| Ease of Setup | High (simple script installation) |
| Ideal For | Performance engineers, UX teams, e-commerce |
Website: https://www.speedcurve.com/pricing/
9. Raygun – Real User monitoring
Raygun is a comprehensive diagnostics platform that combines Real User Monitoring (RUM) with crash reporting and Application Performance Monitoring (APM). Its RUM solution is engineered for product managers and front-end development teams who need to connect user experience directly to performance issues, offering deep insights into how real users interact with an application.
The platform excels at providing granular, user-centric data. It captures Core Web Vitals, custom timings, and detailed session traces, allowing teams to see exactly what a user experienced leading up to a performance problem or crash. Raygun links front-end user sessions with back-end traces, providing a full-stack view that is invaluable for root-cause analysis. Its clear, session-based pricing makes it an accessible choice for SMBs and mid-market companies.
The user interface presents performance data through actionable dashboards and alerts tailored to UX monitoring. This focus on user experience metrics makes it one of the most effective real user monitoring tools for teams dedicated to optimizing digital interactions and resolving customer-facing issues quickly.
Key Features & Use Cases
- Full-Stack Observability: Ideal for engineering and DevOps teams that need to correlate front-end performance issues (like slow load times) with back-end errors or API latency, all within a single platform.
- Detailed User Session Tracking: Product and support teams use Raygun to diagnose individual user complaints by replaying their journey, viewing page loads, and identifying specific errors they encountered.
- Proactive UX Monitoring: Web teams set up custom alerts on Core Web Vitals and other key performance indicators to proactively identify and fix regressions before they impact a large number of users.
Raygun's strength is its ability to connect the dots between a poor user experience and the underlying code-level problem, making it a powerful diagnostic tool for any web development team.
Pricing & Implementation
- Pricing: Raygun offers clear, per-session pricing for its RUM product. Plans start at $12 per 10,000 sessions per month, with generous quotas and predictable on-demand overage rates. Higher-tier plans add features like SAML SSO.
- Implementation: Setup is fast and straightforward, requiring only the addition of a small JavaScript snippet to your website. The platform provides clear instructions for various frameworks and environments.
| Feature | Raygun |
|---|---|
| Primary Focus | Correlating UX metrics with code-level issues |
| Self-Hosting | No |
| Core RUM Metrics | Core Web Vitals, page-level insights, custom timings |
| Session Analysis | Detailed session traces, user journey tracking |
| Ease of Setup | High (simple script installation) |
| Ideal For | SMBs, mid-market, product and engineering teams |
Website: https://raygun.com/pricing?utm_source=openai
10. SolarWinds Pingdom – Real User Monitoring
SolarWinds Pingdom is a well-established and trusted name in website monitoring, offering a powerful combination of synthetic monitoring and Real User Monitoring (RUM). It is designed for businesses of all sizes that need a straightforward, reliable way to track website availability, page speed, and actual user experiences without the complexity of a full-stack observability platform.
The platform's strength lies in its simplicity and clarity. Pingdom translates complex performance data into easy-to-digest reports and visualizations, making it accessible to non-technical stakeholders like marketers and business managers. Its RUM capabilities provide a live map of user activity, track key UX metrics, and analyze user behavior with an impressive 13-month data retention period, allowing for long-term trend analysis.
For enterprise teams, Pingdom simplifies procurement as it can often be purchased through existing enterprise resellers. This, combined with its simple plan structure and unlimited user seats, makes it a practical choice for organizations that need to quickly deploy effective monitoring tools.
Key Features & Use Cases
- Combined Synthetic & RUM: Ideal for operations and DevOps teams that need to monitor uptime and baseline performance (synthetics) while also understanding how real users are experiencing the site (RUM).
- Stakeholder Reporting: Marketing and management teams use Pingdom’s clear dashboards to track how site speed impacts user engagement and conversions across different regions and devices.
- Long-Term Performance Analysis: Product managers and developers leverage the 13-month data retention to analyze performance trends, measure the impact of releases over time, and make data-driven optimization decisions.
Pingdom excels at delivering essential RUM and synthetic monitoring insights in a single, user-friendly package. Its straightforward setup and clear reporting make it one of the best real user monitoring tools for teams who need actionable data without a steep learning curve.
Pricing & Implementation
- Pricing: Pingdom offers a 14-day free trial. Pricing is based on pageviews and the number of synthetic/uptime checks needed. Plans are transparent, though users may need to adjust their site's country settings to see USD pricing.
- Implementation: Setup is very simple. Implementing RUM requires adding a small JavaScript tag to your website's header, which can be done in minutes.
| Feature | SolarWinds Pingdom |
|---|---|
| Primary Focus | Combined RUM, synthetic, and uptime monitoring |
| Self-Hosting | No, SaaS only |
| Core RUM Metrics | Page load times, geo-performance, UX metrics |
| Session Analysis | User behavior flows, live user maps |
| Ease of Setup | High (simple script installation) |
| Ideal For | SMBs, enterprise teams, non-technical stakeholders |
Website: https://www.pingdom.com/pricing/?utm_source=openai
11. Amazon CloudWatch RUM (AWS)
Amazon CloudWatch RUM is AWS's native real user monitoring service designed for teams deeply embedded in the Amazon Web Services ecosystem. It collects client-side performance data and JavaScript errors, feeding them directly into the broader CloudWatch monitoring suite, which includes ServiceLens and X-Ray for comprehensive end-to-end tracing.
Its primary advantage is the seamless first-party integration. If your application's backend already relies on AWS services, CloudWatch RUM allows you to correlate front-end performance issues directly with backend traces, logs, and metrics in a single environment. This unified view simplifies debugging complex issues that span both client and server-side operations.
While the user experience feels distinctly AWS-native and may lack the polished dashboards of specialized RUM vendors, its power lies in consolidation. It offers curated dashboards that provide essential insights into page load times, device types, and error rates, with the ability to build custom CloudWatch dashboards for more specific needs.
Key Features & Use Cases
- End-to-End Tracing: DevOps and SRE teams use it to connect a poor front-end user experience, like a slow page load, directly to a specific backend issue identified by AWS X-Ray, drastically reducing mean time to resolution (MTTR).
- Unified Monitoring for AWS Users: Ideal for engineering teams who want to consolidate their monitoring stack and billing. All RUM data is managed within the familiar AWS Management Console.
- Scalable Performance Data Collection: Businesses running high-traffic applications on AWS can leverage its pay-as-you-go model to monitor user experience without committing to a fixed-cost platform.
For teams committed to the AWS ecosystem, Amazon CloudWatch RUM is one of the most practical real user monitoring tools, offering unparalleled integration for connecting front-end performance to back-end infrastructure.
Pricing & Implementation
- Pricing: CloudWatch RUM uses a pay-as-you-go model based on the number of RUM events collected. AWS offers a generous free tier of 100 million RUM events per month for the first three months.
- Implementation: Setup involves creating a RUM "app monitor" in the CloudWatch console and embedding a generated JavaScript snippet into your application's
<head>. Familiarity with AWS IAM is required to configure necessary permissions.
| Feature | Amazon CloudWatch RUM |
|---|---|
| Primary Focus | Integrated client-side monitoring for AWS users |
| Self-Hosting | No, it is a managed AWS service |
| Core RUM Metrics | Core Web Vitals, JS errors, HTTP requests, traces |
| Session Analysis | Limited to session timelines and traces |
| Ease of Setup | Medium (requires AWS console/IAM knowledge) |
| Ideal For | Companies heavily invested in the AWS ecosystem |
Website: https://docs.aws.amazon.com/AmazonCloudWatch/latest/monitoring/CloudWatch-RUM.html
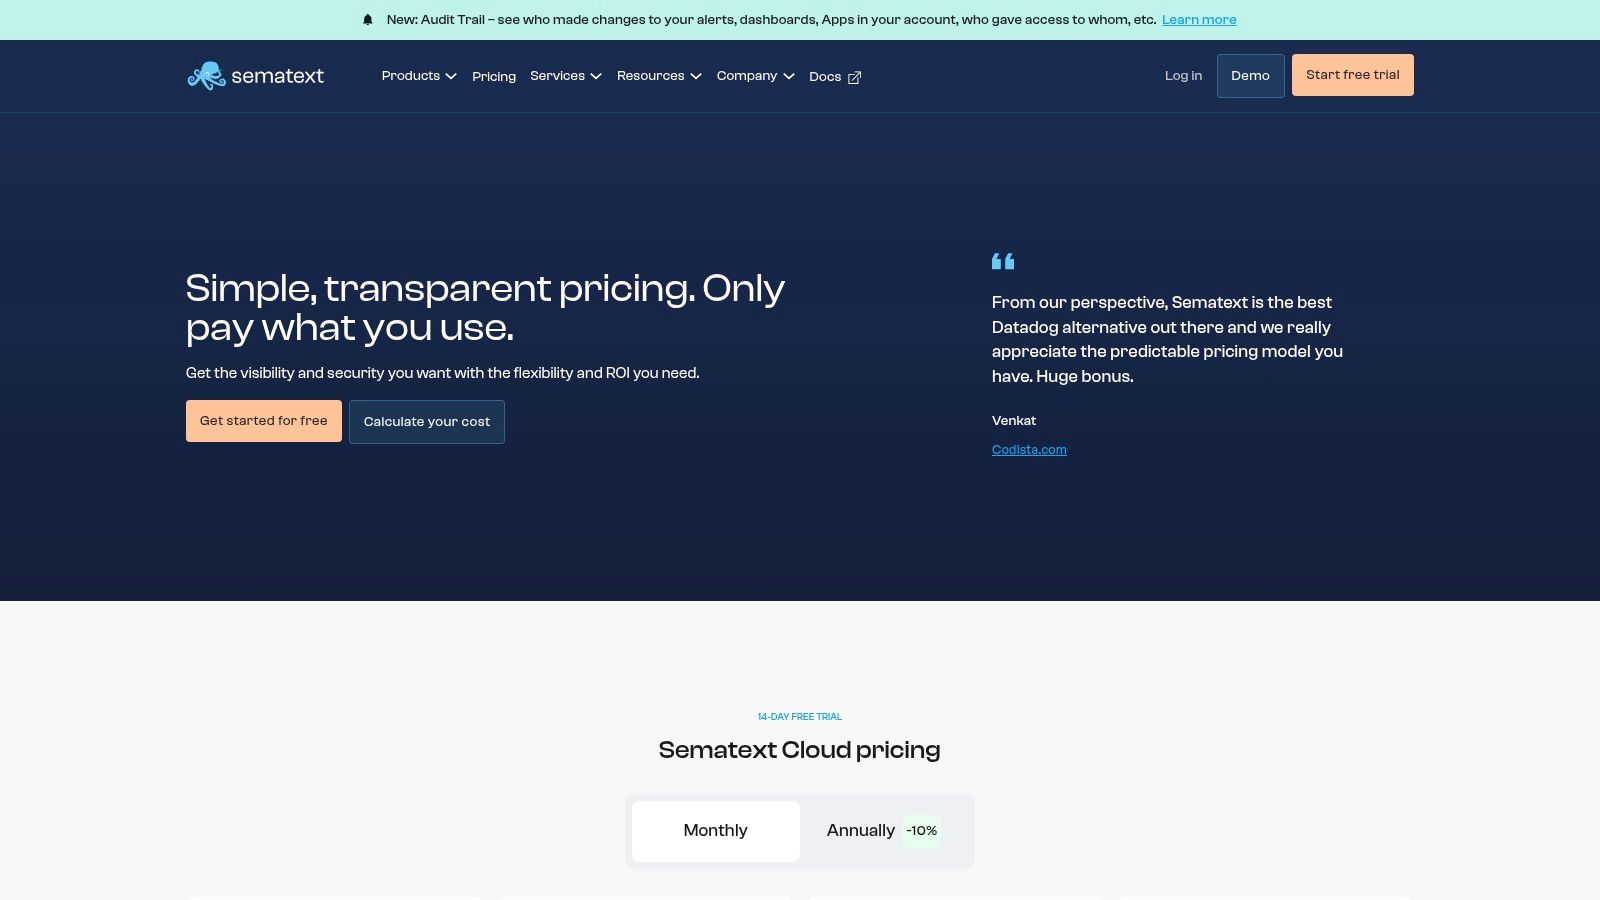
12. Sematext Experience (RUM) – Sematext Cloud
Sematext Experience is a real user monitoring solution that forms part of the broader Sematext Cloud observability platform. It is designed for budget-conscious teams who need a straightforward RUM tool integrated with other monitoring services like logs, metrics, and synthetics. The platform emphasizes transparent, self-service pricing, making it accessible for small to medium-sized businesses.
Its primary appeal is its affordability and integration within a unified observability suite. Sematext Experience captures essential RUM metrics, including Core Web Vitals, page load times, and resource loading performance, allowing teams to diagnose front-end issues effectively. The ability to combine RUM with synthetic monitoring provides a comprehensive view of website performance from both real user and simulated perspectives.
The platform offers good documentation and an intuitive setup process, catering to teams that prefer a self-service approach without extensive sales consultations. While it may not have the enterprise-level governance features of top-tier competitors, its focus on core functionality and clear pricing makes it a strong contender.
Key Features & Use Cases
- Integrated Observability: Ideal for engineering and DevOps teams that want to correlate front-end performance issues (RUM) with back-end logs, metrics, and traces all within a single platform.
- Budget-Friendly Performance Monitoring: Startups and SMBs use Sematext to monitor Core Web Vitals and user experience without committing to expensive, complex enterprise suites.
- Proactive Issue Detection: Teams combine RUM with Synthetics to monitor key user journeys and API endpoints, receiving alerts before real users are significantly impacted.
Sematext Experience excels as a practical and affordable RUM tool for teams that need more than just front-end monitoring. Its transparent, a la carte pricing model within a unified observability platform is a major plus for cost-conscious organizations.
Pricing & Implementation
- Pricing: Sematext offers transparent, pay-as-you-go pricing based on page views and data retention. A self-service calculator on their site helps estimate costs. All plans include unlimited users, and a 14-day free trial is available.
- Implementation: Setup involves adding a small JavaScript snippet to your website. The process is well-documented and designed for quick, self-service integration.
| Feature | Sematext Experience |
|---|---|
| Primary Focus | Integrated RUM within a full observability suite |
| Self-Hosting | No, it is a cloud-based SaaS platform |
| Core RUM Metrics | Core Web Vitals, page loads, resources, custom tags |
| Session Analysis | User session details, filtering by geography/tags |
| Ease of Setup | High (simple script installation) |
| Ideal For | SMBs, DevOps teams, budget-conscious organizations |
Website: https://sematext.com/pricing/
Real User Monitoring — 12-Tool Comparison
| Product | Core features ✨ | UX & Performance ★ | Privacy & Data Ownership | Price & Value 💰 | Target audience 👥 |
|---|---|---|---|---|---|
| Swetrix 🏆 | Top pages, UTM campaigns, funnels, optional Cloud replay, RUM & error tracking ✨ | ★★★★★ — actionable metrics + opt-in replay | Cookieless analytics; self-host CE; replay is Cloud-only | 💰 Traffic-based; 14‑day free trial; e.g. 100k=$19/mo | Indie makers, product/marketing teams, privacy-conscious devs |
| Datadog – RUM | Core Web Vitals, 30+ metrics, optional Session Replay; traces/logs correlation ✨ | ★★★★ — powerful dashboards & alerts | Vendor-hosted; enterprise telemetry (not privacy-first) | 💰 Per‑1k sessions; can scale costly | DevOps & teams already on Datadog |
| New Relic – Browser | RUM + distributed tracing, errors, 700+ integrations ✨ | ★★★★ — generous free tier, unified UI | Vendor-hosted; ingest-based controls | 💰 Free tier (100GB/mo); paid by ingest/users | Teams wanting consolidated observability |
| Dynatrace – RUM | End‑to‑end RUM, Session Replay, AI root‑cause (Davis) ✨ | ★★★★ — enterprise-grade visibility | Vendor-hosted with enterprise controls | 💰 Predictable per-session pricing; published rate card | Large enterprises & DEM teams |
| Splunk Observability – RUM | Full‑fidelity RUM, session waterfalls, Replay, OpenTelemetry-native ✨ | ★★★★ — strong cross‑stack correlation | Vendor-hosted; enterprise security features | 💰 Enterprise pricing (often gated) | Teams focused on backend/frontend correlation |
| Elastic Observability (APM RUM) | JS RUM agent, Core Web Vitals, unified logs/traces/metrics ✨ | ★★★ — powerful querying & visualizations | Self-managed or Elastic Cloud (control possible) | 💰 Metered ingest/retention; can be cost-effective self-hosted | Teams needing unified data & custom analysis |
| Sentry – Frontend Perf | Errors, frontend performance traces, Session Replay, dev workflows ✨ | ★★★★ — fast setup, code-level context | Vendor-hosted; strong developer focus | 💰 Free→enterprise tiers; competitive for small teams | Frontend/dev teams focused on debugging |
| SpeedCurve – RUM & Synthetic | RUM + synthetic checks, sampling, visual performance dashboards ✨ | ★★★★ — UX & performance visualizations | Vendor-hosted; performance-centric | 💰 Transparent plans; visible calculators | Performance engineers & UX teams |
| Raygun – RUM | Core Web Vitals, page insights, crash reporting & APM ✨ | ★★★ — clear UX metrics & root-cause | Vendor-hosted | 💰 Per‑session plans with quotas; SSO on higher tiers | Product/web teams, SMBs |
| SolarWinds Pingdom – RUM | RUM + synthetics, live maps, uptime & page speed ✨ | ★★★ — simple setup & digestible reports | Vendor-hosted | 💰 Simple plans; 14‑day trial | Small teams, ops, non‑technical stakeholders |
| Amazon CloudWatch RUM (AWS) | Client‑side perf, JS errors, CloudWatch/X‑Ray integration ✨ | ★★★ — AWS-native dashboards | AWS-hosted; consolidated billing & IAM controls | 💰 Pay‑as‑you‑go event pricing; free trial events | AWS-centric teams seeking first‑party integration |
| Sematext Experience – RUM | Pageview-priced RUM, Core Web Vitals, synthetics ✨ | ★★★ — budget-friendly, clear docs | Vendor-hosted | 💰 Low entry price; 14‑day trial; transparent calculator | Budget-conscious small teams |
Making the Right Choice: How to Select Your RUM Tool
Navigating the landscape of real user monitoring tools can feel overwhelming, but as we've explored, the right solution hinges entirely on your unique context. We've journeyed through a dozen powerful platforms, from comprehensive observability suites like Datadog and New Relic to specialized, privacy-first alternatives like Swetrix. The key takeaway is that there is no single "best" tool; there is only the best tool for your specific goals, budget, and technical infrastructure.
Your decision process should be a strategic one. Reflect on the core problems you need to solve. Are you chasing elusive frontend performance bottlenecks that impact Core Web Vitals? Or are you more concerned with understanding user journeys and conversion funnels without compromising visitor privacy? The answer will guide you toward the right category of RUM solutions.
A Framework for Your Decision
To distill the insights from our list, consider these critical decision points when evaluating real user monitoring tools. This framework will help you move from a long list of options to a shortlist of qualified candidates tailored to your team's needs.
Observability Platform vs. Standalone RUM: Do you need RUM as part of a larger, integrated observability strategy that includes APM, logs, and infrastructure monitoring? If so, platforms like Dynatrace, Splunk, or Elastic are built for this unified view. If your focus is purely on frontend performance and user experience, a dedicated tool like SpeedCurve, Raygun, or Swetrix might offer a more streamlined and cost-effective solution.
Privacy and Data Ownership: This is no longer a niche concern. For businesses operating under GDPR, CCPA, or for those who simply value user trust, privacy is paramount. Ask critical questions: Does the tool use cookies or fingerprinting? Where is the data stored? Can it be self-hosted? This is where a solution like Swetrix stands out, offering a cookieless, open-source, and self-hostable alternative that puts you in complete control of your data.
Team-Specific Needs: Different teams have different priorities.
- DevOps and SREs will gravitate towards tools with deep APM integration, robust alerting, and detailed error diagnostics, like those found in New Relic or Sentry.
- Product Managers and UX Researchers will value features like session replay, heatmaps, and funnel analysis to understand user behavior, making tools like Sematext Experience or Sentry’s Session Replay highly attractive.
- Startups and Indie Makers often require a tool that is easy to implement, affordable, and provides essential insights without complexity. A lightweight, developer-friendly option is often the best fit here.
Final Implementation Considerations
Once you've shortlisted a few candidates, the final step is practical evaluation. Always take advantage of free trials or developer plans. The implementation process itself can be a powerful indicator; a tool that takes minutes to set up, like Swetrix or Pingdom, shows a commitment to user experience that likely extends throughout the product.
During your trial, focus on the signal-to-noise ratio. Does the dashboard immediately highlight critical performance issues, or do you have to dig through layers of menus? Can you easily build the specific funnels or reports your team needs? The best RUM tool will not only collect data but also make it actionable, empowering you to build a faster, more reliable, and more user-friendly digital experience. Ultimately, investing in the right real user monitoring tool is an investment in your users, and that always pays dividends.
Ready to prioritize user privacy without sacrificing powerful analytics? Swetrix offers a modern, lightweight, and open-source approach to web analytics and real user monitoring. Get started for free and see how simple, privacy-focused insights can help you build better products. Try Swetrix today.