- Date
What Is Engagement Rate and How Do You Actually Improve It
 Andrii Romasiun
So, what exactly is an engagement rate? In simple terms, it’s the metric that tells you how much your audience is actually interacting with your content. We’re talking about actions like likes, comments, shares, and saves.
Think of it as the vital sign for your content's health. It’s the difference between someone passively scrolling past your post versus someone stopping to genuinely connect with what you’ve published.
Understanding Engagement Rate Beyond Just a Number

Let's use an analogy. Imagine your content is a performance on a stage. Your follower count is just the number of people in the seats. But your engagement rate? That's the applause. A few polite claps are fine, but a roaring standing ovation tells you something entirely different about the quality of your performance.
This is why engagement rate is so much more valuable than vanity metrics like follower counts, which can be easily inflated and often misleading. Having a massive audience that never interacts is like playing to an empty theater—it might look impressive on paper, but there's no real connection happening. Engagement rate tells you who’s actually leaning in, listening, and reacting to your message.
The Core Components of Audience Engagement
Engagement isn't just one single action. It’s a whole collection of different interactions that signal genuine interest from your audience. These are the building blocks of a healthy, thriving community, and they can look a little different depending on the platform you're using.
To break it down, here’s a quick summary of the common interactions that contribute to engagement rate across different platforms.
The Core Components of Audience Engagement
| Interaction Type | What It Signals | Common Platforms |
|---|---|---|
| Likes & Reactions | Quick approval and content resonance | All social platforms |
| Comments & Replies | Deeper interest and conversation starters | Instagram, Facebook, LinkedIn, TikTok |
| Shares & Retweets | High-value endorsement and audience advocacy | Facebook, X, LinkedIn |
| Saves & Bookmarks | Content is seen as valuable and evergreen | Instagram, Pinterest, TikTok |
| Clicks | Curiosity and a desire to learn more | LinkedIn, Facebook, Websites |
Once you start looking at these individual components, you move beyond just tracking a single, generic number. You begin to understand the why behind how your audience behaves. That kind of insight is far more powerful than simply knowing how many people saw your post.
For a closer look at how long users interact with your website content, it’s worth exploring the concept of **average engagement time** and what it can tell you about your strategy.
The Key Formulas for Calculating Engagement Rate
So, how do you actually measure engagement? While the idea is simple, the math can get a little tricky. There isn't just one magic formula. Instead, you have a few different options, and the right one depends entirely on what you’re trying to understand about your audience and content.
Are you trying to see how compelling a specific post was? Or are you trying to gauge the loyalty of your entire follower base over time? Let's walk through the three most common formulas and figure out which one is right for you.
Engagement Rate by Reach (ERR)
This is my personal favorite and, in many ways, the most honest metric of the bunch. Engagement Rate by Reach (ERR) measures engagement against the number of unique people who actually saw your post.
Think about it: not every single one of your followers will see everything you post. Algorithms get in the way. People aren't online 24/7. By using reach, you're measuring how engaging your content was to the people who genuinely had a chance to see it. It filters out the noise of algorithmic suppression and gives you a pure signal of content quality.
The Formula: Engagement Rate by Reach (ERR)
(Total Engagements / Total Reach) x 100
Let’s say you share a post that gets 500 engagements (likes, comments, shares) and it was seen by 5,000 unique people. The math would be: (500 / 5,000) x 100 = 10% ERR.
Engagement Rate by Impressions (ERI)
This formula is a close cousin to ERR, but instead of unique people (reach), it uses impressions. Impressions are the total number of times your content was displayed on a screen, even if the same person saw it multiple times.
Engagement Rate by Impressions (ERI) is especially useful when you're running paid ad campaigns where you're often paying per impression (CPM). A high ERI tells you that your ad creative is effective and holds up even after someone has seen it a few times. The only catch? For organic content, a few super-fans could see your post over and over, racking up impressions and slightly skewing your numbers.
The Formula: Engagement Rate by Impressions (ERI)
(Total Engagements / Total Impressions) x 100
If that same post with 500 engagements generated 8,000 impressions, the calculation changes: (500 / 8,000) x 100 = 6.25% ERI.
Engagement Rate by Followers (ERF)
This is the old-school, traditional way of looking at things. Engagement Rate by Followers (ERF) calculates engagement as a simple percentage of your total follower count.
While it has its flaws, ERF is still a solid way to track the overall health of your account over the long term. If you see your ERF steadily declining month after month, it might be a sign that your content strategy is drifting away from what your core audience wants. Its biggest weakness, however, is that it completely ignores how many people actually saw the post, meaning a fantastic piece of content on a low-reach day can look like a dud.
The Formula: Engagement Rate by Followers (ERF)
(Total Engagements / Total Followers) x 100
Let's take our post with 500 engagements again. If the account has 20,000 followers, the formula looks like this: (500 / 20,000) x 100 = 2.5% ERF.
Remember, context is everything. The platform you're on will drastically change what a "good" engagement rate looks like. Data for 2025 shows LinkedIn as a B2B juggernaut, with image posts hitting a massive 14.4% average engagement rate. That absolutely dwarfs the 6.2% average on Instagram. You can explore more of these fascinating insights in the platform-specific engagement benchmarks at ZoomSphere.
What a Good Engagement Rate Actually Looks Like
So, what's a “good” engagement rate? That's the million-dollar question, and the honest answer is: it depends. There’s no magic number that works for everyone. A rate that’s cause for celebration on one platform could be a sign you’re missing the mark on another.
Think of it like this: you wouldn't judge a world-class sprinter by their marathon time. The context—the platform, your industry, and even the type of content you post—is everything. Aiming for a single, arbitrary benchmark across all your channels is a recipe for frustration. A 2% engagement rate might be perfectly fine for a Facebook page with a massive, broad audience. But that same 2% on LinkedIn, where interactions are deeper and more professional, would be a major red flag.
Setting Realistic Benchmarks by Platform
The first step to setting meaningful goals is understanding these platform-specific quirks. Your strategy becomes so much more effective when you're measuring performance against a realistic yardstick for each channel. Stop comparing your TikTok numbers to your Facebook analytics. Instead, see how you stack up against others in your industry on TikTok.
To give you a starting point, here’s a quick look at what typical engagement rates look like on some of the major social media platforms.
Average Engagement Rate Benchmarks by Platform
This table offers a comparison of typical engagement rates across popular platforms to help you benchmark your own performance. Remember, these are averages—your industry can and will cause these numbers to fluctuate.
| Platform | Average Engagement Rate (by Reach) | Notes on High-Performing Content |
|---|---|---|
| ~2.8% - 6.5% | Career advice, company news, and deep-dive industry insights drive the strongest professional interactions here. | |
| TikTok | ~4.8% | Authentic, short-form videos that jump on trends and use popular audio are the bread and butter of this platform. |
| ~2.0% - 3.0% | It’s all about the visuals. High-quality photos, polished Reels, and interactive Stories are essential for success. | |
| ~1.3% - 1.6% | Content that builds community, sparks conversation, and leverages video tends to resonate most with its diverse user base. |
Keep in mind that your specific industry makes a big difference. For example, government and real estate often pull in higher-than-average engagement on Facebook, while tech and consumer goods sometimes see lower numbers. These benchmarks are your starting point, not the finish line.
The infographic below breaks down the different ways you can actually calculate engagement, depending on whether you want to focus on reach, impressions, or your follower count.
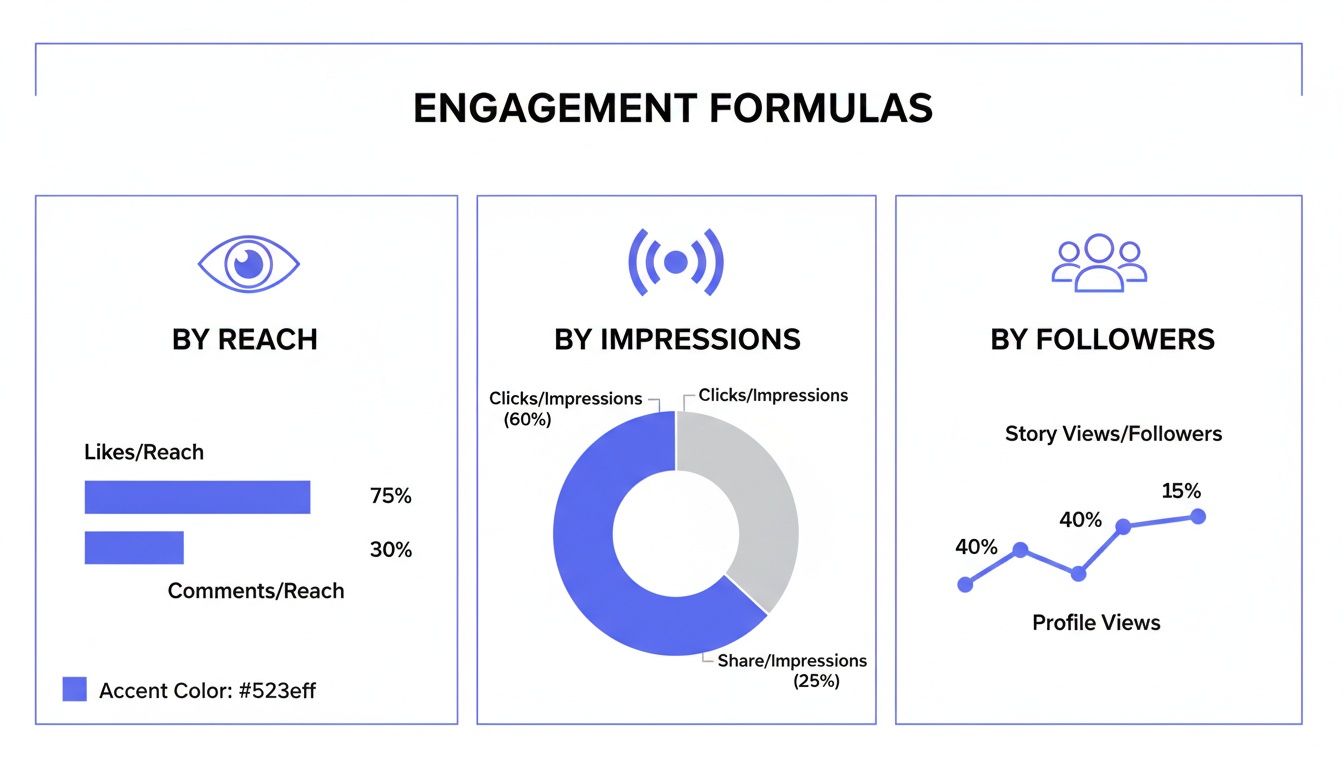
Each formula tells a slightly different part of the story, giving you a more complete picture of how your content is really performing.
A Closer Look at Facebook Engagement
With its enormous user base, Facebook is still a powerhouse for many businesses. While its average engagement rates might look small next to some of the newer platforms, its sheer scale offers a reach that's hard to beat.
Despite a general downward trend in engagement across the social media world, Facebook’s average rate is holding surprisingly steady between 1.3% and 1.65%. That stability is pretty remarkable when you see the sharper drops on other networks.
Even with a median rate hovering around 1.20%, the platform is far from dead. With 3.07 billion users, it’s a critical channel for a huge 83% of B2B marketers who rely on its broad, diverse audience. You can discover more insights about social media reach on Socialinsider.io to see how different platforms stack up. It’s a great reminder that even a "low" engagement rate can drive serious business value when it’s backed by massive scale.
How to Measure Engagement Without Lying to Yourself
Knowing the formulas for engagement rate is one thing, but the numbers can easily mislead you if you’re not careful. To really get a handle on engagement, you have to look past the surface-level data and steer clear of the common traps that send so many people down the wrong path.
The biggest mistake I see? Chasing vanity metrics. Sure, a post with thousands of likes feels like a win. But what if those likes came from a one-off giveaway that pulled in an audience with zero interest in your actual brand? These numbers look great on a report but are often hollow.
It’s also crucial to remember that not all engagement is good engagement. A sudden spike in comments could be a sign of a thriving community, or it could be a PR nightmare unfolding in real-time. Ignoring the context behind the numbers is like hearing a loud noise and not knowing whether it’s applause or a fire alarm.
Look Deeper Than Just the Total
To get an accurate read, you need to slice up your data and analyze the quality of the interactions, not just the quantity. Breaking engagement down by type is one of the best ways to do this.
Let's look at a quick example:
- Post A gets 500 likes and 10 comments.
- Post B gets 150 likes, 20 comments, and 50 saves.
On paper, Post A seems to be the clear winner with all those likes. But Post B is telling a much more interesting story. Its higher comment and save counts point to a far deeper level of connection. Saves, especially, are a sign that people found your content so valuable they want to come back to it later—a powerful signal that a simple like just can't compete with.
The goal isn't just to make people stop scrolling; it's to make them stop and think. A save or a thoughtful comment often says more about your content's performance than a hundred fleeting likes.
Context Is Everything
Another huge pitfall is looking at engagement in a vacuum, completely disconnected from your other analytics. For instance, a social media post might get a ton of clicks through to your website. Great, right? But what if your web analytics show that every single one of those visitors bounced after two seconds? The initial engagement was a mirage; the content ultimately failed to hold their attention.
Connecting the dots between what happens on social media and what happens on your site is non-negotiable. For a closer look at this, our guide on session duration is a great resource for learning how to interpret what users do after they click. It’s all about building a complete picture of your audience's journey, so you can be sure you’re celebrating clicks that actually lead somewhere meaningful.
How to Actually Improve Your Engagement
Knowing your numbers is one thing, but turning that data into real, tangible audience interaction is where the real work begins. It’s not just about posting more often; it’s about intentionally creating content that pulls people in, sparks conversations, and makes them want to participate.
The goal is to shift from broadcasting at your audience to starting a dialogue with them. Every blog post, social media update, or email should have a clear purpose—whether it's to teach something new, make someone laugh, or inspire a specific action. With a few smart tactics, you can get the ball rolling and see your engagement metrics climb.
Craft Calls to Action That Actually Work
Sometimes, the most straightforward way to get more interaction is simply to ask for it. A clear, compelling call-to-action (CTA) removes the guesswork and tells your audience exactly what you want them to do next.
Don't just end a post with a statement. Flip it into a question. This tiny change can transform a passive reading experience into an active, participatory one.
- Before: "Here are the top trends for next year."
- After: "Which of these trends are you most excited to try? Let us know in the comments!"
This direct invitation shows you genuinely care about their opinion and are ready to listen—a powerful motivator for someone to chime in.
The secret is making your audience feel like a valued part of the conversation, not just a bystander. When people feel heard, they’re far more likely to contribute.
Use Interactive Content to Stop the Scroll
Static posts are fine, but interactive formats are built to demand participation. They’re a fantastic way to break the passive scrolling habit and give people a fun, low-effort way to connect with your brand.
Think beyond the standard text-and-image post and experiment with formats that invite a click, a vote, or a share.
- Polls and Quizzes: These are perfect for quickly gauging opinions on anything from new product features to hot takes on industry news. Social platforms like Instagram Stories and LinkedIn have fantastic built-in polling features that make this a breeze.
- "Ask Me Anything" (AMA) Sessions: Hosting a live AMA on video or even just a post-based Q&A can build incredible trust and transparency. People love getting a behind-the-scenes look.
- User-Generated Content (UGC) Campaigns: Ask your audience to share photos or stories using a specific hashtag. When you feature their content, you build a powerful sense of community and make them feel like part of the brand.
These formats don't just ask for engagement; they make it part of the fun. You can even track these deeper interactions with the right analytics setup. For instance, learning how to set up custom JavaScript events allows you to monitor specific actions like poll submissions or quiz completions, giving you a much sharper picture of what your users truly find interesting.
Common Questions We Hear About Engagement Rate
After diving into all the formulas and strategies, a few questions always seem to come up. Let's tackle them head-on. Think of this as your quick-reference guide to clear up any lingering confusion so you can get back to measuring what matters.
Is a High Engagement Rate Always a Good Thing?
Not always. While it’s usually a great sign, you have to look at the context of the interactions. A sudden spike in engagement might not be what you think.
For instance, a controversial post could be blowing up with negative comments, or a big giveaway could be attracting a ton of people who just want free stuff and have zero interest in your brand. It's crucial to look past the raw numbers. A post with a slightly lower rate but packed with thoughtful comments and saves is often way more valuable than one with thousands of empty likes. Always ask yourself about the quality of the engagement, not just the quantity.
Can Engagement Rate Go Higher Than 100 Percent?
This is a common question, and the simple answer is no, the final percentage can't break 100%. The formulas are set up to show engagement as a piece of a larger pie—whether that pie is your reach, impressions, or follower count.
Hitting a 100% rate would mean every single person who saw your post (or every one of your followers) took an action. That's just not realistic. While one person can absolutely engage multiple times—say, with a like, a comment, and a share—those actions are still measured against the much larger number of total people reached, keeping the final rate below that 100% ceiling.
Why Is My Engagement Rate So Low?
Seeing a low engagement rate can be a real downer, but it’s almost always a fixable problem. It usually points back to one of a few common culprits. Digging into these is your first step to turning things around.
- Content Mismatch: Is your content truly connecting? If it isn't solving a problem, providing real value, or at least entertaining your audience, they'll just scroll on by.
- Bad Timing: You might be posting when your audience is asleep or at work. You need to experiment with different days and times to find when they're actually online and ready to interact.
- Audience Quality: A follower count full of bots, inactive accounts, or people who aren't your ideal customer won't do you any good. It’s far better to have a smaller, more dedicated following than a massive, disengaged one.
- It’s a One-Way Conversation: Social media is meant to be social. If you’re not replying to comments, asking questions, and sparking discussions, you’re not giving people much reason to engage back.
Remember, a low rate isn't a failure—it's feedback. It’s a diagnostic tool telling you exactly where your strategy needs a tune-up.
Which Engagement Rate Formula Is the Best One to Use?
There's no single "best" formula. The right one really depends on what you’re trying to achieve, because each one tells a slightly different story about your content's performance.
- Engagement Rate by Reach (ERR): This is often seen as the purest measure of your content’s quality. It shows how well your post resonated with the unique people who actually saw it.
- Engagement Rate by Impressions (ERI): This one is especially helpful for paid campaigns. It lets you track how engaging your ad was each time it was displayed.
- Engagement Rate by Followers (ERF): This is a fantastic metric for measuring the long-term health of your community and the loyalty of your core audience over time.
For a truly complete picture, it’s a good idea to keep an eye on all three. Use ERR to judge the success of individual posts, and use ERF to track your account's overall health month-to-month.
Ready to move beyond surface-level metrics and understand what truly engages your users? Swetrix provides clear, privacy-first analytics to help you track custom events, analyze user journeys, and build funnels that reveal what’s working. Start your 14-day free trial and get the actionable insights you need to grow. Learn more about Swetrix.