- Date
What Are Core Web Vitals Your Ultimate Guide
 Andrii Romasiun
Think of Core Web Vitals as Google's way of measuring how a user feels when they visit your website. It’s a set of real-world performance metrics that boil down to three simple questions: How fast does it load? How quickly can I interact with it? Is the experience smooth and stable?
Essentially, Google is trying to quantify the user's experience to reward sites that feel fast and delightful, rather than slow and frustrating.
What Are Core Web Vitals? A Simple Analogy
Let's imagine your website is a new restaurant. You want every customer to have a great time from the second they walk through the door. Core Web Vitals act like a secret shopper, grading you on three key parts of that experience.
First, how quickly are your guests greeted and shown to their table? This is all about loading performance. If people are stuck waiting at the entrance for ages, they're probably going to walk out. That's exactly how users feel on a slow-loading site.
Next, how attentive is your staff? When a customer wants to order, how long does it take for a server to come over? This is a perfect parallel to your site's interactivity. A long delay after clicking a button is just as annoying as being ignored by a waiter who won't take your order.
Finally, is the experience predictable? Imagine the table lurching to the side just as a customer is about to take a bite. That jarring, chaotic feeling is what we call poor visual stability. On a website, this happens when an ad suddenly loads, pushing the text you were reading down the page. It's disorienting and frankly, a terrible experience.
The Three Pillars of User Experience
These three concepts—loading, interactivity, and visual stability—are the bedrock of a good user experience online. Back in 2020, Google decided to formalize this by introducing the Core Web Vitals initiative to measure these exact feelings. The core metrics are Largest Contentful Paint (LCP) for loading, Interaction to Next Paint (INP) for interactivity, and Cumulative Layout Shift (CLS) for visual stability. You can dive deeper into the technicals over at Google's own web.dev.
In short, Core Web Vitals translate abstract user feelings like "this page is slow" or "this button is broken" into concrete, measurable data that you can actually improve.
When you focus on these numbers, you're not just trying to please an algorithm. You're tackling the most common sources of user frustration head-on. A site with good scores simply feels better—it's fast, responsive, and reliable. This leads to happier visitors who stick around longer and are far more likely to become customers.
Core Web Vitals At a Glance
To make it even clearer, here’s a quick breakdown of the three metrics and the scores you should be aiming for.
| Metric | What It Measures | Good Score |
|---|---|---|
| LCP | Loading Performance: How quickly the main content of a page becomes visible to the user. | Under 2.5 seconds |
| INP | Interactivity: How quickly the page responds to user actions like clicks, taps, or key presses. | Under 200 milliseconds |
| CLS | Visual Stability: How much the page layout unexpectedly shifts while loading. | Under 0.1 |
Getting these three scores into the 'Good' range is a clear sign that you’re providing a solid user experience.
Breaking Down The Three Core Metrics
To really get what Core Web Vitals are all about, we need to stop thinking like machines and start thinking like people. These aren't just abstract numbers in a report; they’re a direct line to your user's experience—capturing everything from delight to pure frustration. Each metric tells a story.
This diagram shows how the three vitals—LCP for loading, INP for interactivity, and CLS for stability—work together to define a user's journey on your site.
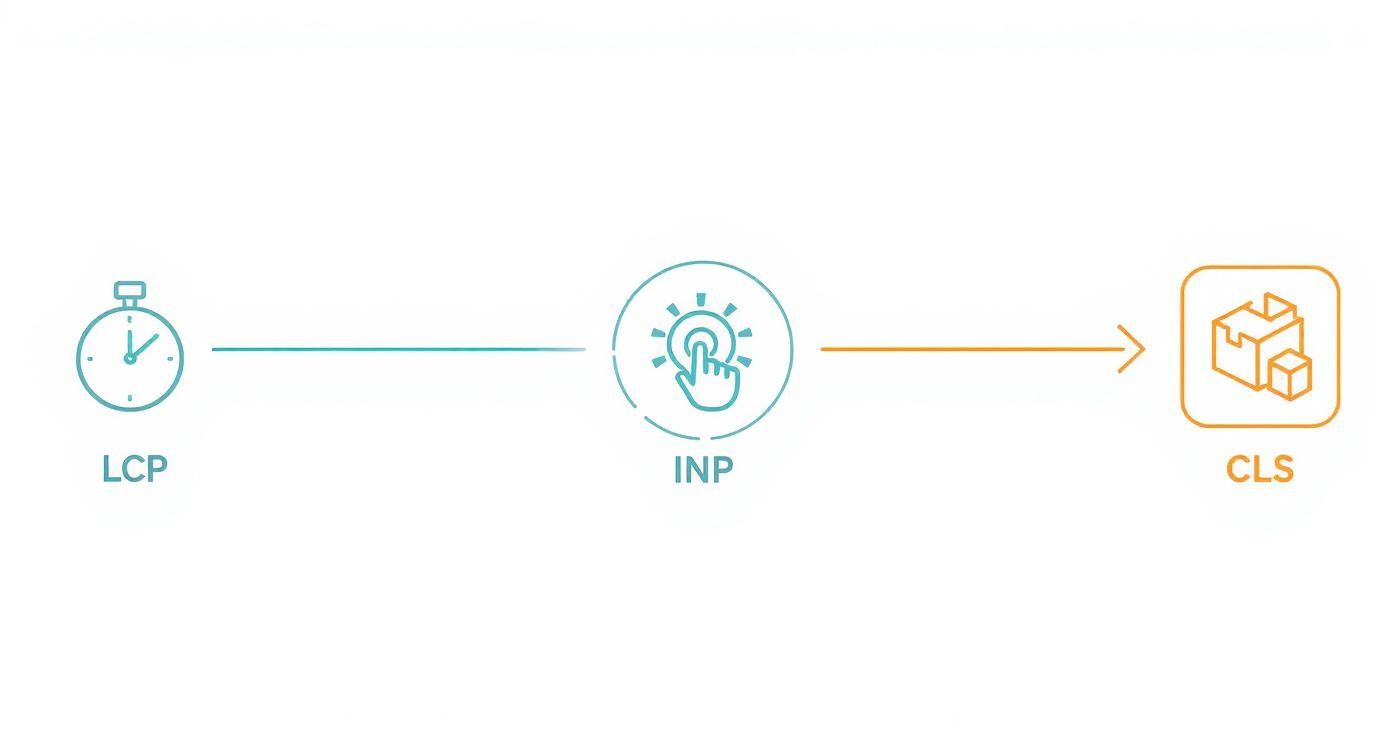
As you can see, each one marks a critical phase, from the moment a user lands on your page to when they start clicking around.
LCP: The First Impression
Largest Contentful Paint (LCP) is all about that initial "wow" moment. It measures how long it takes for the most important part of your page to show up.
Think of it as the moment the headliner walks on stage at a concert. The lights, the sound—that's when you know the show has really started. On a webpage, that "headliner" is usually the largest thing a user sees right away, like:
- A big hero image or banner
- The poster frame of a video
- A prominent block of text or a headline
LCP isn't concerned with the entire page loading. It just cares about how quickly you deliver the main event. A slow LCP means users are stuck staring at a blank or half-finished screen, wondering if something’s broken. That first perception of speed is absolutely crucial for keeping them around.
To give people a good experience, Google says your LCP should happen within 2.5 seconds of the page starting to load. You're aiming to hit this target for at least 75% of your visitors.
INP: The Responsiveness Test
Interaction to Next Paint (INP) answers a simple but vital question: "When I click something, does the site feel like it's listening?" It measures the full time it takes from a user’s action—a click, a tap, a key press—to the moment they see a visual response on the screen.
We've all been there. You tap the "Add to Cart" button, and… nothing. So you tap it again, getting a little more annoyed each time. That agonizing lag between your action and the site’s reaction is exactly what INP is designed to catch.
This is a huge step up from its predecessor, First Input Delay (FID), which only looked at the delay on the very first interaction. INP is much smarter; it tracks all interactions during a visit and reports on the slowest one, giving you a real-world picture of potential user frustration. A great INP score makes your site feel snappy and alive.
CLS: The Stability Check
Cumulative Layout Shift (CLS) is the metric that penalizes wobbly, unpredictable pages. It’s all about visual stability. You know the feeling—you're about to tap a button, and at the last second, a giant ad loads out of nowhere, pushing everything down and making you click the wrong thing.
It's one of the most rage-inducing things on the web.
CLS works by adding up the scores of every one of these unexpected layout shifts. The score is calculated based on two things: how much of the screen was affected and how far the unstable elements moved.
The usual suspects behind a high CLS score are:
- Images or videos without their dimensions set in the code
- Ads, banners, or embeds that pop in without any space reserved for them
- Web fonts that load late and cause a sudden "flash" of re-styled text
A low CLS score means your layout is solid and predictable. Users can browse and click with confidence, knowing things will stay right where they're supposed to be. To pass, Google says you need a CLS score of 0.1 or less.
At the end of the day, getting a handle on these three metrics is your first real step toward building a better website. Each one gives you a clear, measurable goal that lines up perfectly with a smooth, professional user experience.
Why Optimizing Core Web Vitals Matters
https://www.youtube.com/embed/pTswmgVWSH8
It's easy to see Core Web Vitals as just another set of technical metrics to track. But understanding their real-world impact is what transforms them from a developer's checklist into a core business strategy. This isn't just about making Google happy; it’s about making your users happy. And a great user experience is one of the sharpest competitive edges you can have.
When you start digging into these vitals, you're tackling the very things that make people close a tab in frustration. Sluggish load times, buttons that don't respond, and content that jumps around the page aren't minor annoyances—they're revenue killers. Each metric is a window into a real person's experience on your site, and a poor score is a red flag marking a point of friction.
From User Frustration to Financial Impact
Let's paint a picture. A potential customer lands on your site. The main product image snaps into view in a second, the "Add to Cart" button works the instant they click it, and the checkout form stays put. The whole interaction feels fluid and professional. It builds confidence and guides them smoothly toward a purchase.
Now, imagine that same customer on a competitor's site. They stare at a blank screen for five seconds. When they finally click a button, there's a frustrating delay. Then, just as they're about to enter their payment details, an ad shoves the entire form down the page. That clumsy, unpredictable experience destroys trust and patience. More often than not, they’ll just leave and find a better option.
This isn't just a story; the data backs it up. The business case for a friction-free user experience is crystal clear. Studies show that sites with good Core Web Vitals scores see up to a 24% drop in users leaving while the page loads. The positive impact doesn't stop there:
- Conversion rates can jump by as much as 20%.
- Form submission rates often climb by 35%.
- Bounce rates can plummet from a painful 68% down to 41%.
You can dive deeper into these findings on Core Web Vitals and business growth to see the full picture.
Translating Metrics into Brand Perception
Beyond the immediate sale, Core Web Vitals quietly shape how people feel about your brand long-term. Every single interaction a user has with your website adds to their overall impression of your company. A fast, reliable site communicates professionalism and shows you value their time.
A positive user experience builds trust. When a site works flawlessly, users are more likely to view the company behind it as credible and dependable, making them more comfortable sharing their information and making a purchase.
On the flip side, a poor digital experience can make your brand seem amateur or out of touch. It suggests a lack of care that can make customers second-guess the quality of your actual products or services. In today's market, the experience is often the one thing that separates you from the competition and keeps customers loyal.
Tools like Google's PageSpeed Insights give you a straightforward report card on how you're doing.
This dashboard tells you at a glance whether you're passing or failing the test for real users out in the wild.
Ultimately, optimizing your Core Web Vitals is an investment in your customer relationships. By delivering a faster, more stable, and more responsive experience, you aren't just chasing SEO points—you're building a stronger brand, earning customer loyalty, and driving real, sustainable growth. The numbers prove it: happy users create better business outcomes.
How To Measure Your Performance Accurately
So, you understand what Core Web Vitals are. That's the first step. But to actually improve them, you have to measure them first. This isn't about guesswork; it's about getting the right data to see what your users are really experiencing.
There are two main ways to collect this performance data, and understanding the difference between them is absolutely critical for making smart optimizations.
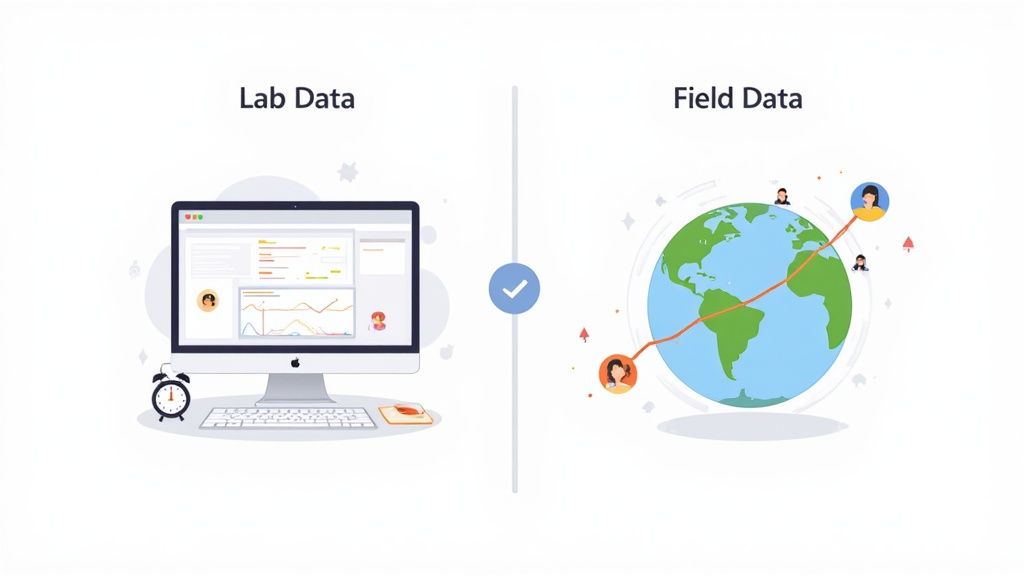
Think of it like testing a new car. You could take it to a pristine, controlled racetrack for a performance test. Or, you could drive it through actual city traffic, complete with potholes, stop-and-go congestion, and unpredictable drivers. Both tests give you useful information, but they tell completely different stories about the car's performance.
Lab Data: The Controlled Test Drive
Lab data is your controlled racetrack. It's generated by tools that simulate a user's visit under a specific, consistent set of conditions. This kind of testing is perfect for debugging and catching performance regressions before you ship code to production.
When you run a performance test on your site with one of these tools, it measures your Core Web Vitals using a predefined device and network speed. That consistency is its biggest advantage. It lets you test changes and see a direct cause-and-effect relationship. "I changed this line of code, and LCP improved by X."
The only catch? It's not real life. A lab test can't possibly account for the sheer variety of your actual audience—people on older phones, spotty Wi-Fi connections, or who just interact with your site in ways you never anticipated.
Field Data: What Real Users Experience
This is where Field Data, also known as Real User Monitoring (RUM), comes into play. RUM tools collect performance data directly from the browsers of your actual visitors as they navigate your site. This is your "city traffic" test—it’s messy, unpredictable, and incredibly insightful.
This is the data that matters most because it's the data Google uses for its search rankings. It reflects the true, unvarnished user experience and captures performance across a massive spectrum of variables:
- Diverse Devices: From the latest high-end smartphones to older, budget models.
- Network Conditions: Everything from blazing-fast fiber to patchy 3G mobile data.
- Geographic Locations: Highlighting how performance can change for users halfway around the world.
The single most important thing to remember is this: Google uses Field Data (RUM) from its Chrome User Experience Report (CrUX) to decide if your site passes the Core Web Vitals assessment. Your lab scores are for diagnostics, but your field scores are what count for SEO.
Choosing The Right Tools For The Job
To get the full picture, you really need both types of data. Luckily, there are some fantastic tools out there to help you measure and diagnose your Core Web Vitals.
Google's Core Toolset
Google provides a suite of free tools that are essential for anyone serious about web performance.
- PageSpeed Insights (PSI): Think of this as your go-to spot for a quick check-up. It gives you both lab data for an instant diagnostic and field data from CrUX (assuming your site gets enough traffic). It even provides specific, actionable recommendations for improvement.
- Google Search Console: The Core Web Vitals report inside Search Console offers a high-level overview of your site's field data. It handily groups your URLs by performance status—'Good', 'Needs Improvement', or 'Poor'—which helps you spot sitewide patterns instead of just focusing on one page.
The Power of Dedicated RUM
While Google's tools are a great start, they have their limits. The data from CrUX, for example, is aggregated over the previous 28 days, meaning you have to wait a long time to see if your fixes actually worked.
This is where dedicated, privacy-first RUM tools become a game-changer. These platforms give you real-time performance data without using cookies or invasive trackers, keeping you compliant with regulations like GDPR. They offer deeper, more granular insights, allowing you to slice and dice your data by country, device, browser, and much more. If you want to see this in action, you can explore the benefits of comprehensive website performance monitoring to understand how real-time data transforms your optimization strategy.
By combining lab tests during development with a dedicated RUM tool for continuous monitoring, you create a powerful feedback loop. You can spot issues, deploy fixes, and see the real-world impact on your users almost instantly—giving you a massive advantage in delivering a consistently great experience.
How to Fix Poor Core Web Vitals Scores
Alright, so you understand what the Core Web Vitals are. That's the first step. But the real magic happens when you know how to fix them. Seeing your scores in the 'Poor' or 'Needs Improvement' range isn't a failure—it's a roadmap telling you exactly where your user experience is hitting a snag.
Let's walk through the most common culprits behind bad scores and, more importantly, the practical, real-world fixes you can apply.
Think of yourself as a performance detective. A slow LCP, a laggy INP, or a jumpy CLS are your clues. Your job is to trace them back to the source. The good news? The same few suspects tend to show up again and again.
Taming a Slow Largest Contentful Paint (LCP)
A bad LCP score almost always means something is making your page's main content show up late to the party. Users are left staring at a blank or half-rendered screen, and that's a surefire way to increase your bounce rate.
The usual suspects include:
- Slow Server Response Times: If your server is slow to answer the initial request, everything else gets delayed. This is a classic bottleneck, especially on cheap, shared hosting.
- Massive, Unoptimized Images: The LCP element is very often a big hero image. If that file is huge and uncompressed, it's going to take a long time to download and appear.
- Render-Blocking Resources: This is a sneaky one. It happens when the browser has to stop everything to download and parse big CSS or JavaScript files before it can show the main content. The page rendering is literally "blocked."
To fix a slow LCP, you need to think about speed from the very first moment a user requests your page. Upgrading your hosting or using a Content Delivery Network (CDN) to serve files from servers closer to your users can make a massive difference.
Once you've sorted out the server, focus on your content. We cover a lot of ground in our guide to effective website performance optimization tips, but a great place to start is image optimization. Compress your images, serve them in modern formats like WebP, and consider preloading the most critical ones so the browser fetches them first.
Speeding Up a High Interaction to Next Paint (INP)
A high INP is a direct measure of frustration. It means a user clicks, taps, or types, and the page just... hangs. This sluggishness is almost always caused by the browser's main thread being too busy to handle the user's input.
The main culprits are:
- Heavy JavaScript Execution: Long-running scripts can hog the main thread, making it impossible for the browser to respond to anything else.
- Complex Event Callbacks: A simple click might trigger a huge amount of code that takes too long to process, creating that noticeable delay.
- Large DOM Size: If your page has thousands of HTML elements, the browser has to work harder to process updates, which slows down responsiveness.
Fixing INP is all about lightening the browser's workload. A fantastic first step is code splitting, which breaks your big JavaScript files into smaller chunks that only load when they're actually needed. You should also hunt down long-running tasks and break them into smaller pieces. This gives the browser a chance to handle user input in between.
Stabilizing a High Cumulative Layout Shift (CLS)
There is almost nothing more annoying on the web than trying to click something, only to have the page shift at the last second. A high CLS score means your layout is unstable, and it's a guaranteed way to irritate users.
This problem is usually caused by elements popping into the page without having any space saved for them.
- Images Without Dimensions: If you don't specify the
widthandheightfor an image, the browser has no idea how much space to reserve. When the image finally loads, it shoves all the other content out of the way. - Dynamically Injected Content: Think ads, cookie banners, or other widgets that appear without a dedicated container. They cause sudden, jarring layout shifts.
- Web Font Loading: Sometimes, a default system font shows up first. When your custom web font finally loads, it might be a different size, causing a "flash" of text that reflows the entire page.
Fixing CLS is often the most straightforward of the three. Always include width and height attributes on your <img> and <video> tags. For ads or other embeds, use CSS to reserve a fixed-size container for them. This way, the space is already allocated before the content loads in.
To make this even clearer, here's a quick reference table to help you connect a specific problem to the vital it's hurting.
Troubleshooting Common Core Web Vitals Issues
| Problem Area | Affected Vital | Primary Solution |
|---|---|---|
| Slow server or bad hosting | LCP | Upgrade hosting plan or switch providers; use a CDN. |
| Large, uncompressed images | LCP | Compress images; use modern formats like WebP; lazy-load. |
| Heavy JavaScript files | INP, LCP | Minify JS; use code splitting; defer non-critical scripts. |
Images without width/height | CLS | Add width and height attributes to all <img> tags. |
| Dynamically added content (ads) | CLS | Reserve space for the content with CSS (min-height). |
| Long-running script tasks | INP | Break tasks into smaller chunks using setTimeout or requestIdleCallback. |
| Render-blocking CSS/JS | LCP | Inline critical CSS; defer or load non-essential scripts asynchronously. |
This table isn't exhaustive, of course, but it covers the 80/20 of Core Web Vitals issues. If you can tackle these common problems, you'll be well on your way to a much faster, more stable, and more responsive website.
Building A Long-Term Monitoring Strategy
Nailing your Core Web Vitals scores isn't a one-and-done project. Think of it as an ongoing commitment to a great user experience. Your website is a living, breathing thing—code changes, new content, and shifting user habits are constantly nudging your performance metrics. The real goal is to get out of firefighting mode and into a rhythm of proactive performance management.
This means baking performance checks right into your development cycle. Before any new feature sees the light of day, it should be put through its paces against your performance benchmarks. When you adopt this mindset, performance stops being an afterthought and becomes a non-negotiable part of your process. It's how you catch problems before they ever get in front of your users.
Proactive Alerts And A Global View
The secret to being proactive? Setting up automated alerts with a Real User Monitoring (RUM) tool. These systems are your digital smoke detectors, notifying you the moment a key metric like LCP or INP starts to slip. This lets you jump on the problem before it snowballs and affects a huge chunk of your audience. If you're looking for the right tool, our guide to website performance monitoring tools is a great place to start.
It's also crucial to remember that your users aren't all in one place using the same device. Performance can vary wildly depending on where someone is in the world. The data doesn't lie: only about 22% of websites worldwide manage to hit Google's 'good' threshold for all three Core Web Vitals on mobile.
The regional differences are stark. For example, 22.7% of top sites in the US pass the test, but that number plummets to just 9.1% in a country like Nigeria, where internet infrastructure isn't as robust. You can dig into more of these numbers in this in-depth analysis of Core Web Vitals stats.
A long-term strategy isn’t just about maintaining scores. It’s about creating a culture of performance where every team member understands their role in delivering a fast, stable, and responsive experience for every user, everywhere.
This consistent effort is what keeps your site competitive. It's how you build the kind of excellent, reliable experience that earns user trust and keeps them coming back.
Got Questions About Core Web Vitals? We've Got Answers.
Let's tackle some of the common questions that come up when people start digging into Core Web Vitals. These are the things I get asked all the time, and getting them straight will help you move forward with confidence.
Are Core Web Vitals a Huge SEO Ranking Factor?
Yes, they are a confirmed part of Google's page experience signals, which absolutely influence search rankings. I like to think of them as a tiebreaker. If two pages have equally fantastic content, the one that delivers a better, smoother user experience is likely to get the nod from Google.
But let's keep things in perspective. Great, relevant content is still king. A blazing-fast site with weak, unhelpful content is never going to outrank a slightly slower site that has expert information perfectly matching what the user is searching for.
What's the Real Difference Between INP and FID?
This is a great question, especially since the big switch in March 2024. Interaction to Next Paint (INP) officially replaced First Input Delay (FID), and for good reason. While both are designed to measure responsiveness, INP gives you a much more holistic view of how your page feels to a user.
Here’s the breakdown:
- FID (First Input Delay): Only cared about the delay of the very first thing a user did. A single click, a single tap. That's it.
- INP (Interaction to Next Paint): Looks at all the interactions a user has during their visit—every click, tap, and keypress. It then reports the single slowest one, which is a far better indicator of overall sluggishness.
Simply put, INP tells a more complete story.
Moving from FID to INP is like upgrading from a single snapshot to a full video. It captures the entire performance story, not just the opening scene, providing a truer sense of how responsive your site feels.
How Often Should I Be Checking My Vitals Scores?
Honestly, for the most effective approach, continuous monitoring is the way to go. Setting up a Real User Monitoring (RUM) tool means you can see performance trends in real-time. This lets you spot problems and fix them before they affect a huge chunk of your audience.
If you can't do continuous monitoring, you should at least perform a detailed check at these critical moments:
- After any major site update or redesign.
- Whenever you launch a significant new feature.
- At a minimum, once a quarter to keep a pulse on your site's health.
This regular cadence helps you get ahead of performance issues instead of just reacting to them.
Ready to stop guessing and start knowing? Swetrix provides privacy-first, real-time performance monitoring to help you master your Core Web Vitals. Start your free 14-day trial today and see what your real users are experiencing.