- Date
13 Best Website Performance Monitoring Tools for 2025
 Andrii Romasiun
In 2025, a slow website isn't just an inconvenience; it's a direct threat to your bottom line. Every millisecond of delay translates into lost conversions, higher bounce rates, and a tarnished brand reputation. This is where website performance monitoring tools become indispensable. They are your digital watchtowers, providing the critical data needed to diagnose issues before they impact your users.
This article moves beyond generic lists to offer a practical, side-by-side analysis of 13 leading solutions. We'll explore their unique strengths, ideal use cases, and crucial limitations. Whether you're a startup founder needing simple uptime checks or a DevOps team requiring a comprehensive observability platform, this guide is designed to help you make an informed decision.
Each entry provides a concise breakdown of key features, pricing structures, and integration capabilities, complete with screenshots and direct links. Our goal is to equip you with the specific insights needed to select the best tool for your technical stack and business objectives. We'll delve into everything from real user monitoring (RUM) with Swetrix to synthetic transaction testing with Datadog and New Relic, ensuring you find the right fit to maintain a fast, reliable, and high-performing website.
1. Swetrix
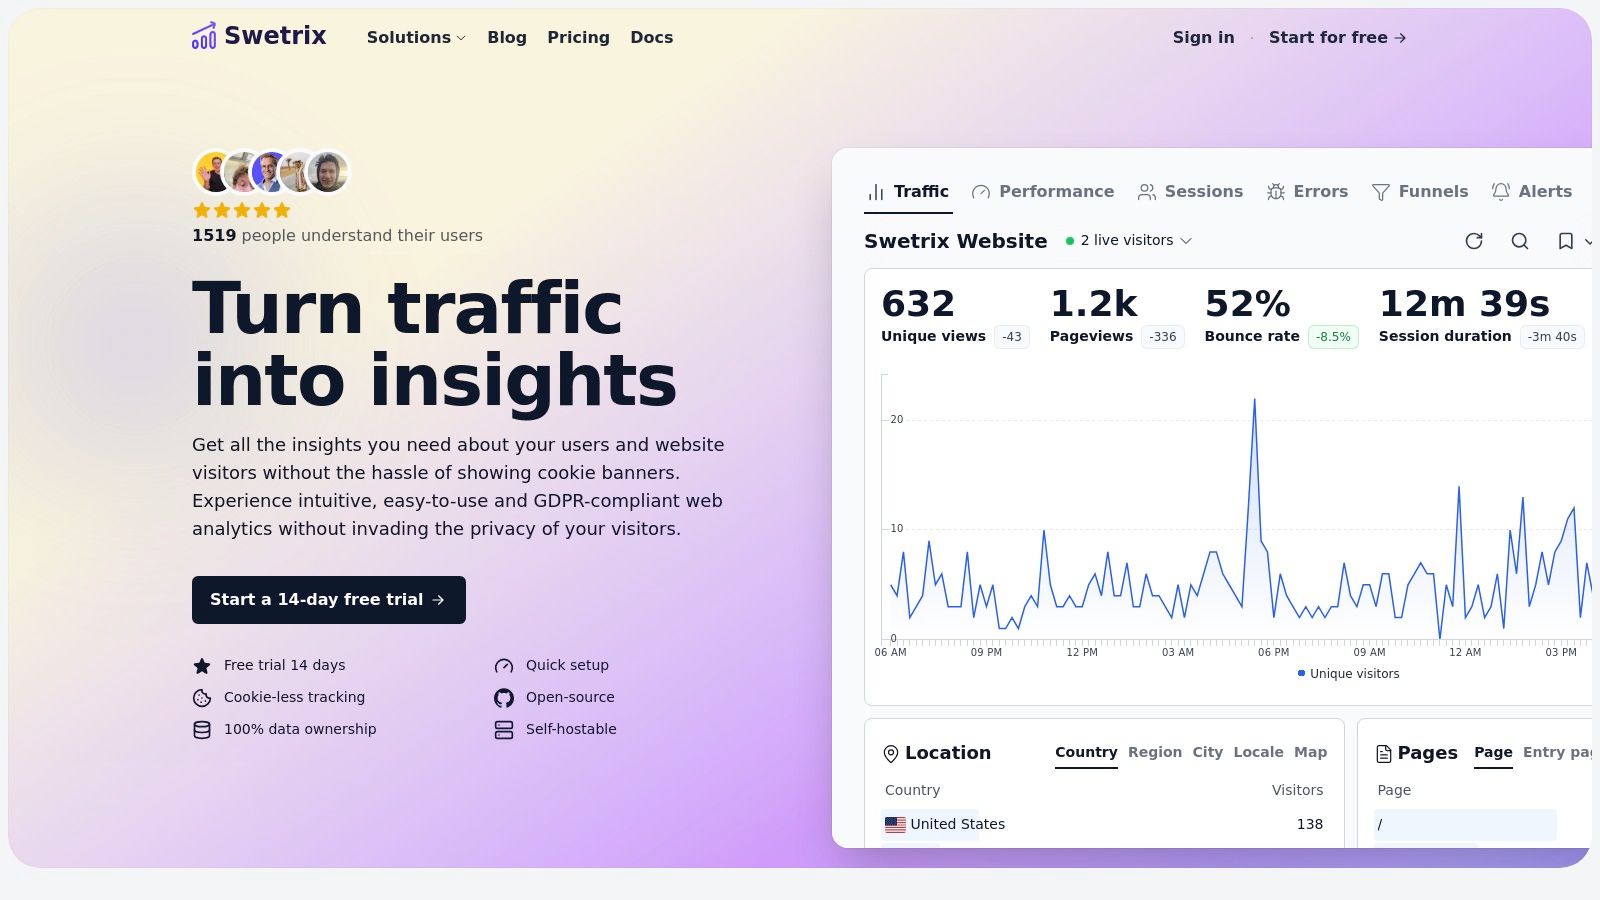
Swetrix stands out as a powerful, privacy-first alternative in the world of website performance monitoring tools. It delivers clear, actionable insights without relying on cookies, ensuring GDPR compliance and respecting visitor anonymity. This platform is built for teams who demand 100% data ownership and transparency, offering a robust feature set that bridges the gap between traditional analytics and modern performance monitoring.
It adeptly combines essential traffic metrics like top pages, referrers, and UTM campaign tracking with advanced capabilities. Swetrix Cloud users can analyze opt-in session recordings when they enable replay recording, map user flows, build conversion funnels, and monitor real-user website speed metrics. Swetrix also includes built-in error tracking, which aggregates issues by browser, device, and page, providing developers with critical data to resolve bugs quickly.
Key Features & Use Cases
Swetrix is uniquely positioned to serve multiple roles within an organization. For marketing and growth teams, its cookieless tracking provides reliable insights into campaign performance and user journeys without navigating complex consent banners for standard analytics. Product managers and UX researchers can use session analysis, optional Cloud replay, and funnels to identify friction points and optimize conversion paths.
Developers and DevOps teams gain significant value from the open-source Community Edition, which allows for self-hosting and complete data control. The platform’s API access and configurable alerts to Slack, Telegram, or Discord integrate seamlessly into existing development workflows, making it an excellent tool for proactive issue resolution.
“Swetrix has been a game changer for our analytics.” - Alex Bowles, Co-founder, Casterlabs
Implementation and Pricing
Getting started is straightforward. A lightweight script is all that's needed to begin data collection. Swetrix offers a 14-day free trial for its hosted cloud solution (no credit card required), with pricing based on event volume. Plans start at $19/month for 100,000 events, scaling up to meet higher traffic demands, making it accessible for startups and scalable for growing businesses.
- Best For: Teams prioritizing privacy, data ownership, and a blend of analytics with real-user performance monitoring.
- Pros: Cookieless and GDPR-aligned, open-source self-hosting option, combines core analytics with error tracking and speed metrics, transparent pricing.
- Cons: No permanently free hosted plan beyond the trial, fewer native integrations than enterprise-level competitors.
Website: https://swetrix.com
2. Pulsetic
Pulsetic provides an elegant and straightforward approach to website performance and uptime monitoring. While many performance tools focus heavily on complex technical metrics, Pulsetic caters to teams that need to know immediately if their site is down or experiencing severe latency, and want to communicate that status beautifully to their users.
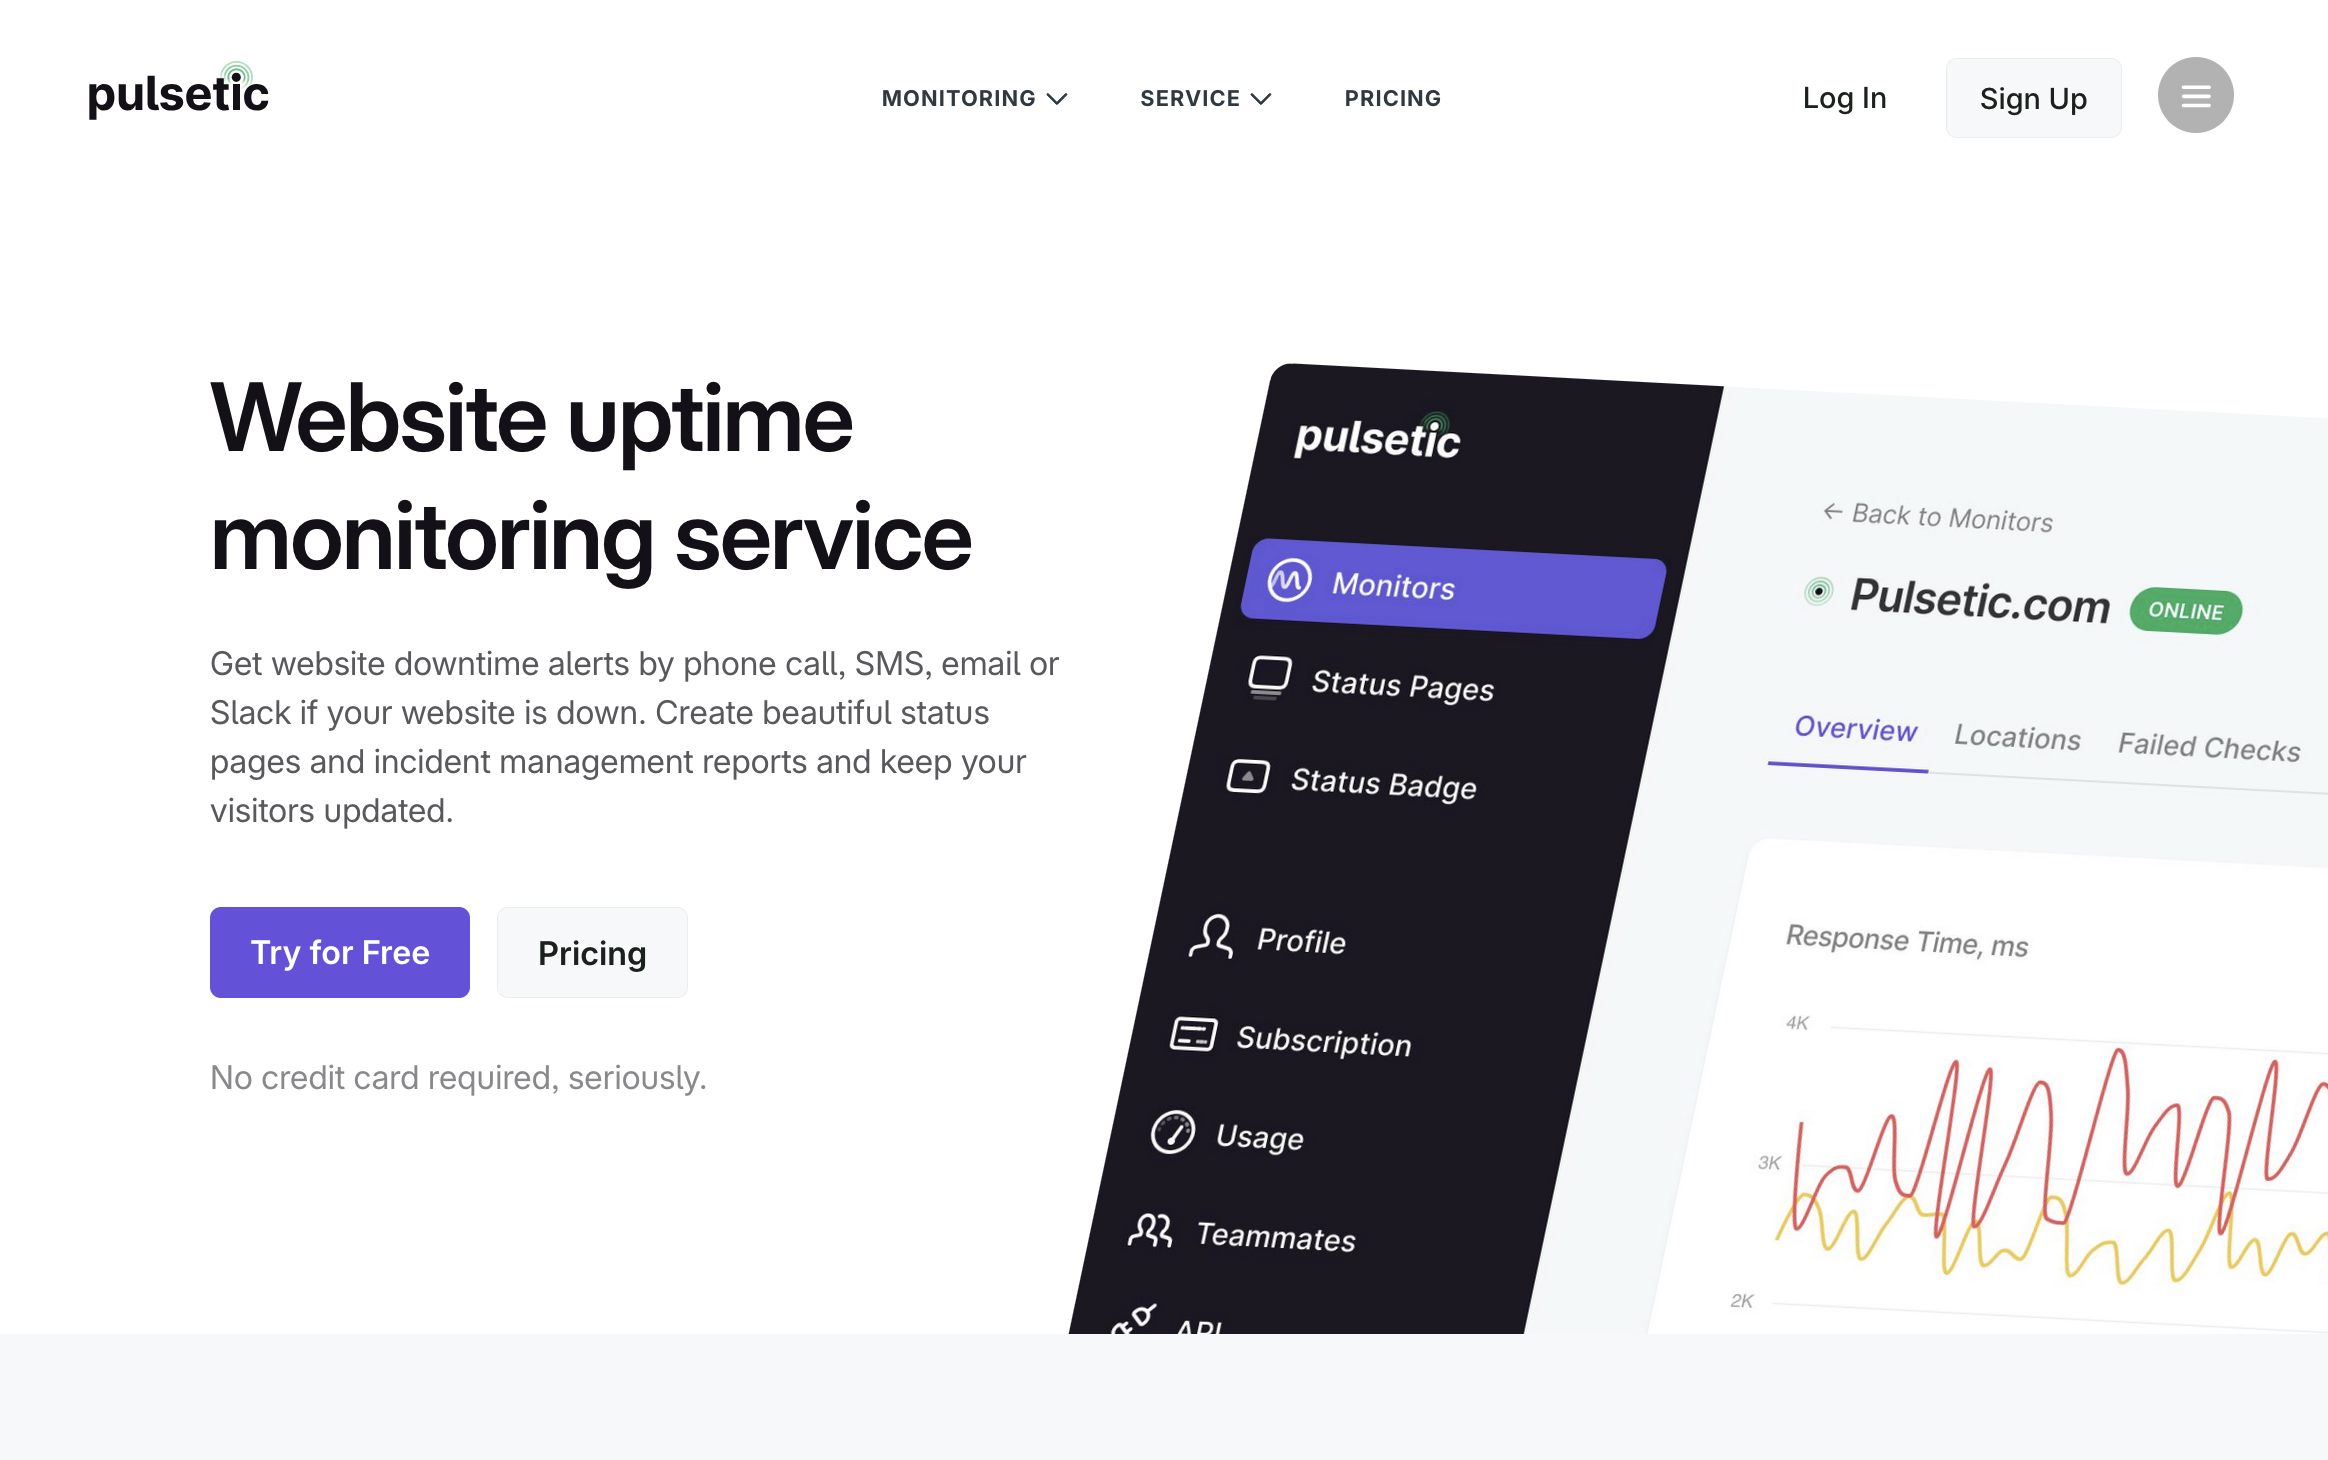
It combines global uptime monitoring with incredibly customizable status pages, allowing you to build trust with your audience. Pulsetic also tracks SSL certificates and domain expirations, ensuring you don't suffer outages due to overlooked administrative tasks. Its clean interface makes it accessible for anyone on the team to use, not just engineers.
Key Details & Use Cases
- Best For: Startups, agencies, and small to medium businesses needing reliable uptime monitoring paired with stunning status pages.
- Standout Feature: The status page builder is best-in-class, allowing for deep customization to match your brand perfectly without any coding.
- Implementation Tip: Set up your free status page immediately upon creating an account, and route your critical monitors to display their uptime history publicly or privately to your team.
- Pricing: A generous free tier is available. Paid plans begin at $9/month, which includes more frequent checks and additional customization options.
- Website: pulsetic.com
| Pros | Cons |
|---|---|
| Exceptional Design: Highly intuitive UI and beautiful status pages. | Lacks APM: Doesn't provide deep application performance monitoring. |
| Ease of Use: Can be configured in minutes without technical expertise. | No Synthetic Journeys: Doesn't record complex multi-step browser scripts. |
| Comprehensive Alerts: Supports SMS, phone calls, Slack, and webhooks. |
3. Datadog
Datadog positions itself as a comprehensive, unified observability platform, making it one of the most powerful website performance monitoring tools for teams needing to connect front-end user experience with back-end infrastructure. It goes far beyond simple uptime checks by offering Synthetic Monitoring for proactive tests and Real User Monitoring (RUM) to capture actual user session data. This dual approach allows you to simulate user journeys from global locations and analyze real-world performance simultaneously.

The platform’s key differentiator is its ability to seamlessly link browser test results, like waterfall charts and error screenshots, directly to associated back-end traces, logs, and infrastructure metrics. For a DevOps team, this means drastically reduced time to identify root causes, whether the issue is a slow API response or a client-side JavaScript error. To see how this data can be visualized, you can review examples of a modern web analytics dashboard.
Key Details & Use Cases
- Best For: Teams that need to correlate front-end performance with back-end observability (APM, logs, infrastructure) in a single platform.
- Standout Feature: Self-maintaining browser tests that use machine learning to adapt to minor UI changes, reducing test fragility and maintenance overhead.
- Implementation Tip: Start with a few critical user-journey synthetic tests (like login or checkout) before expanding. Leverage the no-code web recorder to build these initial tests quickly without writing any scripts.
- Pricing: Datadog uses a modular, usage-based model. Synthetic API tests start at $7 per 10,000 runs, and browser tests are $18 per 1,000 runs. RUM pricing is based on the number of user sessions per month.
- Website: datadoghq.com
| Pros | Cons |
|---|---|
| Unified Platform: Correlates front-end and back-end data. | Cost: Can become expensive as you add more modules and increase usage. |
| Intelligent Tests: Self-maintaining tests adapt to UI changes. | Learning Curve: The platform's breadth can be overwhelming for new users. |
| Deep Integrations: Extensive ecosystem for end-to-end visibility. |
4. New Relic
New Relic provides a full-stack observability platform designed to make sophisticated website performance monitoring tools accessible to everyone, from startups to large enterprises. It combines Real User Monitoring (RUM) and Synthetic Monitoring into a unified Digital Experience Monitoring solution. This allows teams to analyze actual user sessions to understand real-world performance bottlenecks while proactively running simulated tests from global locations to ensure availability and functionality around the clock.
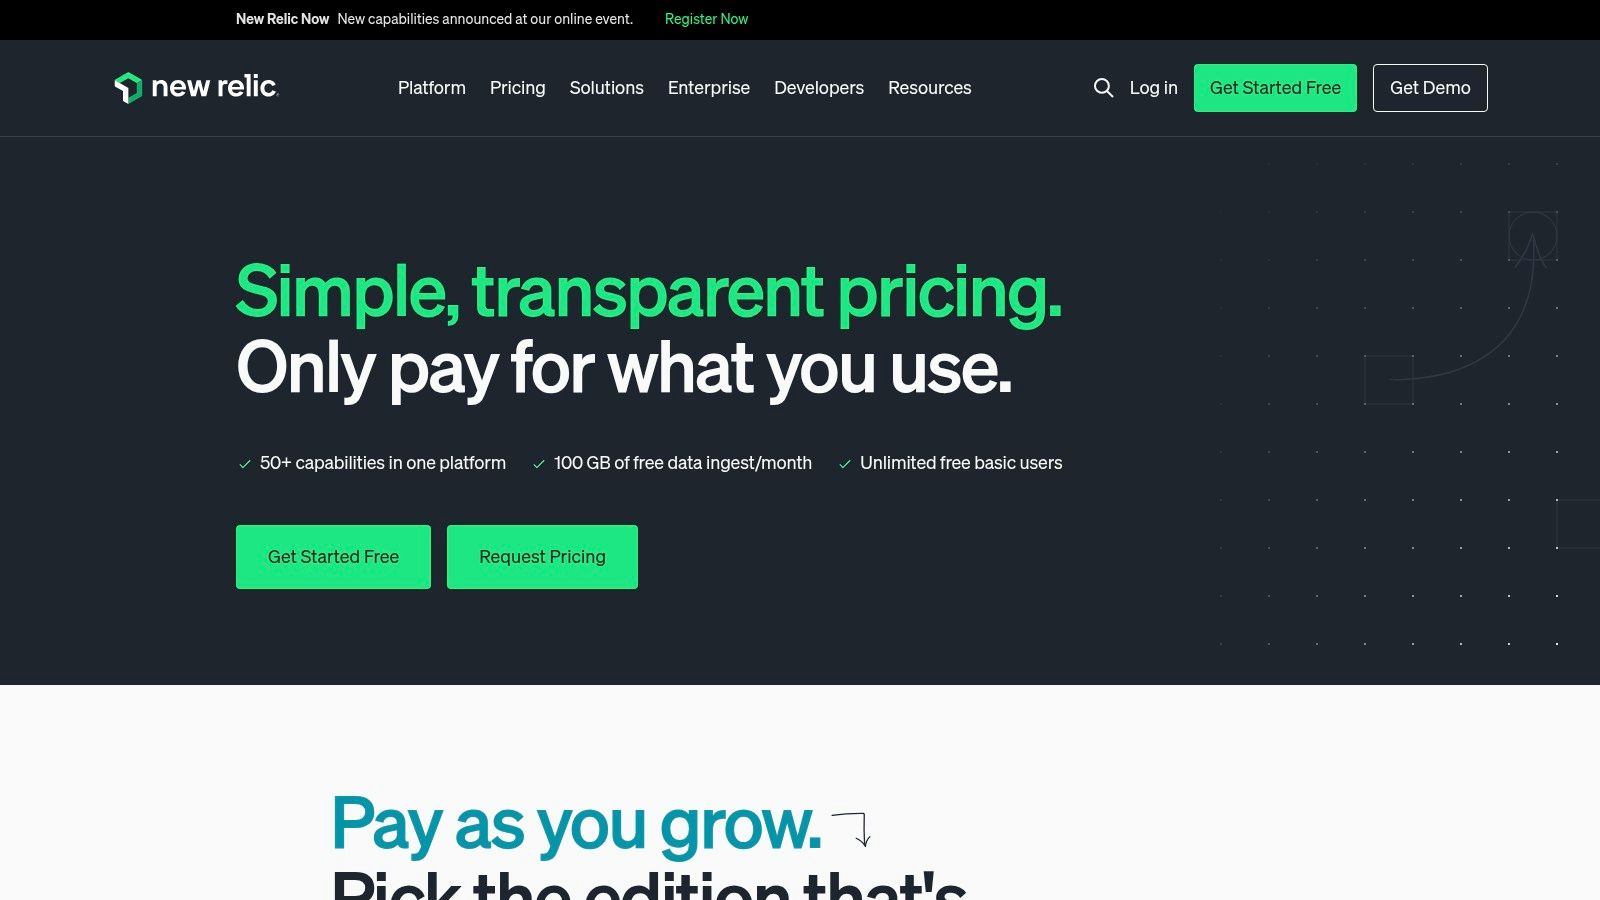
The platform's most compelling feature is its generous free tier, which removes the initial barrier to entry for comprehensive monitoring. By unifying front-end user experience data with back-end APM, infrastructure, and log data, New Relic enables teams to trace a poor user experience directly to its root cause, whether it's a slow database query or a client-side rendering issue. This integrated approach is crucial for effective error tracking and resolution.
Key Details & Use Cases
- Best For: Teams of all sizes looking for a powerful, unified observability platform with a low-friction, generous free entry point.
- Standout Feature: The perpetual free tier includes 100 GB of data ingest per month and 500 synthetic checks, making it one of the most accessible enterprise-grade tools available.
- Implementation Tip: Take full advantage of the free tier to connect your front-end browser monitoring with a back-end APM agent. This provides instant correlation between user-facing issues and server-side performance without any initial cost.
- Pricing: Offers a free tier with significant allowances. The pay-as-you-go model applies after free limits are exceeded, with clear pricing for additional data ingest and synthetic checks (starting at $0.005/check).
- Website: newrelic.com
| Pros | Cons |
|---|---|
| Low-friction Entry: Perpetual free tier is ideal for getting started. | Unpredictable Costs: Usage-based bills can be harder to forecast at scale. |
| Unified Platform: Combines RUM, Synthetics, APM, and logs. | Advanced Features Cost Extra: Some data retention and governance options require a Data Plus subscription. |
| Transparent Pricing: Clear add-on pricing for extra synthetic checks. |
5. Pingdom (SolarWinds)
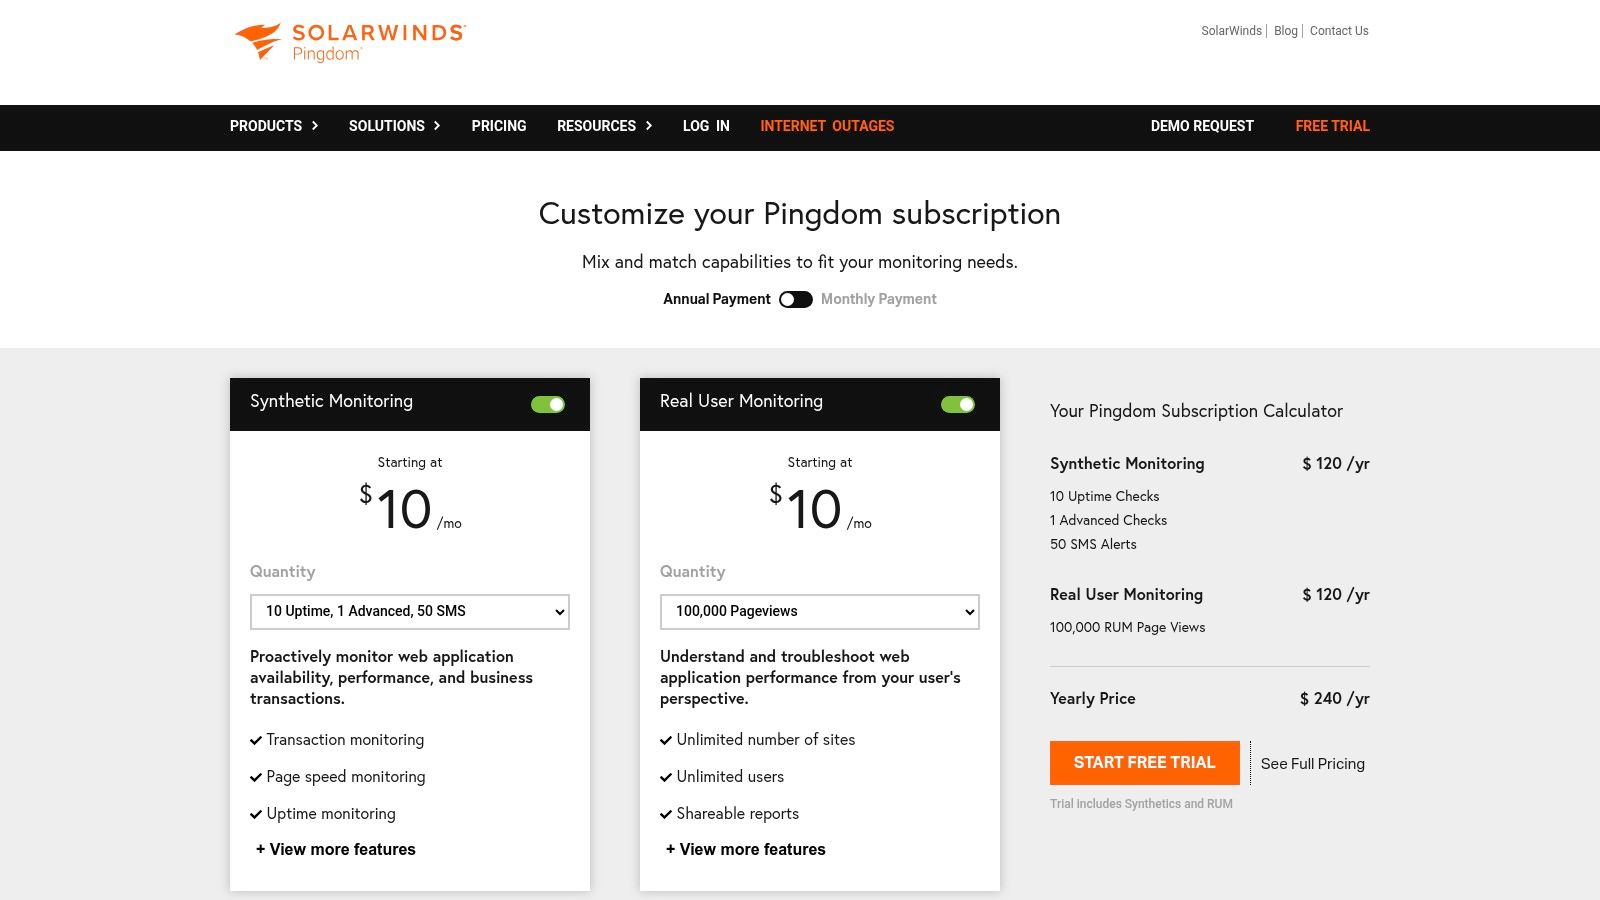
Pingdom, now part of the SolarWinds ecosystem, is one of the most recognized names in website performance monitoring tools, prized for its simplicity and focus. It specializes in delivering straightforward uptime checks, page speed analysis, and transaction monitoring, making it an excellent starting point for teams prioritizing web-centric availability and performance. The platform offers both Synthetic Monitoring to proactively test user paths and Real User Monitoring (RUM) to collect data from actual visitor sessions.
Its strength lies in its user-friendly interface and guided setup, which allows marketing and digital teams to configure critical checks without deep technical expertise. While it excels at front-end monitoring, Pingdom also provides a pathway to deeper observability. Teams can extend its capabilities into application performance management (APM) and log analysis by integrating with other products in the broader SolarWinds suite, offering a scalable monitoring journey.
Key Details & Use Cases
- Best For: Digital teams and businesses that need an easy-to-use, web-focused tool for uptime, page speed, and transaction monitoring.
- Standout Feature: The combination of a highly intuitive interface with reliable, multi-location alerting that makes it simple to get started with meaningful monitoring.
- Implementation Tip: Begin by setting up uptime checks for your homepage and key landing pages. Then, create a transaction check for your most critical user flow, like the login or purchase process, to ensure core functionality is always working.
- Pricing: Pingdom offers a pricing calculator to tailor plans. Synthetic Monitoring starts around $15/month for 10 uptime checks and 1 advanced check. Real User Monitoring pricing is based on pageviews.
- Website: www.pingdom.com
| Pros | Cons |
|---|---|
| Straightforward Feature Set: Easy to set up and use without a steep learning curve. | Pricing Requires Configuration: Exact list prices require using a calculator or contacting sales. |
| Established Brand: Long history and strong reputation in website monitoring. | Back-end Tracing is Separate: Deeper APM requires purchasing other SolarWinds products. |
| Clear, Actionable Alerts: Provides reliable notifications for downtime and performance issues. |
6. UptimeRobot
UptimeRobot carves out its niche as one of the most accessible and budget-friendly website performance monitoring tools, focusing squarely on uptime and availability. It’s the go-to solution for startups, bloggers, and small businesses that need reliable, straightforward alerting without the complexity of a full-stack observability platform. The service allows you to quickly set up monitors for HTTP(S) availability, specific keyword presence, port responsiveness, and simple pings to ensure your core services are online and reachable.
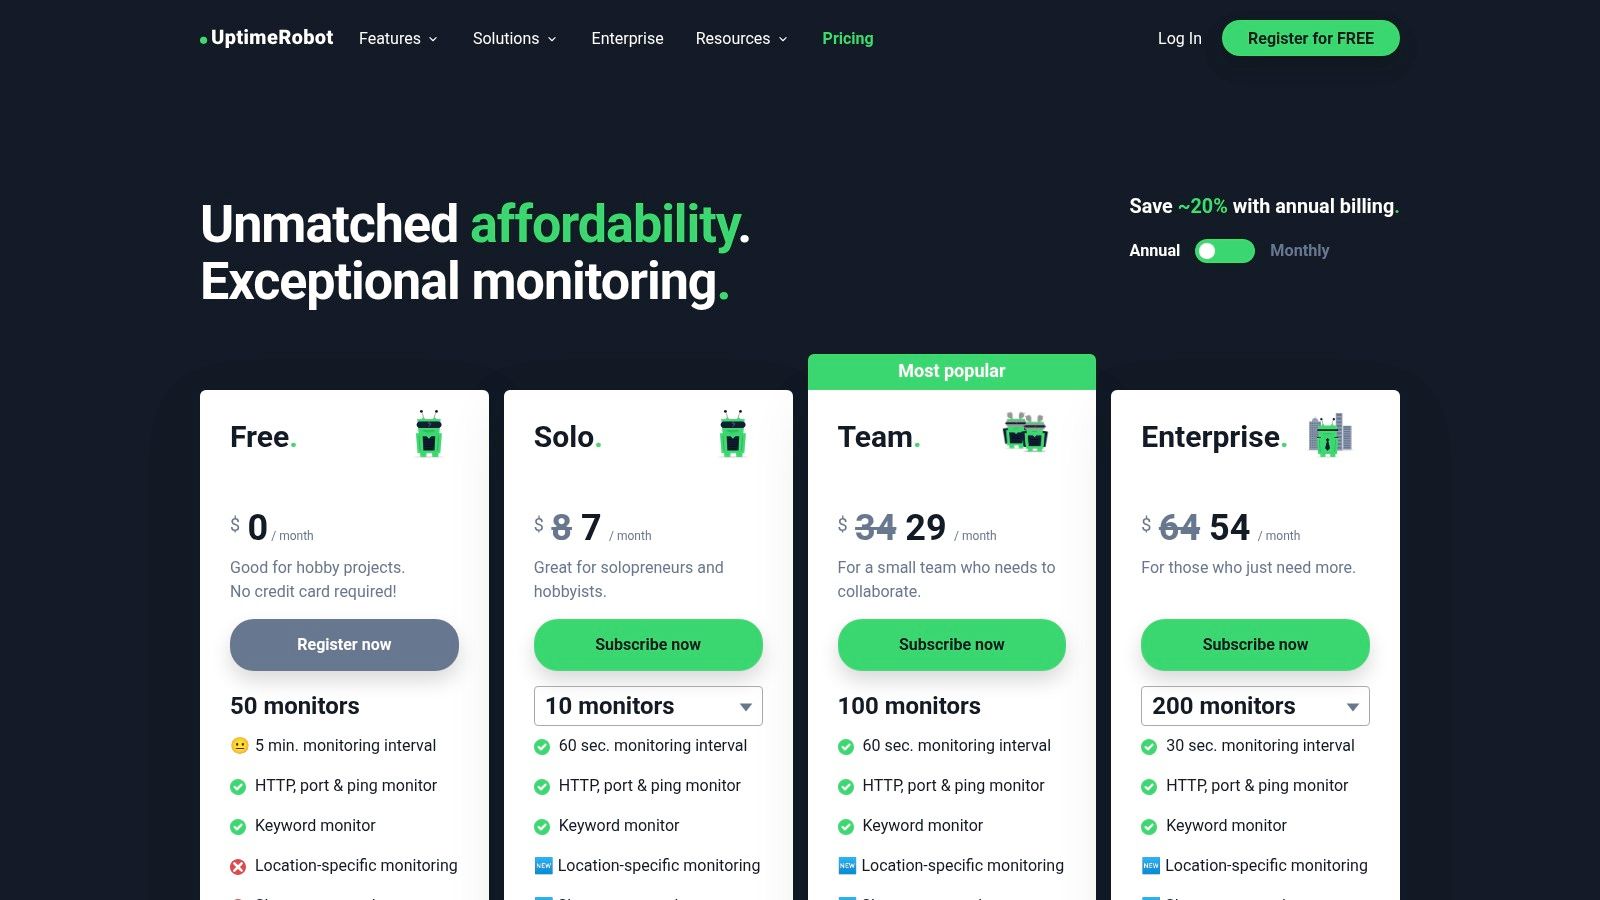
Its key differentiator is its unbeatable price-to-feature ratio, starting with a generous free tier that satisfies many basic monitoring needs. UptimeRobot also offers practical features like public status pages to communicate downtime transparently with users and sends alerts for SSL and domain expiry, helping prevent unexpected outages. For teams that prioritize simple, cost-effective availability checks over deep-dive performance analytics, UptimeRobot provides exceptional value and ease of use.
Key Details & Use Cases
- Best For: Individuals and businesses needing simple, affordable, and reliable uptime monitoring with basic alerting.
- Standout Feature: The generous free tier provides 50 monitors with 5-minute checks, making it an excellent starting point for any project.
- Implementation Tip: Use the keyword monitoring feature to check for specific text on a page. This ensures not only that the server is up, but that the correct content is being served.
- Pricing: A free plan is available. Paid plans start at $8/month for 50 monitors with 60-second checks and expand with faster intervals and more features.
- Website: uptimerobot.com
| Pros | Cons |
|---|---|
| Excellent price-to-feature ratio: Generous free plan and affordable paid tiers. | Limited scope: Focused primarily on availability, not deep performance or browser testing. |
| Simple to deploy: Get your first monitor running in less than a minute. | Advanced features tiered: Faster check intervals and more users require higher plans. |
| Public status pages: Easily communicate service status to your users. |
7. Uptrends
Uptrends specializes in synthetic monitoring, offering a robust suite of tools for teams that need to proactively test and validate website availability and performance from a global perspective. Its strength lies in its extensive network of over 233 worldwide checkpoints, allowing businesses to simulate user interactions from specific regions and understand how their site performs for an international audience. The platform combines uptime, API, and Real User Monitoring (RUM) to provide a complete picture of digital experience.
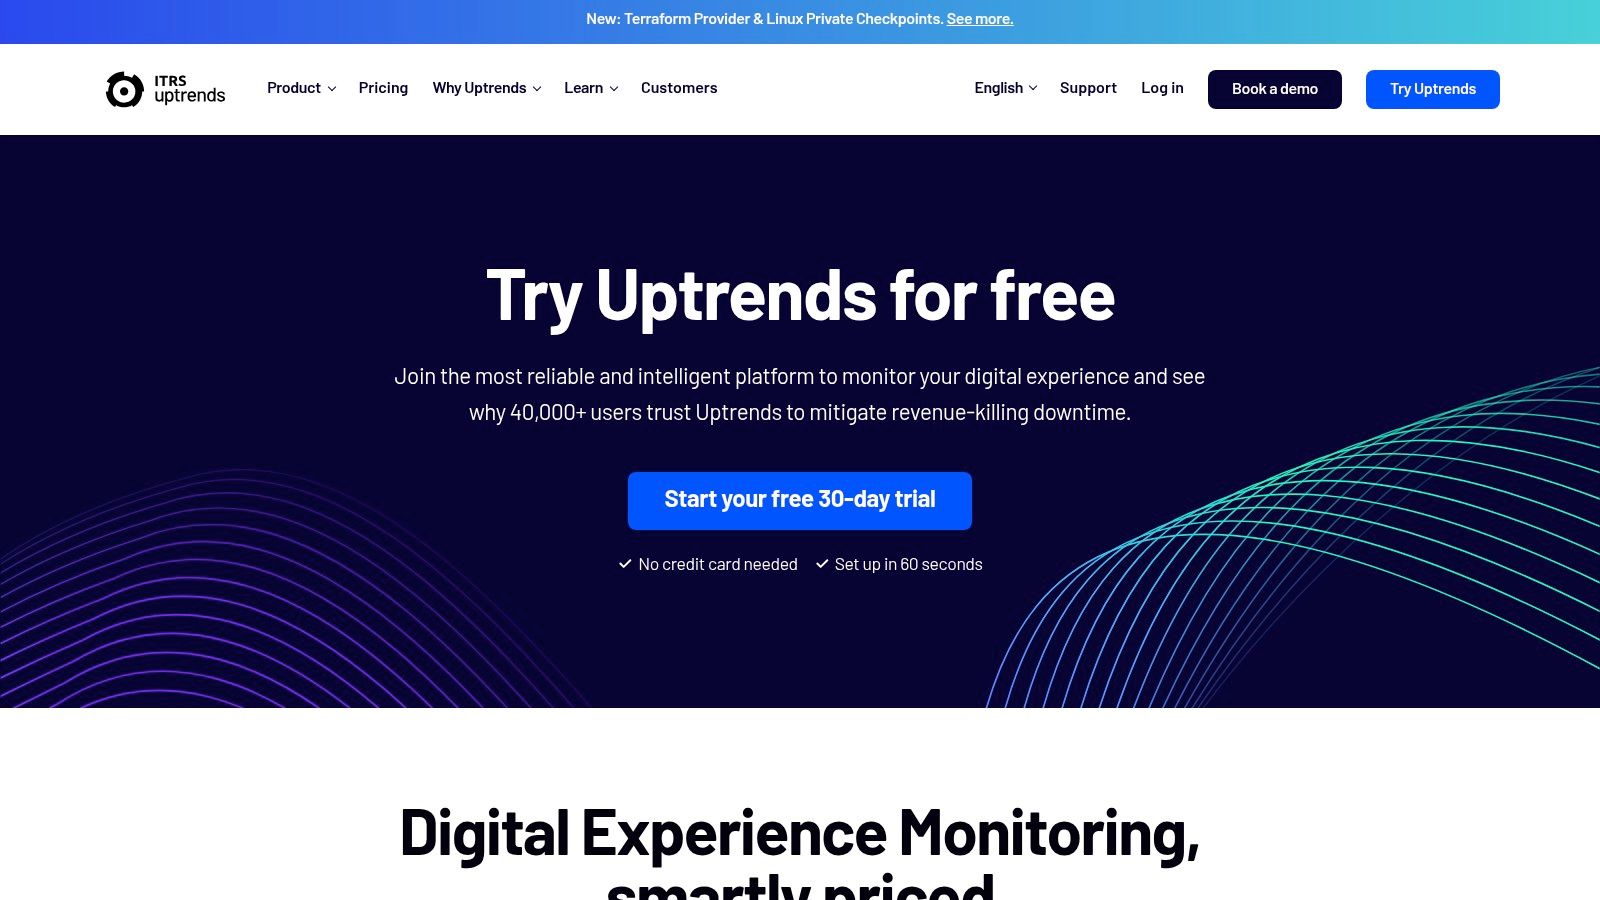
The standout feature is its detailed, browser-based transaction monitoring. Using a simple transaction recorder, teams can build complex multi-step user journey tests, such as logins or checkout flows, without writing code. Uptrends then runs these tests in real Chrome browsers, capturing detailed waterfall charts, filmstrip screenshots, and error reports. This makes it an excellent choice among website performance monitoring tools for pinpointing front-end bottlenecks and ensuring critical pathways are always functional.
Key Details & Use Cases
- Best For: E-commerce sites and global businesses that need to test complex user transactions and ensure performance across many geographic locations.
- Standout Feature: The expansive network of 233+ global monitoring checkpoints and the ability to set up private checkpoints for internal applications.
- Implementation Tip: Use the transaction recorder to script a critical checkout or sign-up process first. Schedule this test to run from key target market locations to get immediate, relevant performance data.
- Pricing: Uptrends offers various plans like Starter, Business, and Enterprise, often using a credit-based system. Pricing is modular based on the type and frequency of monitors.
- Website: uptrends.com
| Pros | Cons |
|---|---|
| Strong Visualization: Detailed waterfall charts and filmstrips for easy diagnostics. | Credit-Based Pricing: Can be unfamiliar and requires planning to manage costs effectively. |
| Extensive Checkpoint Network: Unparalleled global testing coverage. | Add-Ons Required: Some enterprise-level features may require add-ons or custom plans. |
| Private Checkpoints: Monitor internal applications behind a firewall. |
8. GTmetrix
GTmetrix is one of the most accessible website performance monitoring tools, focusing specifically on page-level speed and Core Web Vitals. Powered by Google Lighthouse, it provides detailed, actionable reports that are easy for non-engineers and front-end developers to understand. Instead of complex user journey simulation, GTmetrix excels at scheduled, on-demand analysis of individual pages, allowing you to track performance metrics like Largest Contentful Paint (LCP) and Total Blocking Time (TBT) over hours, days, or weeks.
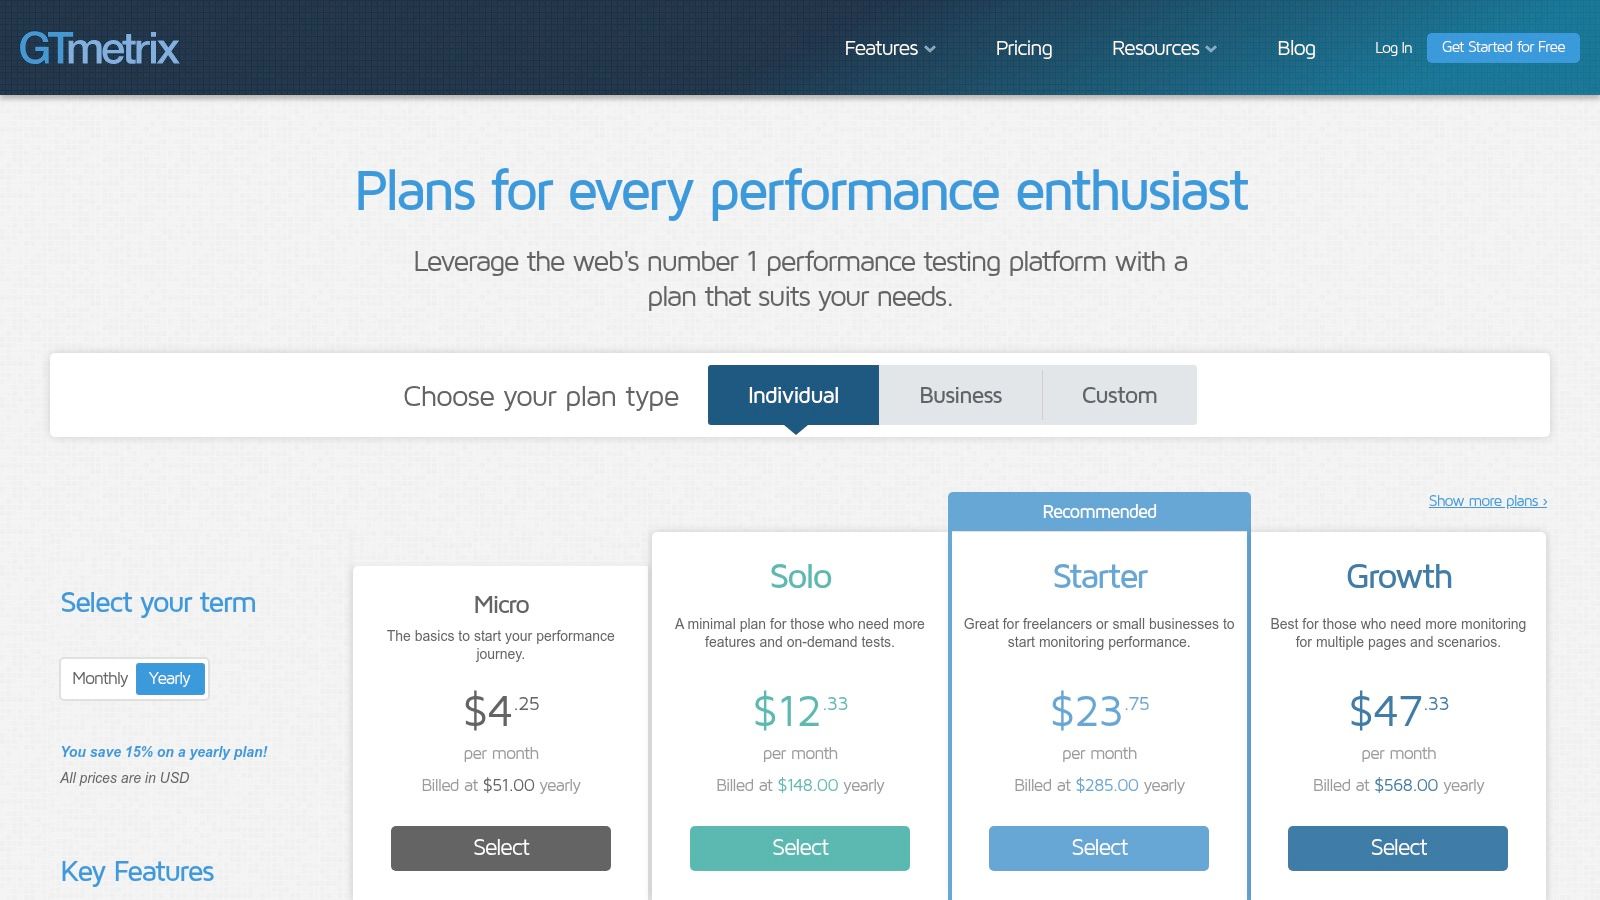
Its core strength lies in diagnostics. Each report includes a waterfall chart, video playback of the page load, and a filmstrip view, making it simple to visualize and pinpoint front-end bottlenecks. For teams focused purely on optimizing page speed scores and user-facing load times, GTmetrix offers a clear, uncluttered view. For a deeper understanding of how these metrics impact your overall digital strategy, you can find a comprehensive overview of website performance metrics on Swetrix.com.
Key Details & Use Cases
- Best For: Marketing teams, SEO specialists, and front-end developers needing to track and improve page speed and Core Web Vitals.
- Standout Feature: The combination of scheduled monitoring with detailed video capture and filmstrips, which provides clear visual evidence of performance regressions or improvements.
- Implementation Tip: Set up scheduled monitoring for key landing pages and competitors to benchmark performance. Use the alerts to get notified immediately if your page speed score drops below a set threshold.
- Pricing: Offers a free Basic plan. Paid plans with more monitoring slots and features start from $10.67/month (Solo plan) up to custom enterprise pricing.
- Website: gtmetrix.com
| Pros | Cons |
|---|---|
| Low entry cost: Easy for non-engineers to interpret. | Page-centric: Not a full synthetic journey runner for complex workflows. |
| Clear Diagnostics: Page-focused reports are useful for front-end teams. | Limited Visibility: Lacks back-end tracing or infrastructure insights. |
| Scheduled Monitoring: Tracks page performance over time automatically. |
9. SpeedCurve
SpeedCurve is a front-end-focused platform designed for teams who want to connect the dots between synthetic "lab" data and real-world user experience. It excels at visualizing performance metrics in a way that resonates with both engineers and designers. By combining Real User Monitoring (RUM) with in-depth synthetic checks, SpeedCurve provides a holistic view of how site speed impacts business outcomes and user engagement.
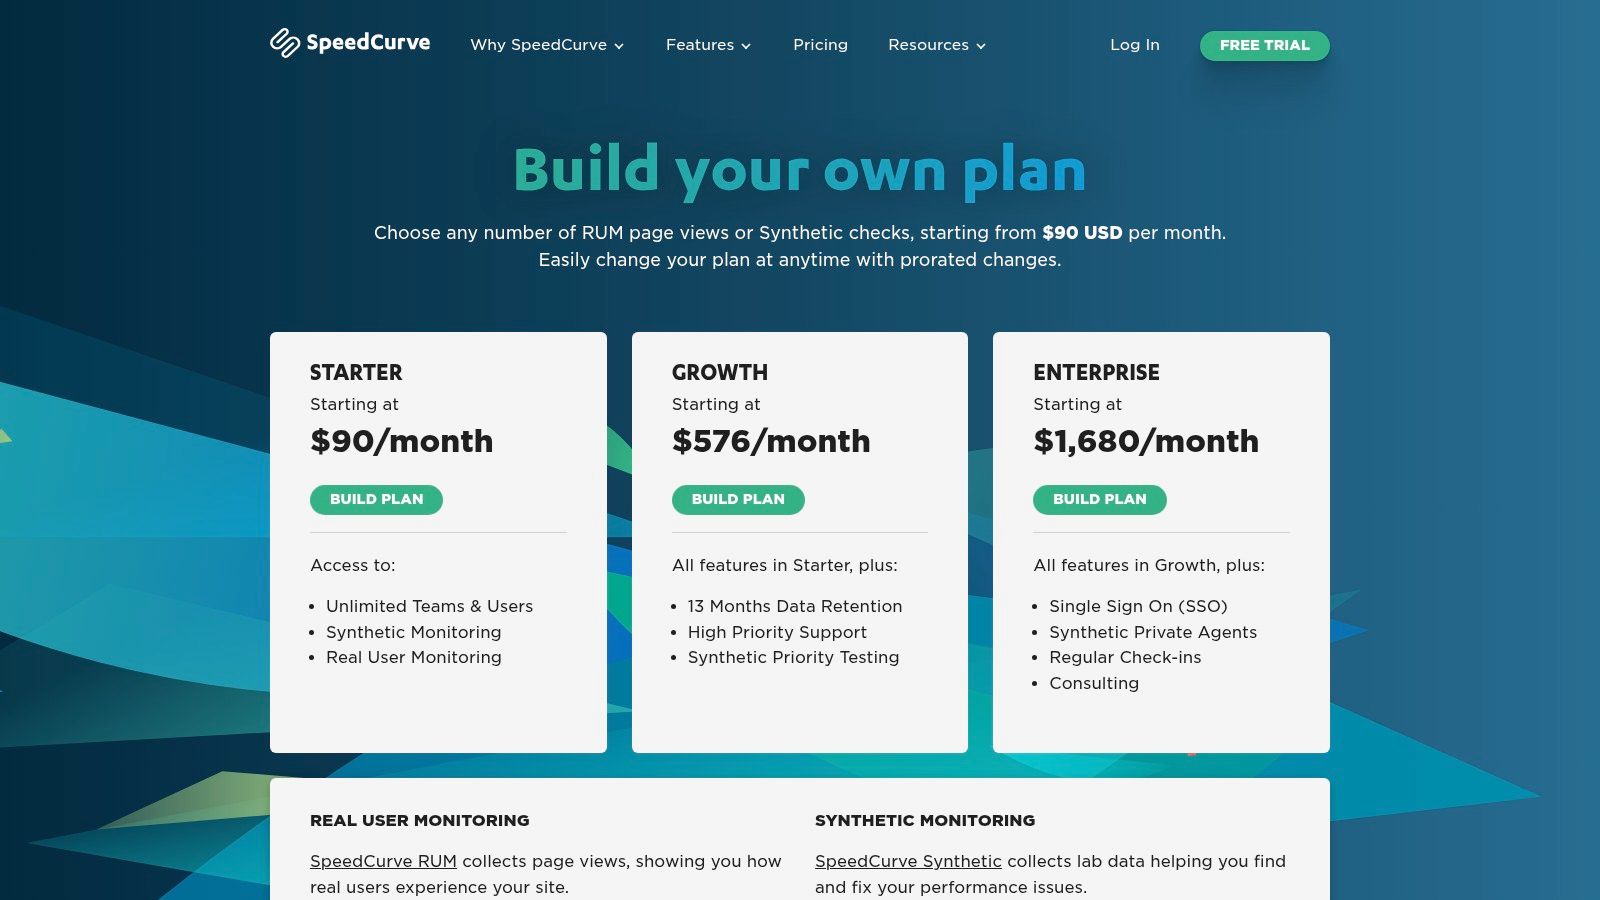
The platform’s standout capability is its emphasis on performance budgets. Teams can set specific targets for metrics like Largest Contentful Paint or page weight and receive alerts when these budgets are exceeded. This feature makes it one of the most practical website performance monitoring tools for maintaining high standards across development cycles. Filmstrip views and detailed waterfall charts provide rich, actionable context for diagnosing slowdowns.
Key Details & Use Cases
- Best For: Design and front-end development teams focused on user experience and maintaining strict performance budgets.
- Standout Feature: Integrated performance budgets that allow you to set thresholds for key metrics and get alerts when builds exceed them.
- Implementation Tip: Use the "Compare" dashboard to benchmark your site against competitors, identifying specific areas where your user experience is falling behind.
- Pricing: Plans are based on a combination of RUM page views and synthetic checks, starting at $220/month for 100,000 page views and 5,000 synthetic checks. Higher tiers add features like SSO and private agents.
- Website: speedcurve.com
| Pros | Cons |
|---|---|
| Excellent Visualization: Makes complex data understandable for designers and engineers. | Cost: More expensive than basic uptime tools, especially for smaller projects. |
| Performance Budgets: Proactively enforce performance standards in your workflow. | Niche Focus: Best value is realized when using both its RUM and synthetic monitoring features together. |
| Straightforward Pricing: Clear pricing steps that are easy to understand and scale up. |
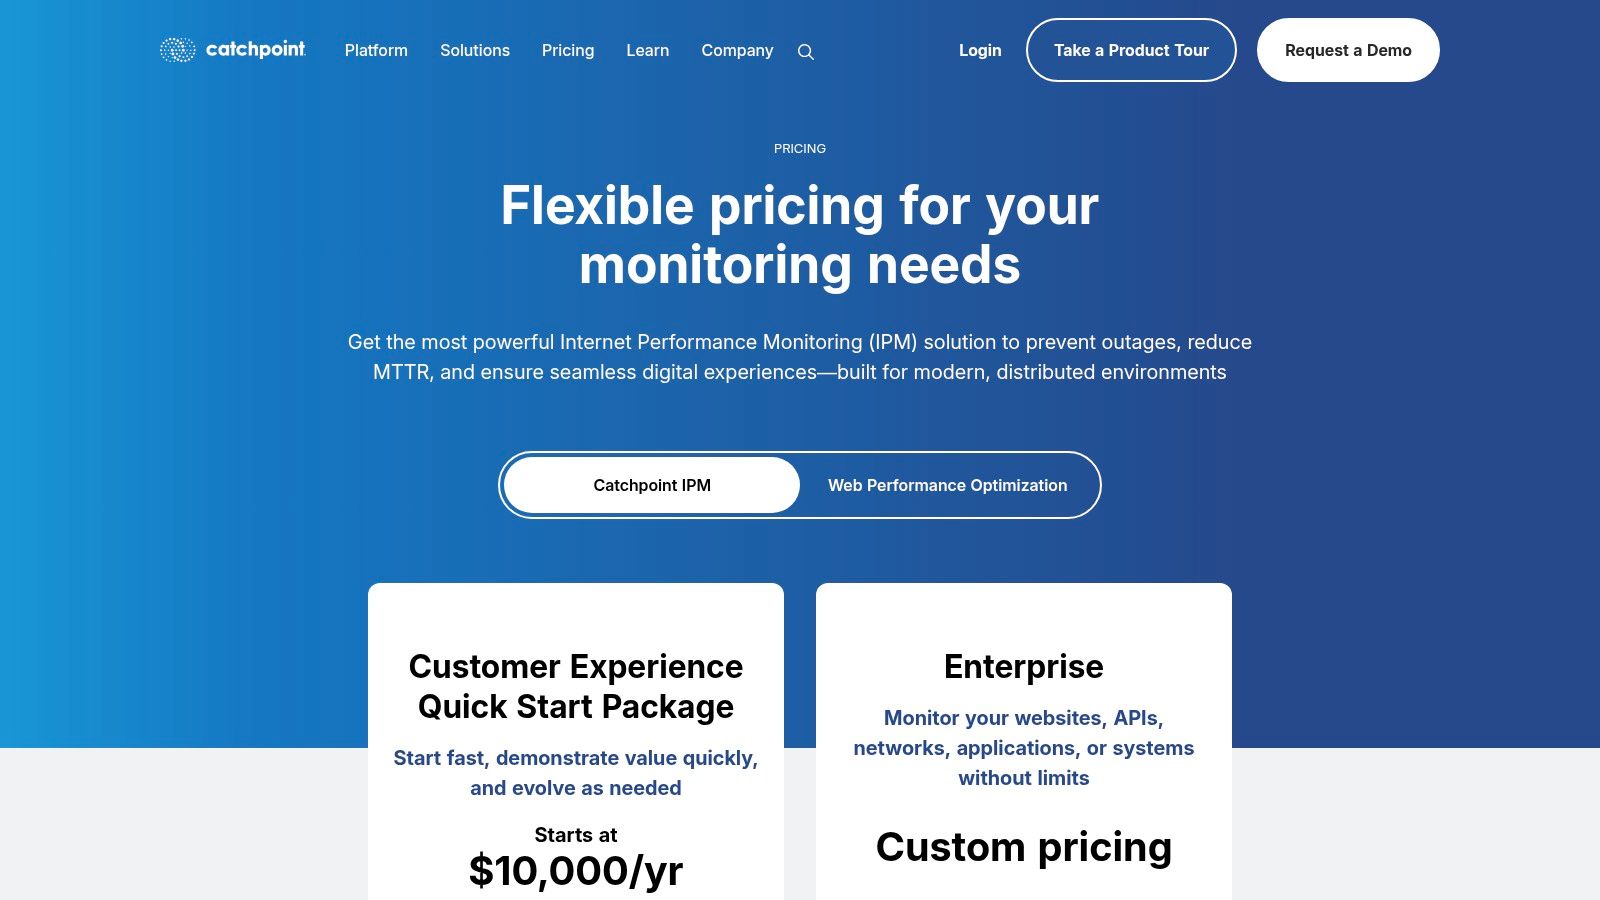
10. Catchpoint
Catchpoint provides an enterprise-grade digital experience monitoring platform, making it one of the most robust website performance monitoring tools for large organizations. Its primary strength lies in its expansive global monitoring network, which includes backbone, last-mile, cloud, and wireless nodes. This extensive reach allows businesses to proactively test performance and availability from the specific locations and networks their customers actually use, providing a highly accurate view of the end-user experience.
The platform excels at mapping the entire internet stack, visualizing dependencies on DNS, CDNs, and third-party APIs to pinpoint the root cause of outages or slowdowns. Its comprehensive protocol support and AI-driven diagnostics help teams quickly understand complex performance issues affecting critical user journeys. This depth makes it ideal for global e-commerce sites, financial services, and other businesses where uptime and performance are directly tied to revenue and reputation.
Key Details & Use Cases
- Best For: Large, customer-facing organizations that require extensive global monitoring coverage and deep diagnostic capabilities for complex digital services.
- Standout Feature: The vast and diverse global node network, offering unparalleled insight into how real users experience a website from various geographic locations and network types.
- Implementation Tip: Begin by mapping your most critical application delivery chain, including all key third-party services. Use Catchpoint's dependency maps to visualize potential points of failure before an incident occurs.
- Pricing: Pricing is customized for enterprise needs and typically requires engaging with their sales team for a quote. Packages are comprehensive and include structured onboarding.
- Website: catchpoint.com
| Pros | Cons |
|---|---|
| Extensive Global Coverage: Vast node network for accurate user simulation. | High Entry Price: Cost can be prohibitive for small to mid-sized businesses. |
| Deep Diagnostic Capabilities: Visualizes internet stack dependencies. | Sales-Gated Pricing: No public pricing; requires direct sales engagement. |
| Enterprise-Grade Support: Structured onboarding and support are included. |
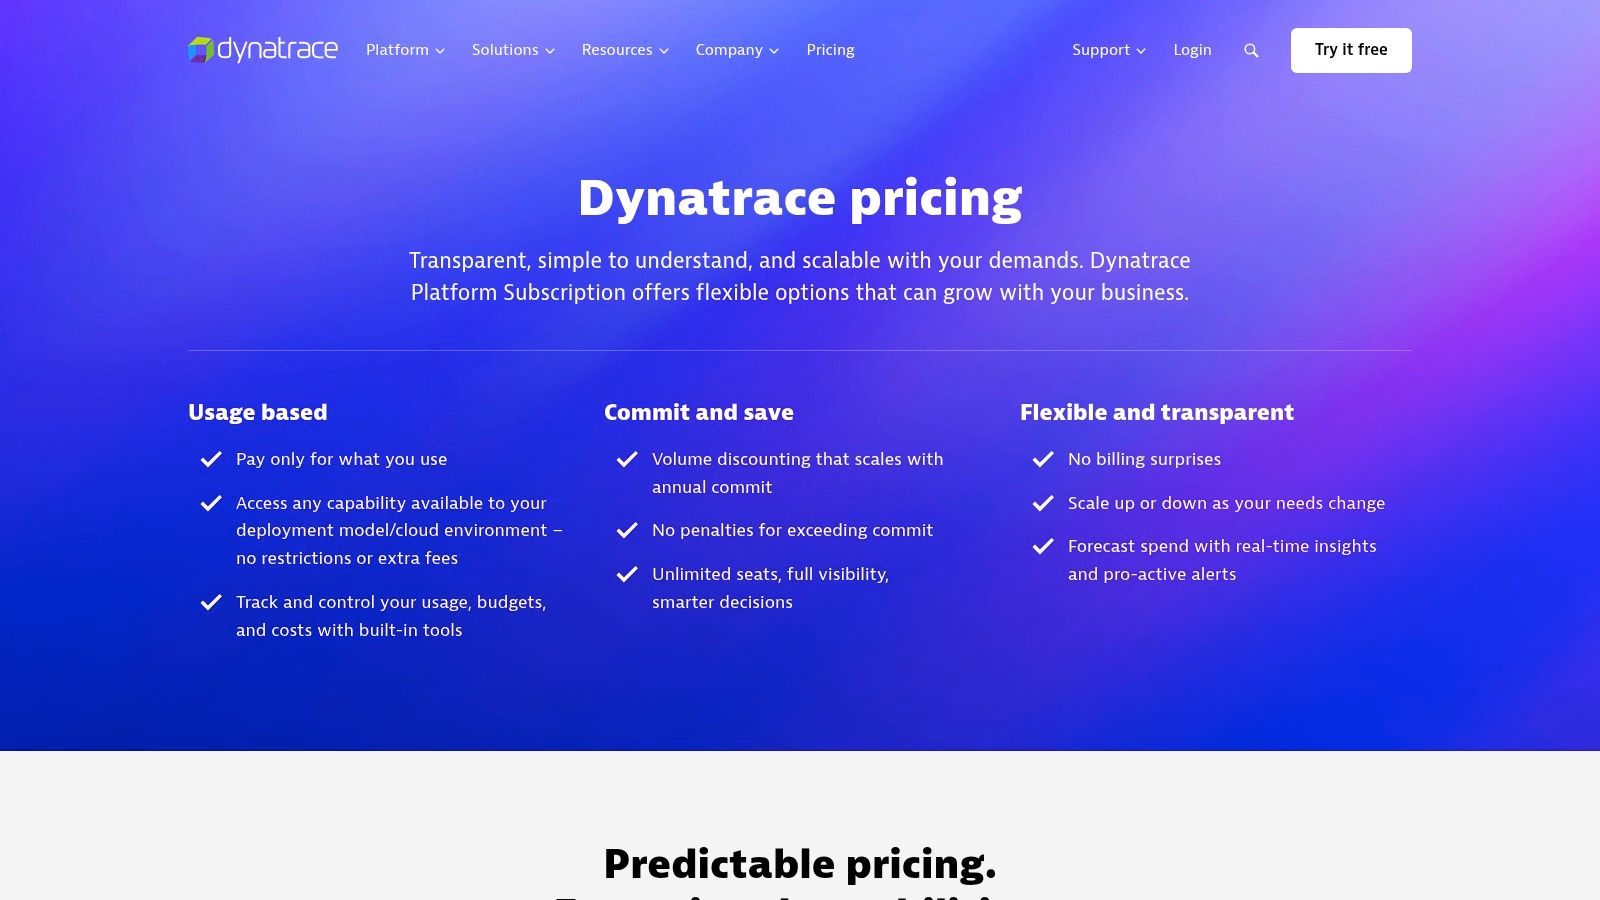
11. Dynatrace
Dynatrace provides an AI-powered, full-stack observability platform designed for complex, distributed environments. As a website performance monitoring tool, it excels by combining synthetic monitoring of user journeys with deep insights from its Application Performance Monitoring (APM), logs, and infrastructure data. Its core strength lies in automatically mapping dependencies and providing context for performance issues, which is ideal for organizations managing intricate microservices architectures.
The platform's standout feature is its AI engine, Davis, which performs automated root-cause analysis. Instead of just alerting you to a slow-loading page, Davis can trace the problem back through the entire technology stack to pinpoint the exact service, code, or infrastructure component responsible. This significantly accelerates troubleshooting in large-scale applications where manual correlation is nearly impossible, making it a powerful choice for enterprise-level performance management.
Key Details & Use Cases
- Best For: Enterprise teams with complex, distributed applications that need automated root-cause analysis and full-stack context.
- Standout Feature: The Davis AI engine, which provides deterministic root-cause analysis by correlating data across the entire platform automatically.
- Implementation Tip: Leverage the no-script recorder to quickly build synthetic browser tests for your most critical user clickpaths. This provides an immediate baseline for performance without any coding.
- Pricing: Dynatrace offers consumption-based pricing. Synthetic monitoring is priced per request, and Real User Monitoring is based on the number of sessions.
- Website: dynatrace.com
| Pros | Cons |
|---|---|
| Strong AI Analytics: Automated root-cause analysis saves significant time. | Premium Pricing: Can be a costly solution, making it less suitable for smaller projects. |
| Unified Observability: Seamlessly connects front-end data with back-end traces and logs. | Complexity: The extensive features can present a steep learning curve for new users. |
| Scales Well: Built to handle large, complex, and dynamic cloud environments. |
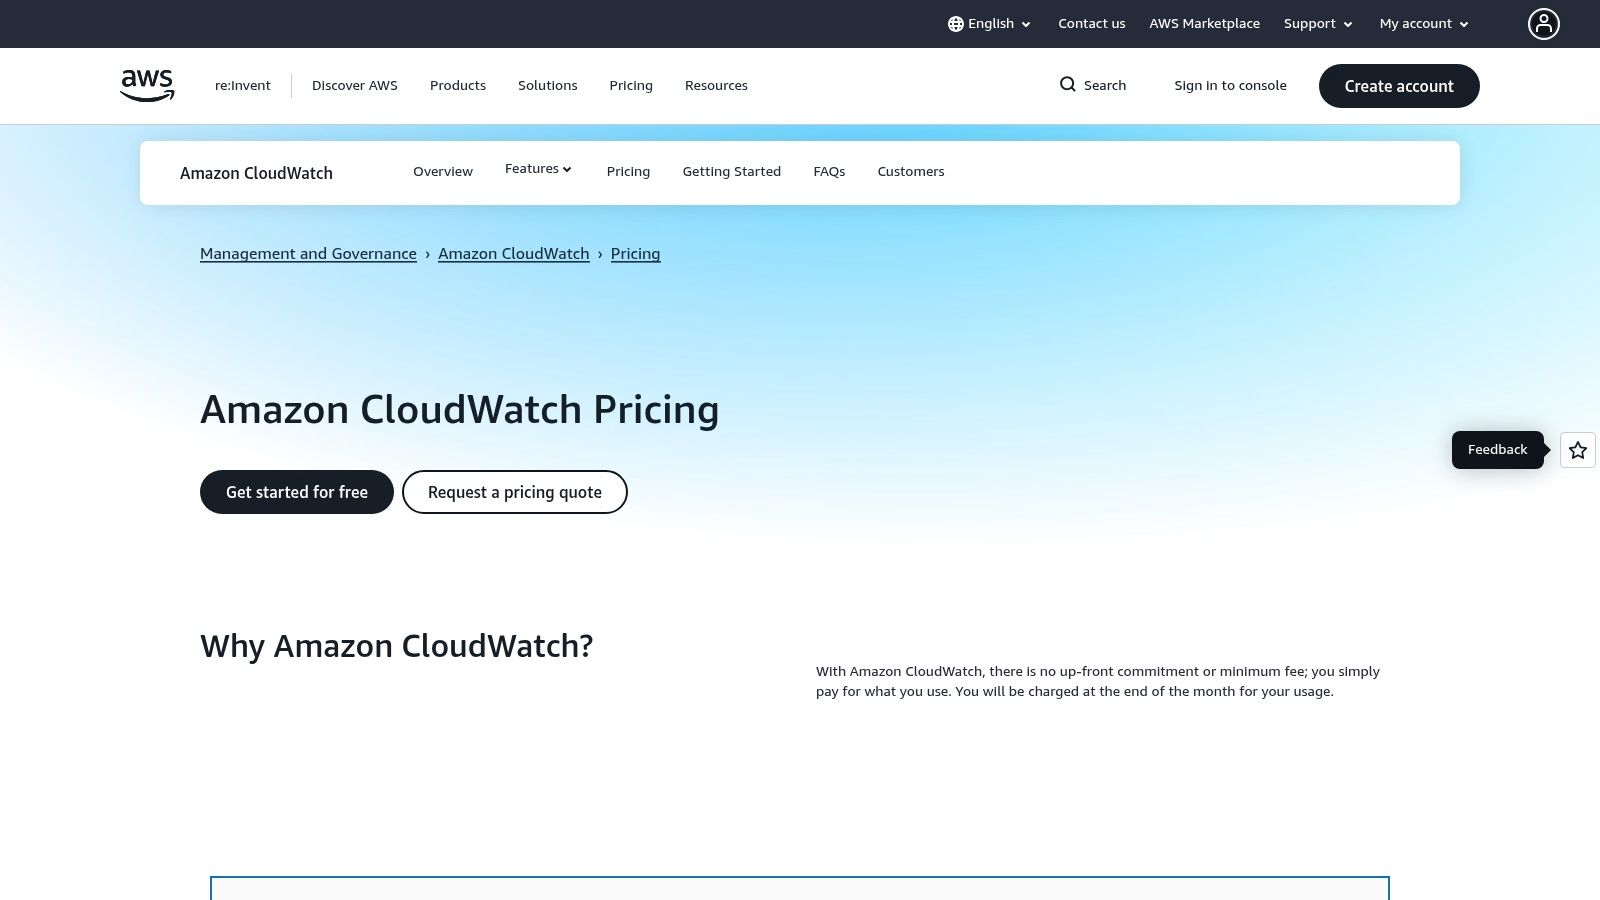
12. AWS (CloudWatch Synthetics / Canaries)
For teams already embedded in the Amazon Web Services ecosystem, AWS CloudWatch Synthetics offers a native and highly integrated approach to synthetic monitoring. Known as "Canaries," these are configurable scripts that simulate user actions to proactively monitor your websites, API endpoints, and web applications. This tool is particularly effective for monitoring internal applications running within a private VPC or for those who need fine-grained control over execution environments and costs.
The primary advantage of CloudWatch Canaries is their deep integration with other AWS services. Test artifacts like screenshots, HAR files, and logs are automatically stored in Amazon S3 and CloudWatch Logs, creating a unified logging and debugging workflow. While it's a powerful solution for existing AWS users, its ops-centric UI and scripting workflow can be less intuitive than dedicated, standalone website performance monitoring tools, making it better suited for DevOps-focused teams.
Key Details & Use Cases
- Best For: DevOps teams deeply integrated with AWS who need to monitor internal and external endpoints from AWS regions.
- Standout Feature: The ability to run canaries from within a private Virtual Private Cloud (VPC), allowing you to securely test internal applications that aren't exposed to the public internet.
- Implementation Tip: Be mindful of the total cost. A canary run's price includes the AWS Lambda execution, S3 storage for artifacts, and CloudWatch Logs usage, so model your expected costs across all three services.
- Pricing: The AWS Free Tier includes 100 canary runs per month. Beyond that, pricing is pay-per-run, starting at $0.0012 per run, plus associated costs for Lambda, S3, and CloudWatch Logs.
- Website: aws.amazon.com/cloudwatch/pricing/
| Pros | Cons |
|---|---|
| Deep AWS Integration: Seamlessly connects with S3, CloudWatch Logs, and Lambda. | Complex Costing: Total cost must factor in multiple AWS service charges. |
| Private VPC Canaries: Ideal for testing internal, non-public endpoints. | Ops-Centric UI: The interface and workflow are less user-friendly than many non-AWS tools. |
| Fine-Grained Cost Control: Pay-per-run model offers high cost efficiency for infrequent tests. |
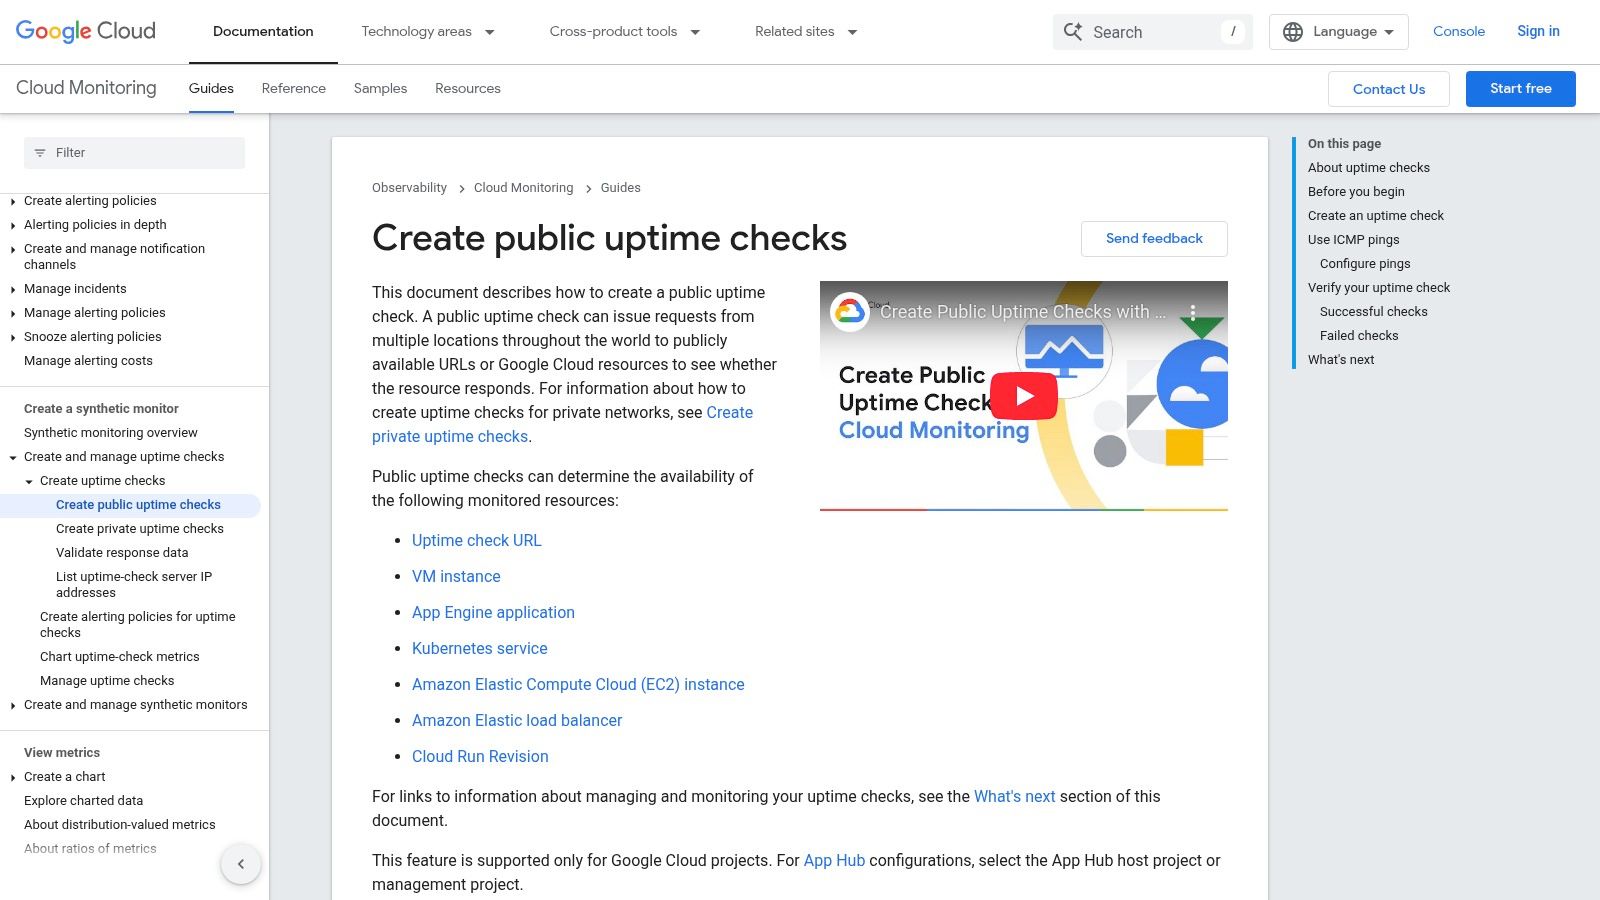
13. Google Cloud (Cloud Monitoring Uptime Checks & Synthetic Monitors)
For teams already embedded in the Google Cloud Platform (GCP) ecosystem, leveraging Cloud Monitoring's native tools is often the most direct path to website performance monitoring. Uptime Checks and the newer Synthetic Monitors provide essential availability and performance testing without the need for a third-party service. This native integration means checks can be configured to trigger alerts through Google Cloud's alerting policies and seamlessly feed data into Cloud Logging and Metrics for deeper analysis.
The primary advantage is the tight coupling with other GCP services. You can easily create SLOs based on your uptime check results, build dashboards in Cloud Monitoring that combine check latency with your backend server metrics, and automate monitor creation via its API. This makes it one of the most efficient website performance monitoring tools for organizations looking to consolidate their observability stack within Google Cloud.
Key Details & Use Cases
- Best For: Engineering and DevOps teams heavily invested in the Google Cloud Platform seeking a native, integrated monitoring solution.
- Standout Feature: The deep, native integration with Google Cloud's SLO, alerting, logging, and metrics tooling, allowing for unified observability.
- Implementation Tip: Start by configuring regional uptime checks for your critical endpoints. Use the generous free tier to establish baseline availability monitoring before exploring more complex synthetic monitors.
- Pricing: Uptime checks have a free allotment of one million executions per month. Synthetic monitors are priced per execution, and data ingestion into Cloud Logging and Monitoring may incur separate costs.
- Website: cloud.google.com/monitoring/uptime-checks
| Pros | Cons |
|---|---|
| Seamless GCP Integration: Natively connects to logging, metrics, and SLOs. | Niche Focus: Best experience is within the Google Cloud ecosystem. |
| Generous Free Tier: Significant free allotments for uptime checks. | Nuanced Pricing: Execution and data ingest costs can be complex to predict. |
| API-Driven Automation: Strong support for creating and managing checks programmatically. |
Top 13 Website Performance Monitoring Tools — Feature Comparison
| Product | Core features ✨ | Quality ★ | Price & Value 💰 | Target audience 👥 | Standout 🏆 |
|---|---|---|---|---|---|
| Swetrix 🏆 | Cookieless analytics, sessions, funnels, RUM, error tracking, API | ★★★★★ (privacy-first, intuitive) | 💰 Traffic-based, transparent; 14‑day trial; self‑host CE | 👥 Startups, growth, product teams, DevOps, agencies | ✨ 100% data ownership; open‑source CE; no data selling |
| Pulsetic | Global uptime, custom status pages, SSL/domain tracking | ★★★★☆ (design-focused) | 💰 Free tier; affordable plans from $9/mo | 👥 Startups, developers needing simple uptime tracking | ✨ Stunning UI and highly customizable status pages |
| Datadog | RUM, synthetics, browser tests, APM & logs correlation | ★★★★☆ (enterprise-grade) | 💰 Usage-based (can scale quickly) | 👥 DevOps, large teams needing end‑to‑end observability | ✨ Large integrations; tight APM/logs linkage |
| New Relic | Browser RUM + Synthetics, APM, infra, logs unified | ★★★★☆ (easy entry) | 💰 Free tier (100GB/mo); usage-based add‑ons | 👥 Teams wanting unified observability with low entry | ✨ Generous free tier; clear add‑on pricing |
| Pingdom (SolarWinds) | Uptime, page speed, transaction monitoring, RUM | ★★★☆☆ (web-focused, simple) | 💰 Configured via calculator / sales | 👥 Digital teams, SMBs wanting web monitoring | ✨ Simple onboarding; established brand |
| UptimeRobot | HTTP(S), ping, port, keyword monitors; status pages | ★★★☆☆ (availability-focused) | 💰 Generous free tier; low-cost paid plans | 👥 Startups, SMBs needing cheap uptime checks | ✨ 60s checks, easy status pages |
| Uptrends | Multi-step synthetics, 200+ locations, RUM, private checkpoints | ★★★★☆ (detailed diagnostics) | 💰 Credit/capability pricing; flexible | 👥 Front‑end teams, ops, internal app monitoring | ✨ Transaction recorder; filmstrips & waterfalls |
| GTmetrix | Lighthouse tests, waterfalls, Core Web Vitals, video capture | ★★★★☆ (page-speed clarity) | 💰 Low entry cost; paid for premium locations | 👥 Front‑end teams, non‑engineers tracking CWV | ✨ Easy CWV tracking & filmstrip videos |
| SpeedCurve | Synthetic + RUM correlation, performance budgets, filmstrips | ★★★★☆ (UX & benchmarking) | 💰 Mid-tier; best value with RUM+synth | 👥 Designers, performance & UX teams | ✨ UX-focused metrics + performance budgets |
| Catchpoint | Enterprise synthetic & RUM, backbone/last‑mile nodes, outage maps | ★★★★★ (enterprise-grade) | 💰 High-end; sales-based packages | 👥 Large customer-facing organizations | ✨ Vast node network; dependency & outage mapping |
| Dynatrace | Synthetic, APM, logs, infra with AI (Davis) RCA | ★★★★★ (AI-driven troubleshooting) | 💰 Premium pricing | 👥 Complex, distributed environments | ✨ AI root‑cause analysis & unified topology |
| AWS (CloudWatch Synthetics) | Scripted canaries, artifacts (screenshots, HAR), VPC canaries | ★★★☆☆ (ops-centric) | 💰 Pay‑per‑run; 100 free runs/mo + infra costs | 👥 AWS users, infra/ops teams | ✨ Private VPC canaries; deep AWS integration |
| Google Cloud Monitoring | Uptime checks, synthetic monitors, SLOs, integrated alerts | ★★★★☆ (GCP-native) | 💰 Per-execution; free allotments; nuanced billing | 👥 GCP users, cloud reliability teams | ✨ Native GCP logging/metrics & SLO tooling |
Making the Right Choice for Your Performance Needs
Navigating the landscape of website performance monitoring tools can feel overwhelming, but the extensive list we've explored demonstrates a crucial point: there is no single "best" tool, only the best tool for your specific needs. Your choice ultimately hinges on a clear understanding of your goals, your team's technical expertise, and your budget.
Throughout this guide, we've seen a clear spectrum of solutions. On one end, you have highly specialized tools like Pingdom and GTmetrix, which excel at synthetic monitoring and page-speed analysis. They provide critical, actionable data for marketing teams and developers focused purely on uptime and front-end optimization. On the other end, comprehensive observability platforms like Datadog, New Relic, and Dynatrace offer an all-encompassing view, connecting user-facing performance issues directly to back-end infrastructure, logs, and application traces. These are powerhouse solutions designed for complex, distributed systems where end-to-end visibility is non-negotiable.
How to Select Your Ideal Tool
To narrow down your options, start by answering three foundational questions:
- What is my primary goal? Are you trying to guarantee availability (uptime), improve user-perceived speed (Core Web Vitals), or diagnose deep-seated application issues? A tool like UptimeRobot is perfect for the first, SpeedCurve for the second, and Catchpoint for the third.
- Who is the end user? If your marketing team needs simple, shareable reports on page load times, a user-friendly interface is key. If your DevOps team needs to build custom dashboards and integrate alerts into their CI/CD pipeline, a tool with a robust API and extensive integrations like those offered by AWS or Google Cloud is essential.
- What is our "single source of truth"? For many modern teams, especially startups and indie makers, consolidating tools is a strategic advantage. Instead of juggling separate platforms for analytics and performance, an integrated solution provides a unified view of the user journey. A tool like Swetrix bridges this gap, offering privacy-first web analytics alongside crucial performance metrics, allowing you to see how site speed directly impacts user behavior and conversion funnels.
Implementation and Final Considerations
Once you've shortlisted a few candidates, consider the implementation overhead. How easy is it to deploy the monitoring agent? Does it require significant developer resources? A simple JavaScript snippet is far easier to manage than a full server-side agent installation.
Ultimately, the most effective website performance monitoring tools are the ones that transform data into action. They don’t just tell you that your site is slow; they show you why it's slow and provide the context needed to prioritize fixes. By starting with your core objectives and matching them to the unique strengths of the tools we've covered, you can confidently select a solution that empowers your team to build faster, more reliable digital experiences for your users.
Ready to see how performance metrics and user analytics can work together? Swetrix provides a lightweight, privacy-focused solution that combines powerful web analytics with essential performance monitoring. Understand your users and your website's speed in one intuitive dashboard. Start your free trial at Swetrix today.