- Date
500 Internal Server Error: Causes and Fixes
 Andrii Romasiun
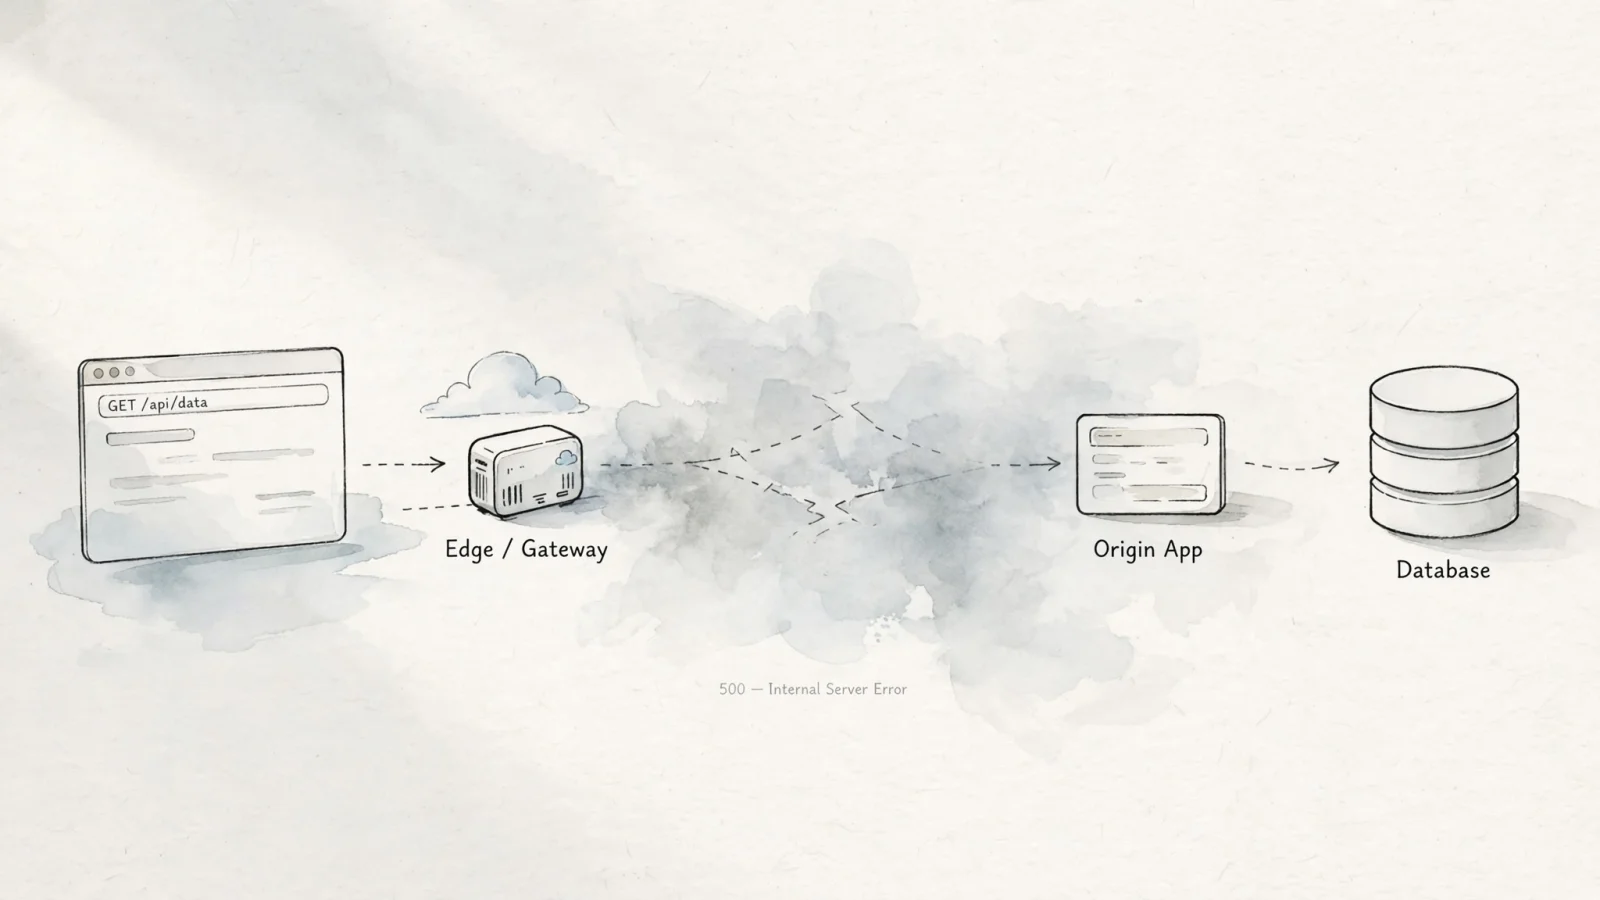
The IETF explains in RFC 9110 that HTTP presents a uniform interface that hides how a service is implemented. Since the protocol does not define what happens behind that interface, finding the cause of a status 500 requires further investigation.
A generic response serves a security purpose: exposing a detailed stack trace or database query to a public browser would give attackers a map of the backend infrastructure. The server can return a standardized status code without exposing those details.
Encountering a status 500 error while browsing is an interruption that visitors cannot fix directly. Website managers investigate the server logs to find the root cause. Platforms like Swetrix help identify how the resulting downtime affected user journeys and conversion funnels, yet fixing the broken hardware or code always requires access to the backend environment.
Common Causes of a 500 Error
The response code groups several underlying problems into a single category. MDN Web Docs lists possible causes, including improper server configuration, out-of-memory issues, unhandled exceptions, and improper file permissions. So finding the culprit requires investigation by the server owner or administrator.
An unhandled application exception or a recent code change frequently triggers this response. When a script encounters a scenario it cannot process, such as dividing by zero or parsing a malformed JSON payload, the request fails unexpectedly, and the server returns a 500 response to the browser.
Incorrect server configuration or file permissions will also block requests. If the user account running the web server lacks permission to execute a required PHP file or read an environment variable, execution stops before the application starts. A single syntax error in an Apache .htaccess file, such as a missing bracket, immediately breaks every route in that directory.
Resource limits produce a similar outcome. An application trying to process a massive image upload might exceed its allocated RAM, causing a fatal out-of-memory exception that the web server translates into a 500 status.
A database connection failure stops any dynamic application from loading content. The application requests data, fails to connect to the database host, and crashes because it cannot render the page without that information. This often happens during traffic spikes when a database reaches its maximum connection pool limit and refuses new requests.
Plugins and edge services add layers of complexity. Content management systems rely on dozens of third-party extensions, meaning an update to one plugin might conflict with a function in the active theme and bring down the entire site. Similarly, a Cloudflare support guide says a runtime JavaScript exception thrown by a Cloudflare Worker can cause a 500 response, and a Page Rules configuration issue can also generate one. The guide recommends reviewing recent changes to Page Rules, Transform Rules, or Workers that could affect request processing.

What to Do When You Encounter a 500 Error
When a website returns a server error, wait a few minutes and try loading the page once more. The problem might stem from a momentary resource spike, a deployment in progress, or a brief container restart that resolves itself quickly. If the failure persists, report the exact URL and the approximate time to the site owner or the hosting provider.
Exercise caution when the error interrupts a state-changing action. Submitting a payment, booking a reservation, or creating an account alters data on the server. If the application crashes after charging a credit card but before rendering the confirmation page, refreshing the browser might submit the transaction a second time. The IETF cautions against automatically retrying non-idempotent requests unless you confirm the original action failed. Check your email for a receipt or review your bank statement before resubmitting the form.
Changing browser settings, clearing the local cache, or modifying device DNS will not resolve a 500 response. The server generates this code to announce its own failure, leaving the responsibility for fixing it entirely with the website administrator.
How Site Owners Can Troubleshoot a 500 Error
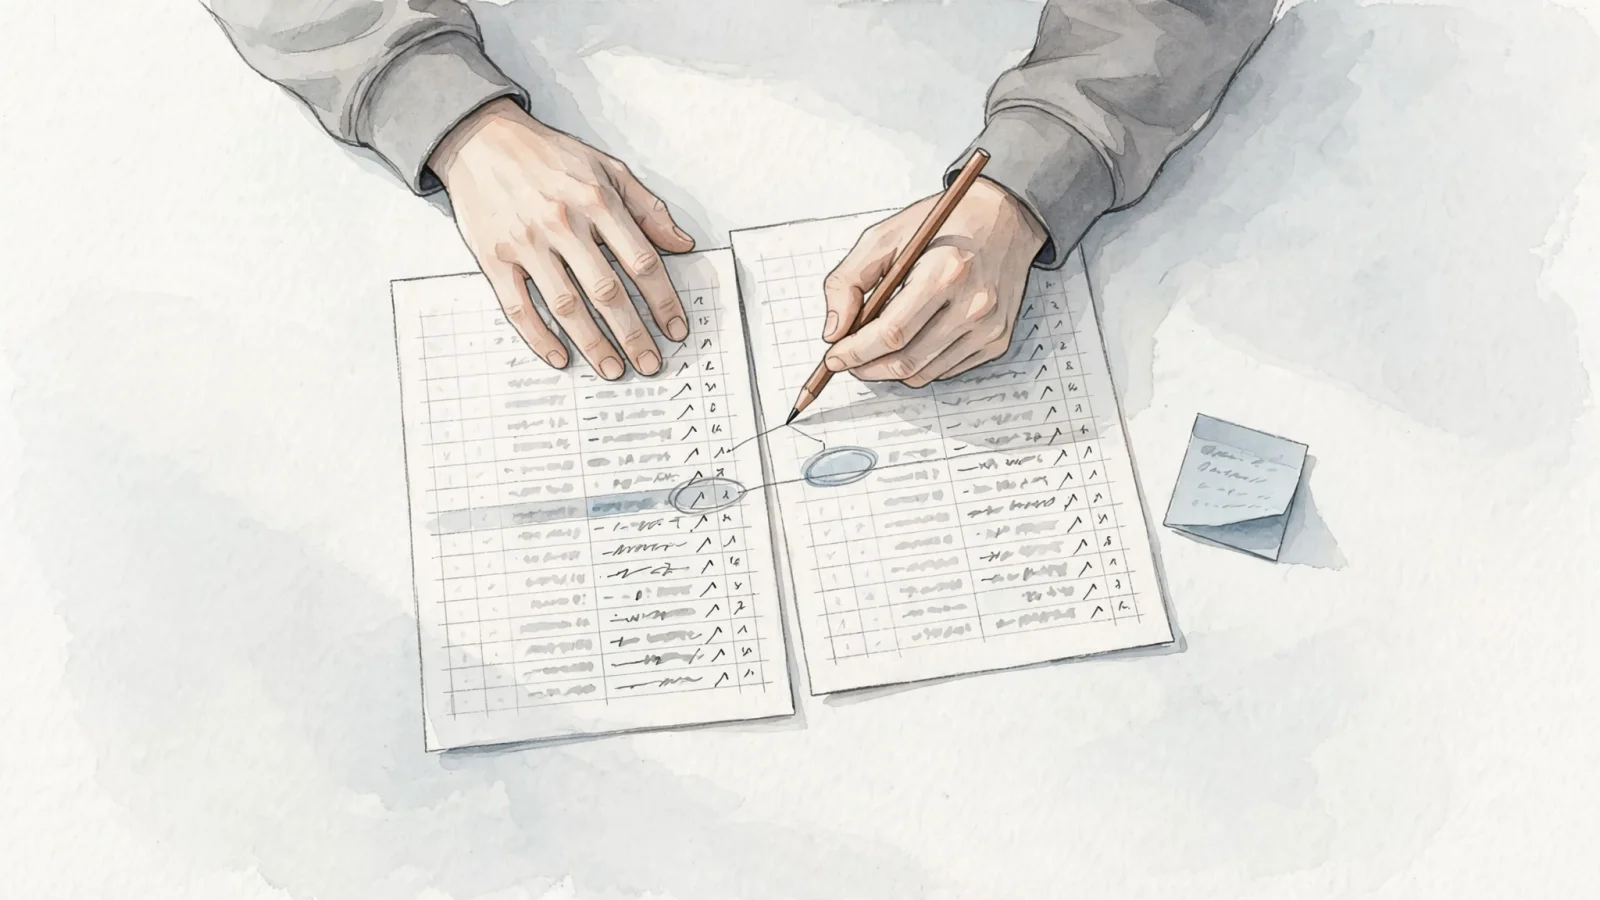
Investigating a server-side crash requires a systematic approach to eliminate variables. Use this ordered checklist to trace the failure back to its source.
Record the exact URL that failed and the HTTP method used to reach it.
A GET request to a blog post might work perfectly, while a POST request to a contact form on the same domain returns a 500. Document the time of the failure, whether it affects the entire site or a single route, and if it impacts all visitors or a specific user account. Preserve any request ID or error ID displayed on the screen, as these identifiers map directly to trace logs.Match the failed request to your backend logs.
Read the web server logs, such as/var/log/nginx/error.logor/var/log/apache2/error_log, to find the exact moment the response was sent. Next, check the application logs, database error logs, and hosting control panel for stack traces recorded at that exact timestamp. The stack trace usually points directly to the failing function, the missing file, or the rejected database query.Review recent deployments and configuration changes. A system that worked yesterday and fails today usually experienced a change. Review recent deployments, environment variable updates, and configuration adjustments. Check file permissions on newly uploaded directories. Verify that database credentials remain valid and that the host accepts connections. Running URLs through a bulk HTTP status checker helps determine if a recent migration broke an entire category of pages.
Inspect the edge layer and CDN. Traffic passing through a content delivery network or a reverse proxy requires checking that layer as well. Review recent changes to firewall rules, caching policies, or edge worker scripts, and verify that the CDN can connect to the origin server. Major providers maintain logging dashboards that indicate whether the proxy generated the error or forwarded it from the origin.
Make a targeted change and verify the user flow. Apply one fix at a time. Suspecting a memory limit issue means increasing the limit and immediately retesting the failing URL. Changing five different settings at once obscures which adjustment resolved the problem. Once the page loads, test important actions like submitting a form or completing a checkout to guarantee the workflow functions correctly.
Administrators face specific diagnostic challenges in ecosystems like WordPress. Using a staging environment or restoring a working backup is safer than attempting live fixes. Common investigation paths include renaming the .htaccess file to test whether its rewrite rules are causing the error, then regenerating the default rules, disabling plugins one by one, switching to a default theme, and increasing the PHP memory limit in wp-config.php. Always configure content management systems to log errors to a secure file without displaying technical stack traces to public visitors.
Bloggers and creators lacking access to server logs can contact their hosting provider directly, providing the failing URL and the exact time the error occurred.
How 500 Differs From 502, 503, and 504
The 5xx block of status codes covers various server-side failures. Each code points an administrator toward a different part of the infrastructure. The definitions below follow the IETF specifications.
| Status | Meaning | Investigation Clue |
|---|---|---|
| 500 Internal Server Error | The server encountered an unexpected condition and could not fulfill the request. | A generic failure. Inspect application and server logs to find the cause. |
| 502 Bad Gateway | A gateway or proxy received an invalid response from an upstream server. | Investigate the connection and formatting between the proxy and the upstream service. |
| 503 Service Unavailable | The server is temporarily unable to handle the request, often due to overload or maintenance. | Check for resource exhaustion or scheduled downtime. The response may include a Retry-After header. |
| 504 Gateway Timeout | A gateway or proxy did not receive a timely response from an upstream server. | Check the upstream service for slow database queries, unresponsive processes, or network delays. |
While a 502 indicates a breakdown in communication between two servers, a status 500 error implies a crash or unhandled state within the server processing the request. A 503 status applies only when temporary unavailability accurately describes the situation. Avoid configuring a server to return a 500 during scheduled maintenance, and avoid swapping codes arbitrarily as an SEO workaround.
SEO Impact of Server Errors
For Google, server availability affects crawling. Google Search Central's crawling documentation says Googlebot scales back its crawling if it detects that servers are having trouble responding to crawl requests, and that availability issues can prevent Google from crawling as much as it might want.
Google ignores any content returned alongside a 5xx status. If a URL persistently fails over several days, Google eventually drops it from the index entirely, assuming the page no longer exists.
To investigate indexing issues, site owners can review the Crawl Stats report in Search Console. This report highlights sudden spikes in server connectivity problems, grouping them under a general server error category. The URL Inspection Tool also provides a way to test how Googlebot experiences a specific page.
Configure servers properly rather than returning a 200 OK status for a page that displays an error message. The Search Central documentation warns that this practice creates a soft 404. The crawler reads the successful status code, indexes the error text as if it were actual page content, and damages the site's search presence. Once the underlying problem is resolved and the server returns successful responses again, the crawl rate gradually recovers.
Measuring the Impact on Visitors
Server logs explain why a component crashed, but they rarely capture how the failure affected the business. Swetrix bridges the gap between privacy compliance and product analytics by measuring the visitor impact of a service interruption.
Separating user-impact measurement from server-side diagnosis provides clearer insights. If an error takes down a high-traffic landing page, traffic and campaign analytics show the immediate drop in active sessions and the corresponding gap in conversion funnels. This behavioral context allows marketing teams and agencies to report on customer-facing impact independently from the engineering team's diagnostic work. B2B companies offering web analytics to end users can integrate dashboards into their admin panels, allowing clients to see traffic drops directly correlated to downtime events without accessing raw server logs.
Swetrix provides error tracking capabilities through the trackErrors() function, capturing client-side JavaScript exceptions and providing breakdowns of affected browsers and pages. This monitors the browser environment, acting as a complement to backend logs rather than an automatic server-side 500 monitor.
When configured, session replays add context by showing exactly what a visitor did before the site broke. These recordings begin only after the website explicitly calls startSessionReplay().
A hard 500 response might prevent the page's HTML from loading entirely. If the browser never receives the page, the tracking script never executes, and the failed request will not appear in client-side analytics. Comparing analytics dashboards with server logs or uptime monitoring tools remains necessary to get a complete picture of the incident.
Understand how server downtime and technical errors affect your visitors without violating their privacy. Try Swetrix for cookieless, GDPR-compliant analytics that deliver the conversion funnels, event tracking, and session replays needed to monitor site performance.