- Date
Server-Side Performance Monitoring for Faster Websites
 Andrii Romasiun
You open a link and wait while the browser stalls on a blank screen. The frontend code cannot render a layout or process interactions because it has not received the underlying document. Measuring that initial delay requires server side performance monitoring, which helps you pinpoint why a backend struggles to assemble a response by tracking latency, errors, and resource pressure.
We built Swetrix to capture this timing data from real visitors without relying on tracking cookies. Switching to a privacy-first platform still lets you connect technical bottlenecks directly to traffic drop-offs, user frustration, and lost conversions.
Differentiating Observability, RUM, and Event Tracking
Server side performance monitoring measures how quickly and reliably backend systems handle requests, encompassing latency, throughput, error rates, and the speed of underlying databases or external APIs.
Many teams conflate three overlapping practices within this discipline. Application performance monitoring (APM) and distributed tracing handle internal observability by watching service-to-service calls, database queries, and container infrastructure. Real-user performance monitoring (RUM) captures the actual timings real visitors experience from the moment they initiate navigation. Finally, server-side tracking transmits pageviews, custom events, or error logs directly from a backend environment rather than relying on a browser script.
Swetrix operates primarily as a privacy-first platform for real-user performance monitoring, reporting user-facing metrics that include page load time, Time to First Byte (TTFB), DNS resolution, TLS negotiation, and DOM timings. Separately, you can deploy our Node and Express integration for server-side event collection. This backend tracking preserves analytics data when browser scripts fail, though it does not replace the host-level distributed tracing provided by APM tools. You can pair our user-facing metrics with APM to bridge the gap between a slow visitor experience and its internal root cause.
Connecting Latency to UX, Conversions, and SEO
Technical latency dictates user outcomes because a slow response delays HTML delivery. Every later loading phase waits in line, from downloading stylesheets to executing interactive JavaScript. These compounding delays create friction across content consumption, signup forms, and product workflows.
Speed and availability measure different dimensions of reliability. A web server returning a heavily cached error page in fifty milliseconds responds fast while still delivering a failed experience. Your monitoring must capture both HTTP error rates and successful response times to provide a complete picture of backend health.
Search engines evaluate server efficiency during their crawling process, and faster responses help crawl bots process a site more effectively. When a server struggles to respond, crawlers often reduce their request rate to avoid overwhelming the host infrastructure. Monitoring response times supports your broader technical SEO strategy by helping you isolate crawl failures and identify zombie pages, though reducing latency provides no automatic guarantee of higher rankings.
Google provides practical guidelines for response timings, stating that a TTFB of 0.8 seconds or less is a good value for most sites, while values exceeding 1.8 seconds are considered poor. Because Google describes these figures as a rough guide for most sites, treat them as benchmarks rather than universal rules, and judge each endpoint against a route-specific baseline.
Mapping the Path from Redirect to Interaction
Understanding performance requires visualizing the request lifecycle defined by the W3C Navigation Timing specification. The specification exposes timing data for stages such as redirects, DNS lookup, connection setup, the request, and the response, as well as document milestones including DOM interactivity, DOMContentLoaded, and load events. Use those measurements to distinguish network and response timing from document-processing milestones.
TTFB measures the duration from navigation start until the first response byte begins arriving, which includes the network setup phases rather than backend processing alone. A high TTFB might indicate a slow database query, but it could also stem from a sluggish DNS resolver or geographical distance between the visitor and the edge server.
Contrasting different timings prevents misdiagnosis. A page might achieve an excellent TTFB while displaying a poor Largest Contentful Paint (LCP) because it loads massive background images. Another route might show fast response and rendering times but suffer from a poor Interaction to Next Paint (INP) if heavy JavaScript execution blocks the main thread. High latency concentrated among visitors in one country often points to network routing or missing edge caching rather than unoptimized application code, so monitoring the entire sequence ensures you apply optimizations to the correct layer of the stack.
Isolating Network, Response, and Browser Delays
Organize your dashboards around specific diagnostic questions. TTFB answers whether the initial response arrives quickly, while DNS, TLS, and connection times reveal whether the delay happens before the application even receives the request. Response times indicate whether the server is slow to produce the payload, while download times indicate whether the payload itself is too large or lacks compression, and render and DOM load times highlight browser-side delays.
Track HTTP errors and timeouts alongside latency. Requests that time out or return 500-level status codes represent broken experiences, regardless of how fast the remaining traffic flows. You can validate endpoint responses systematically with an HTTP status bulk checker to catch widespread outages.
Monitor Core Web Vitals to understand loading, responsiveness, and layout stability. LCP should occur within 2.5 seconds, INP should remain below 200 milliseconds, and Cumulative Layout Shift (CLS) should stay under 0.1. These metrics describe the user experience after the response begins arriving, complementing server-health signals rather than replacing them.
Rely on percentiles instead of averages. The p50 (median) shows typical performance, while the p75, p95, and p99 expose the slow tail of visitors experiencing severe delays. An average hides five-second load times if enough cached requests pull the mathematical mean down. Break these percentiles down by specific segments, grouping performance data by route, country, browser, device type, and traffic source to isolate the precise conditions causing the slowdown.
Pay attention to units when extracting data from different systems. Our platform records raw timing fields in milliseconds through the Events API reference, whereas aggregated reporting endpoints deliver chart values in seconds according to the Statistics API reference. Verify these units when migrating data into custom administrative panels or data warehouses.
Choosing the Right Diagnostic Layer
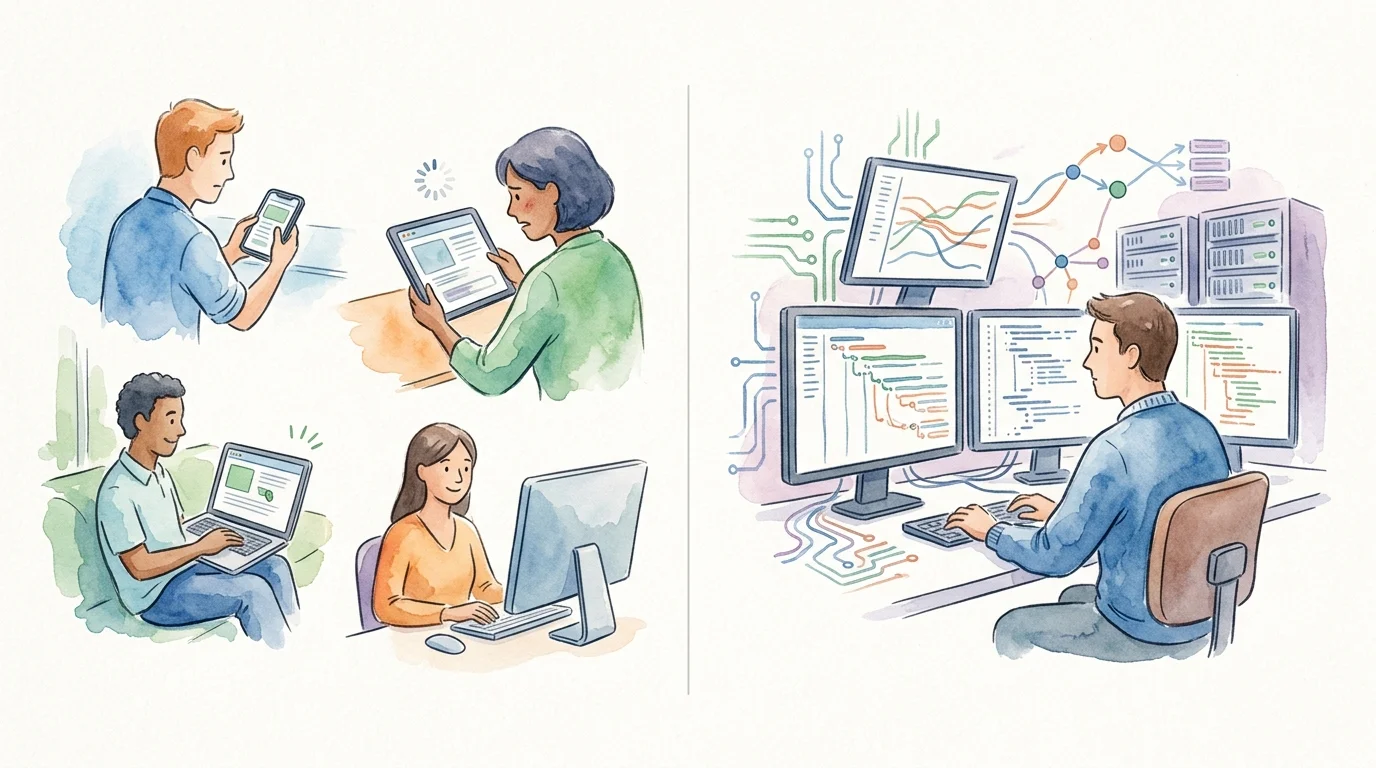
Different monitoring methods answer different questions, and a resilient strategy combines multiple approaches to detect and diagnose slow pages.
| Monitoring Method | The Question It Answers | Primary Strength | Known Limitation |
|---|---|---|---|
| Real-User Monitoring (RUM) | How fast is the site for real visitors? | Captures actual devices, browsers, geographic locations, and network conditions. | Rarely reveals the exact internal code path or database query causing a delay. |
| Synthetic Testing | Does the page perform under a controlled condition? | Useful for release checks, deployment validation, and stable period-over-period comparisons. | Cannot represent the varying constraints of real-world visitor environments. |
| Application Performance Monitoring (APM) | Which backend component, service, or database is slow? | Provides deep root-cause detail and structural traces for complex architectures. | Requires extensive infrastructure instrumentation and heavier technical setup. |
Field data and lab data serve different functions. RUM acts as the field data layer, exposing exactly where real users encounter friction, while synthetic tests operate as lab data to ensure a new code release meets baseline expectations before it reaches production.
When a slow route needs an internal explanation, distributed tracing can help. Using OpenTelemetry concepts, you can track an individual request across an API gateway, a backend service, and a database. Together, these spans form a distributed trace that shows the request's path through multiple services. Use server telemetry or tracing tools to investigate the operations involved.
Instrumenting Routes and Tracing Bottlenecks
Start by selecting high-value routes like organic landing pages, pricing grids, signup flows, checkout screens, and heavily used authenticated product dashboards.
Collect real-user timings and inspect the percentiles, comparing performance before and after deployments, content management system updates, or hosting migrations. Segment any slow experiences by page, country, and device to determine the scope of the problem.
Reproduce suspicious routes with browser developer tools or synthetic tests. To connect the frontend delay to backend phases, you can add server timing values to your HTTP responses, which exposes backend duration metrics directly to the browser. Exercise caution with this approach. Implementing a Server-Timing header can inadvertently reveal sensitive application logic or infrastructure details to the public, so restrict these headers to safe, aggregated timings or protect them with appropriate cross-origin policies.
Improve data resilience by instrumenting your backend directly. Our server-side Express.js SDK transmits pageviews, custom events, and errors even when browser JavaScript is disabled or ad blockers interfere. Send these tracking payloads asynchronously to prevent them from blocking the primary HTTP response. This server-side integration captures business events well, though it does not replace the browser’s ability to measure DNS, TLS, rendering, or DOM construction timings.
Tie technical performance directly to business outcomes by comparing the segments experiencing slow load times against custom events, conversion funnels, and revenue metrics. A two-second latency increase on a checkout route typically correlates with an immediate drop in completed purchases. Validate every applied fix using real-user percentiles to ensure the improvement reaches your visitors instead of only looking better in a local lab test.
Exposing this data builds trust for agencies and business-to-business platforms. You can embed specific performance tabs directly into client reporting portals, sharing geographic and device-level latency breakdowns without exposing unrelated administrative settings.
Clarifying TTFB, Cookies, and Ranking Impact
TTFB is a Prerequisite, Not a Core Web Vital
The current Core Web Vitals are LCP, INP, and CLS. TTFB influences the beginning of the loading process, making it a prerequisite for good Core Web Vitals, but it is not a direct ranking metric itself.
Monitoring Performance Without Cookies
Analytics platforms can measure navigation timings, response durations, and error rates using anonymous session data. While the platform operates without cookies, you must still take care to avoid passing personally identifiable information through custom event names or request metadata.
Server-Side Tracking and SEO Rankings
Moving tracking to the server improves data collection completeness and reduces browser execution overhead by removing third-party client scripts. Faster responses help crawl efficiency, but search engines evaluate thousands of signals. Optimization improves the user experience; it does not force search engines to rank your content higher.
Balancing Backend Tracking and Browser Monitoring
Backend tracking ensures reliable event collection when browser scripts fail. However, a server cannot measure how long a browser takes to resolve DNS, establish a connection, download background images, or render the DOM. A complete observability strategy requires both backend event tracking and frontend performance monitoring.
See how your website performs for real visitors. Monitor TTFB, page load time, DNS, TLS, and other timing signals in Swetrix, then connect slow pages to traffic, events, funnels, and errors without relying on cookies. Build a resilient tracking setup today at Swetrix.