- Date
Self Serve Analytics Your Complete Guide to Empowering Teams
 Andrii Romasiun
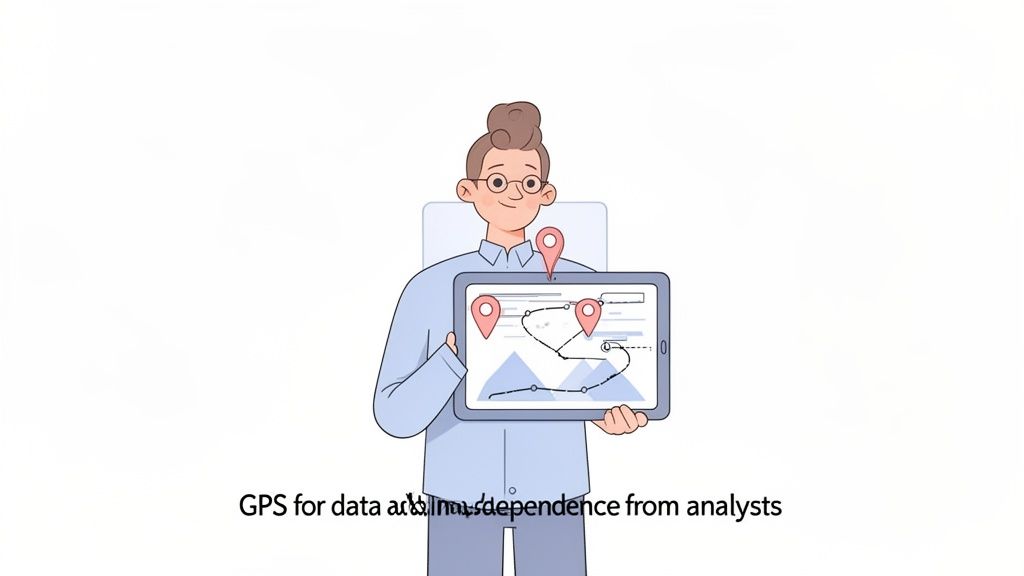
Think of it this way: what if you gave your team a GPS for your business data, instead of making them wait for a chauffeur to tell them where to go? That’s the heart of self-serve analytics. It's an approach that lets non-technical folks in marketing, product, and sales dive into the data and find their own answers, without having to get in line for help from an analyst.
This simple shift turns data from a guarded resource into a practical, everyday tool for everyone.
Why Self-Serve Analytics Is A Game-Changer
For decades, business intelligence (BI) worked like a stuffy, old-school restaurant. If you needed a report on last quarter's customer churn, you'd place an order with the "chefs"—the data analysts and engineers. Then, you'd wait. Sometimes for days, sometimes for weeks.
That old model creates a massive bottleneck. While the data team is drowning in a long queue of requests, the business teams are stuck in neutral, unable to make fast, informed decisions. By the time they get a simple answer, the opportunity might have already passed.
Self-serve analytics completely flips this dynamic. It’s more like a well-stocked, high-end buffet. The data team still prepares all the "dishes" (meaning, they create curated, reliable datasets), but now everyone else—marketers, product managers, sales leaders—can walk up, see what's available, and serve themselves the exact insights they need, right when they need them.
From Gatekeepers To Enablers
This approach totally redefines the data team's role. They stop being gatekeepers bogged down with "quick data pulls" and become enablers instead. Their job shifts from writing one-off queries to building a solid, intuitive analytics system that anyone can use with confidence. This frees them up to tackle much more strategic work, like predictive modeling or deep-dive investigations that truly move the needle.
And this isn't just a niche trend; it’s a full-blown market shift. The global self-service analytics market was valued at USD 6.2 billion and is expected to balloon to USD 23 billion by 2034. That explosive growth shows just how hungry businesses are for tools that help them turn raw website data into actionable strategy, without being totally dependent on IT.
A Quick Comparison
To see the difference clearly, let's put the old and new models side-by-side.
| Aspect | Traditional BI | Self-Serve Analytics |
|---|---|---|
| Who Answers Questions? | Data analysts, IT team | Business users (marketing, product, etc.) |
| Speed to Insight | Slow (days or weeks) | Fast (minutes or hours) |
| Data Team's Role | Gatekeeper, report builder | Enabler, system architect |
| User Experience | Complex, requires technical skills | Intuitive, designed for non-tech users |
| Decision-Making | Centralized, slow | Decentralized, agile |
| Culture | Data is a specialized report | Data is an everyday tool |
This table really highlights how self-serve is all about putting power directly into the hands of the people who need it most.
The Real-World Benefits
Adopting a self-serve analytics model brings some immediate, powerful advantages that help create a more agile and data-savvy organization.
- Blazing Speed and Agility: No more waiting. A marketing manager can check campaign performance on the fly, and a product manager can track feature adoption in real time.
- No More Analyst Bottlenecks: It frees up your data team from the constant grind of repetitive reporting, letting them focus on high-impact projects.
- Empowered and Engaged Teams: When people can answer their own questions, they gain a much deeper understanding of the business and become more invested in the results.
- A True Data-Driven Culture: Widespread access to data sparks curiosity and encourages experimentation. It makes data less of a formal report and more of a daily conversation partner.
At its core, self-serve analytics is about democratizing data. It’s a critical part of modern web analytics, helping companies move beyond just asking "what happened?" to independently exploring "why did it happen?" and, most importantly, "what should we do next?"
Unlocking The Benefits And Avoiding The Pitfalls
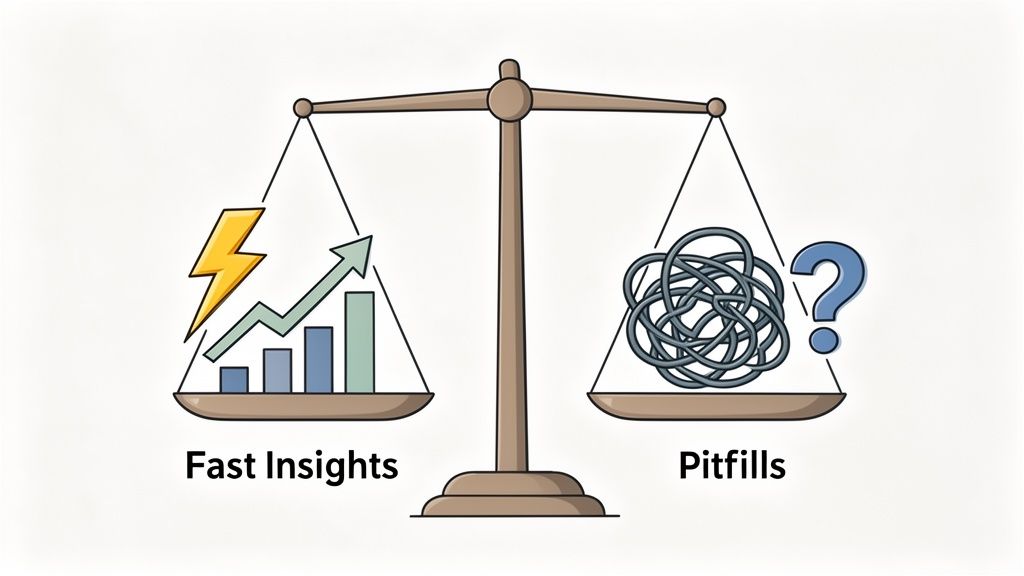
Handing self-serve analytics tools to your teams can feel like you've suddenly given them a superpower. Suddenly, insights are generated in minutes, not weeks. The constant back-and-forth with overworked data teams disappears. The people who need the data most—the ones on the front lines—finally have it at their fingertips.
Think about it. A marketing manager can check a campaign's ROI on the fly without ever opening a support ticket. A product lead can dig into feature adoption metrics in real-time to shape the very next development sprint. That's the kind of agility self-serve analytics promises.
But as with any superpower, there’s a catch. Without a solid game plan, this new freedom can quietly sow chaos, leading to some serious unintended consequences down the road.
The Clear Advantages Of Self Serve Analytics
First and foremost, you get speed. Business doesn't wait, and getting a report back in a week is often too late to matter. Self-serve models completely crush that timeline, letting your teams react to market shifts or customer feedback almost instantly.
But it goes deeper than that. This approach naturally boosts data literacy and team empowerment. When people start pulling their own data, they begin to truly understand what drives the business. This sense of ownership sparks curiosity and accountability, shifting teams from being passive report readers to active, strategic problem-solvers.
And let's not forget your data specialists. By clearing out the endless queue of routine report requests, your analysts and data engineers are freed up to tackle the heavy-hitting projects: predictive modeling, deep-dive investigations, and building the rock-solid data infrastructure everyone relies on.
Self-service analytics isn't just a technical shift; it's a cultural one. The goal is to evolve your data team's role from a service desk that fulfills requests to a strategic partner that enables the entire company to make smarter decisions.
Navigating The Common Pitfalls
Of course, just dropping a powerful tool in everyone's lap and walking away is a recipe for disaster. The single biggest risk is the rise of inconsistent metrics and conflicting truths. One team’s definition of an "active user" or "customer churn" might be slightly different from another's. Before you know it, you’re in a meeting where two departments present completely different numbers for the same thing, and trust in the data evaporates.
Another major landmine is misinterpretation. Someone might pull the right numbers but, without the right statistical know-how or business context, draw all the wrong conclusions. This leads to bad decisions backed by what looks like good data—which is often far more dangerous than having no data at all.
This is a real tightrope for small and medium enterprises (SMEs), which are now the fastest-growing group adopting these tools. While they're slashing analysis time by 75% and letting UX researchers get instant feedback, they're also facing a new set of challenges. A big driver for this trend is that 65% of small businesses used to steer clear of analytics because it was just too complex. But as more jump in, the need for guardrails becomes critical. You can dig into the full research on the SME adoption trend from Grand View Research.
Striking The Right Balance
To make self-serve analytics work, you have to find that sweet spot between empowerment and governance. It means being proactive and setting up guardrails before things go off the rails. A successful program is all about maintaining a delicate equilibrium.
To build a strategy that gives you all the upside while avoiding the traps, you need to focus on a few key pillars:
- Standardized Data Models: Build a "single source of truth." This means creating clean, certified datasets with metrics that everyone agrees on.
- Comprehensive Training: Don't just teach people which buttons to click. Your training needs to cover data literacy basics, how key metrics are defined, and the common biases that can trip up an analysis.
- Clear Governance Rules: Set clear guidelines for who can see what data and who is responsible for creating and maintaining the official dashboards.
- A Collaborative Culture: Create a space where people feel comfortable sharing their findings and asking for a second opinion. Encourage your data analysts to act as coaches, helping business users check their work and validate their conclusions.
By building on this foundation, you can transform self-serve analytics from a potential source of confusion into a powerful engine for real growth and innovation.
Creating Your Framework For Data Governance
Simply handing over a powerful self-serve analytics tool without a plan is like dumping thousands of books onto the floor of a new library and expecting people to find what they need. It creates chaos, not clarity. True success with self-serve analytics hinges entirely on a solid data governance framework—the essential shelving, catalog system, and rules that make information both accessible and trustworthy.
This framework isn't about locking data down; it’s about building the confidence your teams need to explore it on their own. It ensures that when a marketer and a product manager both look at "user engagement," they’re seeing the exact same, agreed-upon metric. Without this, you get a "data wild west," where conflicting numbers kill trust and lead to flat-out bad decisions.
Establish Your Single Source Of Truth
The cornerstone of any good governance strategy is the single source of truth (SSoT). This is just a practical way of saying you have one centralized, official set of data models and metrics that everyone in the company agrees to use. It becomes the official dictionary for your business data.
Think of it this way: instead of every team calculating "customer lifetime value" on their own, your data team defines it once, in one place. That definition then powers every dashboard and report. This simple step prevents that all-too-common meeting where executives show up with three different versions of the same KPI, grinding the whole conversation to a halt.
Building an SSoT involves a few key steps:
- Identify Core Metrics: Sit down with business leaders and define the handful of key performance indicators (KPIs) that actually matter to the company's success.
- Centralize Data Logic: Use your analytics platform to build certified, reusable data models. This makes sure calculations are consistent everywhere they appear.
- Create a Data Dictionary: Write down what each metric means, how it's calculated, and where the data comes from. Transparency is the bedrock of trust.
A common pitfall is dashboard fatigue, where companies have thousands of reports collecting dust because no one trusts the numbers. A single source of truth is the cure, ensuring consistency and reliability across the board.
Define Roles And Responsibilities
Just like a library needs librarians, your self-serve analytics program needs people with clearly defined roles. Knowing who is responsible for what prevents chaos and makes sure someone is accountable. This structure also clarifies how data gets from its raw form to a polished dashboard.
Key roles in a governance framework usually include:
- Data Stewards: These are the subject matter experts embedded in different business units—like a senior marketer who owns marketing data. They are responsible for defining and maintaining the quality of data in their domain.
- Data Owners: These are typically senior leaders who have the final say and accountability for a specific data domain, like the CMO for all customer marketing data. For a deeper dive, our guide on what is data ownership provides a comprehensive overview of these crucial roles.
- Data Consumers: These are your end-users across the company—the people you're empowering to use the tools and answer their own questions.
This structure spreads the responsibility around, shifting data governance from a siloed IT function to a shared, company-wide commitment.
Implement Access Controls And Permissions
Not everyone in your organization needs access to every piece of data. A marketing intern probably shouldn't be looking at sensitive financial projections or employee salary information. Implementing granular access controls is a non-negotiable part of a responsible governance framework.
This means creating user groups based on roles or departments and assigning specific permissions to each. For example, the sales team might get full access to CRM data but only see summarized views of product usage data. This tiered access ensures you can democratize data safely, protecting sensitive information while still giving teams the insights they need to do their jobs.
Ultimately, a strong governance framework transforms your self-serve analytics platform from a potentially chaotic tool into a reliable, well-organized resource. It’s the invisible architecture that supports confident, data-driven decisions at every level of the business.
Your Phased Roadmap To Implementation
Jumping into a self-serve analytics program can feel like a massive undertaking, but it doesn't have to be. The secret is to sidestep the "big bang" launch that inevitably overwhelms everyone. Instead, think of it as a methodical rollout, broken down into manageable phases.
This approach turns a giant initiative into a series of small, achievable wins. You start small, prove the concept's value, and then thoughtfully expand. It's less about building a skyscraper overnight and more about pouring a solid foundation, then adding floors one by one as your organization is ready.
Here’s a practical, phased roadmap to guide you.
Phase 1: Start With A Pilot Program
First things first: test the waters. Don't try to boil the ocean by giving every team access right away. Your best bet is to pick a single, motivated team and a very specific business problem they're trying to solve.
For instance, you could team up with your marketing department. Give them the power to track campaign performance on their own, without waiting on the data team. Their goal is crystal clear: figure out which channels are bringing in the best leads. This tight focus makes success easy to measure and creates a powerful success story you can share across the company.
The pilot phase is all about:
- Identifying a clear business question that self-service tools can actually answer.
- Choosing an enthusiastic team that's excited to experiment and willing to give honest feedback.
- Setting specific, measurable goals to prove whether the pilot worked or not.
A successful pilot doesn't just provide data; it creates internal champions who will help you build momentum for the next phase.
Phase 2: Build The Foundation
With a successful pilot in your back pocket, it's time to build the real infrastructure. This phase is about setting up the guardrails and technical backbone to make sure your self-serve environment is both reliable and secure. It’s where you formalize what you learned from the pilot.
A huge part of this is choosing the right tool. A platform like Swetrix, which is built with a privacy-first approach, is a great choice. It lets you empower your teams while respecting user privacy, and even gives you the option to self-host for total control over your data.
This is also when you establish your data governance model—the rules of the road for your data.
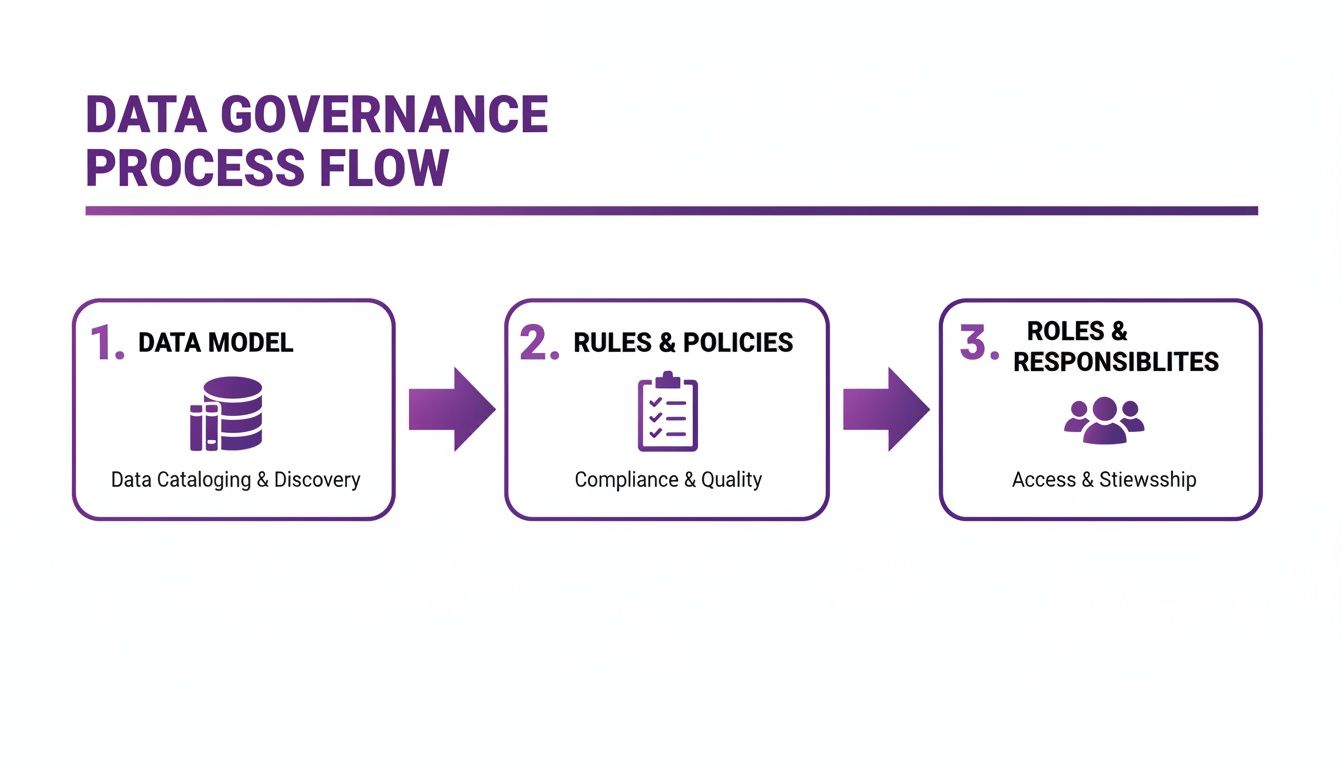
This process shows how a certified data model, clear policies, and defined roles come together to create an analytics environment that everyone can trust.
During this foundational stage, the main goal is to create a "single source of truth." You'll work with data stewards to define key business metrics and build certified datasets. This is what prevents the all-too-common data chaos, where different teams report conflicting numbers and nobody trusts the data.
Phase 3: Scale And Support
Once your foundation is rock-solid, you can start expanding the program to other departments. This rollout should be deliberate. Move from one team to the next, building on each success. Every new team will bring fresh questions and challenges, helping you fine-tune your process as you go.
But scaling is more than just flipping a switch and giving people access. It's about enabling their success with great training and ongoing support. Just handing someone a tool and walking away is a recipe for failure.
The ultimate goal of self-serve analytics is not just to provide data access, but to increase the operating leverage of your data team. A well-designed program allows a small group of data experts to support a much larger number of data consumers.
To make this happen, you need a multi-layered support system:
- Comprehensive Onboarding: Create training materials that cover the tool itself, but also data literacy basics and your company's official metric definitions.
- Community Channels: Fire up a dedicated Slack or Teams channel where people can ask questions, share what they've found, and learn from one another.
- Office Hours: Have your data team host regular office hours. This gives business users a dedicated time to get expert help with their specific analysis problems.
This continuous loop of support is what truly fosters a culture of curiosity. It’s the key to turning your self-serve analytics program into a sustainable, data-driven engine for the whole company.
To help visualize this journey, here is a quick summary of the implementation roadmap.
Self Serve Analytics Implementation Roadmap
| Phase | Key Actions | Primary Goal |
|---|---|---|
| Phase 1: Pilot Program | Select one team and a defined business problem. Set clear, measurable goals. | Prove the value of self-serve analytics with a quick, tangible win. Create internal champions. |
| Phase 2: Build the Foundation | Choose the right tool, establish a governance model, and create certified datasets. | Create a "single source of truth" and build a secure, reliable, and trustworthy data environment. |
| Phase 3: Scale and Support | Roll out to additional teams intentionally. Develop training, community channels, and office hours. | Foster widespread adoption and build a sustainable data culture through continuous enablement and support. |
Following this phased approach helps ensure you build a program that not only gets adopted but delivers real, lasting value to your organization.
Putting Self-Serve Analytics Into Practice With Swetrix
![]()
This is where the rubber meets the road. Moving from a well-thought-out strategy to real-world action is what makes a self-serve analytics program sink or swim. While your frameworks and governance models are the blueprints, a tool like Swetrix is the engine that actually gets you somewhere. It’s what turns abstract goals into tangible insights and empowers your team to ask—and answer—their own questions without ever needing to file a ticket.
Let's look at a few practical scenarios to see how different people in your organization can use a platform like Swetrix to make their own data-informed decisions. This is how self-service stops being a buzzword and becomes a daily operational habit.
A Marketer Tracks Campaign Performance in Real Time
Imagine your marketing manager just launched a major ad campaign. It’s running across multiple channels, and every link is tagged with specific UTM parameters. In the old world, they’d be stuck waiting for an analyst to pull a report, likely hours or even days later.
With a self-serve tool, that waiting game is over.
The marketer can log right into Swetrix and head straight for the campaign tracking dashboard. In a matter of clicks, they can filter all incoming traffic by UTM source, medium, or campaign name. They can see in real-time which channels are actually driving visitors, which ad copy is hitting the mark, and which landing pages are keeping people engaged.
If an ad on social media is a total dud, they'll know within hours, not days. That kind of agility means they can pull the plug on a losing ad and reallocate that budget to a winner on the fly, maximizing ROI without getting bogged down in reporting bottlenecks.
A Product Manager Builds a Feature Adoption Funnel
For a product manager, few things are more critical than understanding how users are engaging with a brand-new feature. Are people finding it? Are they using it correctly? Is it actually solving their problem? Relying on scheduled reports from a data team is just too slow for modern product development.
Using Swetrix, the product manager can create their own custom events to track the exact user actions they care about. For example, they could easily track:
- event_feature_discovered: A user clicks on the new feature's icon.
- event_feature_configured: A user customizes a setting within the feature.
- event_feature_used_successfully: A user completes the core task the feature was built for.
With these events defined, they can build a visual funnel right in the dashboard. This funnel instantly reveals where users are getting stuck or dropping off. Maybe the discovery is the problem, or perhaps the configuration process is confusing.
By building and analyzing funnels themselves, product managers get a direct, unfiltered view of the user journey. This empowers them to pinpoint friction points and confidently prioritize improvements for the next development sprint.
They can even take it a step further and set up alerts. A notification in Slack or Discord could fire every time the "successful use" metric hits a new milestone, turning passive data collection into an active, motivating feedback loop.
Complete Data Ownership With Self-Hosting
Let’s talk about data privacy and ownership—a huge piece of the modern analytics puzzle. For many companies, especially those in highly regulated fields or those who've built their brand on user privacy, shipping customer data off to a third-party cloud is simply not an option. This is where Swetrix's open-source, self-hostable design becomes a game-changer for self-serve analytics.
By choosing to self-host Swetrix, you keep every bit of your analytics data inside your own infrastructure. This gives you some serious advantages:
- Total Data Control: You own the data, and you own the server it sits on. No third party can ever access or monetize it.
- Enhanced Security: Your own security protocols and firewalls protect the data, giving your security team peace of mind.
- Compliance Confidence: It makes complying with regulations like GDPR and CCPA much simpler because you have a clear, unbroken chain of custody for all user information.
This level of control is fundamental. For companies that truly care about privacy, it's critical to understand the benefits of a self-hosted analytics solution. It ensures that your push to democratize data internally doesn't come at the cost of compromising user trust externally. This approach creates a responsible, effective, and privacy-first self-serve analytics program.
Fostering a Culture of Data-Driven Decisions
Rolling out a great self-serve analytics platform is a huge step, but let's be clear: it's the beginning, not the end. The real goal isn't just handing over a new piece of software. It’s about fundamentally changing how your entire organization thinks, operates, and makes decisions.
Success isn’t measured by how many dashboards get built. It’s measured by how often people turn to data to make a better call—one that actually moves the needle for the business. This is the final, most important part of the journey: nurturing a culture where data becomes a common language, shifting it from a static report that lands in an inbox on Monday morning to a living, breathing conversation that sparks curiosity and shapes strategy every single day.
Moving Beyond Vanity Metrics
If you want to know if your self-serve program is actually working, you have to look beyond the obvious usage stats. Sure, tracking dashboard views or active users is easy, but it doesn't tell you a thing about whether you're creating real value. The metrics that matter are the ones tied directly to business impact.
Instead of just counting clicks, start measuring outcomes:
- Faster Decision Cycles: Are teams getting answers and taking action in hours instead of days? Compare the "before" and "after" to see if you've actually sped things up.
- Improved Experimentation: Look for an increase in the number of A/B tests or experiments being run. Are teams using results to quickly iterate on products and marketing campaigns?
- Increased Revenue or Efficiency: This is the big one. Can you draw a straight line from an insight someone found themselves to a tangible improvement in a core business KPI?
The true measure of a self-serve analytics program is its ability to increase the operating leverage of your data team. A small group of experts should be able to empower a much larger number of business users, multiplying their collective impact.
Building The Cultural Infrastructure
A data-driven culture doesn't magically appear. You have to build it, brick by brick. This means creating routines and rituals that actively encourage people to explore data and, just as importantly, celebrate what they find. Think of it as building the social layer on top of your technical foundation.
A great place to start is by creating dedicated spaces for people to share their findings. This could be a #data-discoveries channel on Slack, a monthly "show-and-tell" meeting, or a regular feature in the company newsletter. When someone on the marketing team uncovers a surprisingly profitable ad segment, that story needs to be shared far and wide. It validates their work and, more importantly, inspires other teams to go on their own treasure hunts.
Finally, remember that this is an ongoing effort. Keep the learning alive with regular training sessions, host "office hours" with your data pros, and make it clear that there's no such thing as a "dumb" data question. When you turn data analysis into a team sport instead of a solo mission, you build a resilient, curious, and truly data-driven organization.
Got Questions? We've Got Answers
Stepping into the world of self-serve analytics can feel a bit overwhelming at first. It's a big shift, so it’s only natural to have a few questions. Let's tackle some of the most common ones head-on.
How Is Self-Serve Analytics Different From Traditional BI?
Think of traditional Business Intelligence (BI) as a classic sit-down restaurant. You, the business user, have a question, so you place an "order" for a report with the kitchen—the central data team. They prepare it and serve it to you, but this process often creates a queue, a bottleneck.
Self-serve analytics, on the other hand, is like a well-stocked, high-end buffet. The data team still curates and prepares the "dishes" (meaning, they create reliable, certified datasets), but you can walk up, grab a plate, and explore whatever you want, right when you want it. This freedom allows for much faster, more agile decision-making across the whole company.
How Do You Stop People From Misinterpreting Data?
This is a huge, and valid, concern. The solution isn't to lock everything down; it's to build a strong foundation of data governance. The goal here is to create trust, not restrictions.
It all starts with creating a "single source of truth"—a set of certified datasets where key metrics are clearly defined and universally understood. No more arguing over what "active user" really means.
Beyond that, training is essential. This isn't just about showing people which buttons to click in the tool. It's about building basic data literacy, teaching them how to ask the right questions and avoid common pitfalls in interpretation. A collaborative culture is the final piece, where anyone can ask an expert for a second opinion without feeling intimidated.
Is Self-Serve Analytics a Good Idea For a Small Startup?
Yes, absolutely! In fact, it can be a game-changer for smaller teams. Most startups and lean companies don't have the luxury of a dedicated data analyst, especially early on.
Self-serve platforms give everyone on the team the power to get critical insights on user behavior, marketing performance, or product adoption from day one. Modern, intuitive tools like Swetrix make this not just possible, but affordable. It lets a small business build a data-driven culture from the very beginning, making smarter decisions without the need for a big, specialized team.
Ready to empower your team with clear, actionable insights? Get started with Swetrix today and see how our privacy-first, self-serve analytics can transform your business. Explore our features and start your free trial.