- Date
A Complete Guide to Real User Monitoring
 Andrii Romasiun
If you want the unfiltered truth about how your website or application is performing, you need to see it through your users' eyes. Real User Monitoring (RUM) does exactly that, capturing performance data straight from the people actually visiting your site. It goes beyond simulations to measure real page load times, how users interact with your pages, and overall stability, giving you an authentic picture of their journey.
This is how you find out what people really experience.
Understanding Real User Monitoring

Think about trying to figure out your retail store’s customer experience just by watching a security camera at the front door. You'd see people come and go, but you'd miss everything happening inside. You wouldn’t know which aisles are confusing, where shoppers get stuck, or why they leave empty-handed. Relying on lab tests alone is a bit like that limited view.
RUM, on the other hand, is like having a helpful (and invisible) guide follow every customer, taking notes on their journey. It’s a passive technique that gathers performance and interaction data directly from the user's browser as they click, scroll, and navigate your website.
So, how does it work? A small, lightweight snippet of JavaScript code is added to your website. This script quietly runs in the background, observing key performance metrics and user actions without ever getting in the way. It’s designed to capture the messy, unpredictable reality of how your site performs for real people all over the world.
Capturing the Real-World Experience
The real magic of RUM is its ability to account for the endless variables that affect performance out in the wild. Unlike tests run in a controlled lab environment, RUM collects data from a huge variety of real-world conditions.
This gives you a clear picture of how your website performs based on:
- Geographic Location: A user in Sydney, Australia, might have a completely different experience than someone in New York City due to network latency.
- Device Type: Performance can vary wildly between a new gaming PC and an older smartphone.
- Browser Version: A new feature might work flawlessly on the latest version of Chrome but break entirely on an outdated version of Safari.
- Network Conditions: Your site’s speed will be dramatically different for someone on a lightning-fast fiber connection versus someone on a spotty 4G mobile network.
By collecting this data, you stop guessing how your site performs and start seeing exactly what your users see. It transforms performance optimization from a theoretical exercise into a data-driven strategy based on actual human experience.
From Data Points to Actionable Insights
At the end of the day, RUM isn't just about collecting a bunch of numbers; it's about telling a story. It answers critical questions that other monitoring tools simply can't. You can pinpoint the exact line of code causing a JavaScript error, see which groups of users are most affected by slow load times, and prioritize fixes based on what will have the biggest impact on your business.
For example, you might discover that your checkout process is 25% slower for mobile users in Europe, which directly correlates with a higher cart abandonment rate for that specific group. This is the kind of specific, actionable insight that only real user monitoring can provide, helping you make targeted improvements that make a real difference.
RUM vs. Synthetic Monitoring: What's the Difference?
When you’re trying to figure out how your website is performing, you’ll run into two main approaches: Real User Monitoring (RUM) and Synthetic Monitoring. They both want to help you deliver a great experience for your users, but they tackle the problem from completely different angles.
To really get it, let's use a simple analogy: testing a new car.
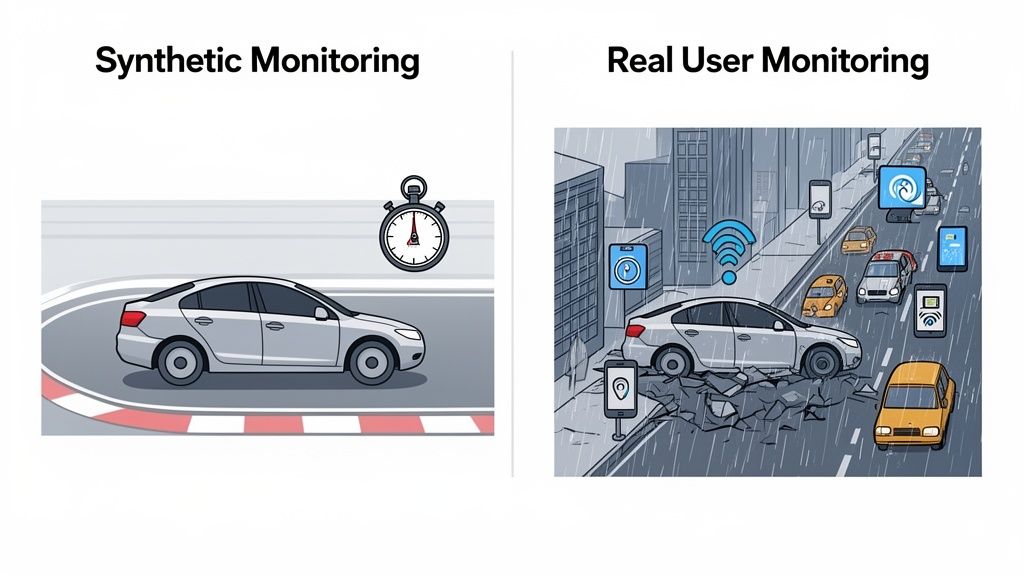
Synthetic Monitoring is like taking that car to a pristine, closed racetrack. Everything is perfect. The track is smooth, the weather is clear, and a professional driver runs the car through a specific set of tests—0 to 60, braking distance, slalom. It’s all about establishing a baseline under ideal conditions.
This is exactly what synthetic monitoring does for your website. It uses automated scripts to run predictable user journeys from servers in clean, stable environments. It’s fantastic for proactive checks, like making sure your site is online or that core features haven't broken in a new release.
On the other hand, Real User Monitoring is like putting thousands of everyday people behind the wheel of that same car and tracking what happens in the real world. They're stuck in city traffic, driving on bumpy country roads in the pouring rain, all with the radio and AC blasting. RUM is about capturing the messy, unpredictable reality of what happens out there.
It gathers performance data directly from your actual visitors' browsers. It shows you the bottlenecks that only pop up under real-world stress. A synthetic test from a high-speed server in New York can't tell you how your site loads for someone on a spotty 4G connection in rural Australia. RUM can.
Real User Monitoring isn’t about how your site could perform in a lab; it’s about how it actually performs for every person who visits. This unfiltered view is crucial for truly understanding and improving the user experience.
A Tale of Two Toolkits
It’s tempting to pit these two against each other, but they aren't competitors. They're partners.
Synthetic monitoring is your early warning system. It's proactive. It tells you, "Hey, the login page is down!" before a real user even has a chance to notice. It’s perfect for uptime monitoring, SLO/SLA tracking, and catching major regressions right after a deployment.
RUM is your source of truth for user experience. It's reactive, analyzing what just happened. It tells you why your users are having a bad time, pointing out that a slow API call is causing frustration for everyone on an older version of Chrome in South America.
You really need both for a complete picture. One tells you if your site is broken; the other tells you why it's slow and frustrating for real people.
RUM vs. Synthetic Monitoring at a Glance
This table breaks down the core differences between the two monitoring methodologies, highlighting where each one shines.
| Attribute | Real User Monitoring (RUM) | Synthetic Monitoring |
|---|---|---|
| Data Source | Actual user sessions from their browsers | Automated scripts from controlled servers |
| Environment | The "wild"—unpredictable networks, devices, locations | Clean, stable, and predictable lab conditions |
| Perspective | Reactive (analyzes past user sessions) | Proactive (runs tests before users are affected) |
| Primary Goal | Understand and optimize real user experience | Verify uptime, set performance baselines, test new features |
| Key Insights | How performance impacts user segments, real-world errors | Is the site up? Are core functions working? |
Ultimately, synthetic tests give you a consistent, clean baseline, while RUM provides the rich, contextual data you need to understand the nuances of your global user base. Combining them gives you the best of both worlds.
Key RUM Metrics and Use Cases
So, what does real user monitoring actually do? In short, it’s about translating abstract performance numbers into the real stories of how people experience your website. It helps you understand not just what is happening on your site, but why it's happening, giving every team—from developers to marketers—the data they need to make smarter decisions.
The market for Real User Monitoring (RUM) is exploding for a reason. Valued at USD 1.2 billion and projected to grow at a 15.8% CAGR, it shows a massive shift in the industry. Businesses are finally realizing that simulated lab tests don't tell the whole story; you have to measure performance where it counts—in the real world. You can find more details on this trend over at marketsizeandtrends.com.
Demystifying Core Web Vitals
At the heart of any modern performance discussion are Google's Core Web Vitals. These aren't just technical buzzwords; they’re concrete measurements of user experience, and RUM is the perfect tool for capturing them directly from your audience.
Largest Contentful Paint (LCP): This is all about perceived loading speed. It measures how long it takes for the main event—the largest image or block of text—to appear on the screen. A slow LCP means your visitors are staring at a half-finished page, which is a fantastic way to increase your bounce rate.
First Input Delay (FID): FID tracks the delay between a user’s first action (like a click or a tap) and the browser’s response. A high FID is what makes a site feel clunky and unresponsive, as if it’s ignoring your commands.
Cumulative Layout Shift (CLS): Ever tried to click a button, only to have a banner load and shove the button down the page, causing you to click the ad instead? That’s layout shift. CLS measures this visual instability, and a high score means you’re delivering a jarring, frustrating experience.
While these vitals are critical, they're just the tip of the iceberg. To get a full picture, check out our complete guide on website performance metrics.
Use Cases for Different Teams
The real beauty of RUM is how versatile it is. A single stream of data offers unique insights to different roles, breaking down organizational silos and getting everyone on the same page.
RUM provides a common language for performance. It connects a developer’s code change directly to a product manager’s conversion goals and a marketer’s campaign results.
Here’s a look at how different teams put RUM data to work.
For Product Managers
Product managers live and breathe the user journey. RUM acts like a magnifying glass, letting them inspect every step for friction and drop-off points.
- Pinpoint Funnel Drop-offs: See exactly where users are abandoning a critical flow, like a checkout or signup form. You might discover the payment page has a terrible LCP, causing people to give up right at the finish line.
- Validate Feature Impact: After shipping a new feature, you can see how it performs in the wild. Is it slowing down the page for users on older phones? RUM gives you immediate, unbiased feedback.
- Build a Data-Driven Roadmap: Instead of guessing what to fix, you can use RUM data to see which performance issues affect the most users or have the biggest impact on revenue, letting you prioritize with confidence.
For Developers and Engineers
For developers, RUM is the ultimate diagnostic tool. It takes debugging out of the clean, predictable local environment and into the messy reality of your users' browsers and devices.
- Find and Fix Real-World Errors: Instantly see JavaScript errors that only happen on a specific browser version or operating system. You get the error message, the stack trace, and all the user context you need to reproduce and crush the bug.
- Optimize Resource Loading: Dig into waterfall charts to see which scripts, images, or third-party API calls are creating bottlenecks for actual users, especially those on slower networks.
- Monitor Post-Deployment Performance: Catch performance regressions the second a new release goes live. If a small code change tanks performance for users in a specific region, you’ll know right away—not after a flood of angry support tickets.
For Marketers and Growth Teams
Marketers need to know if their campaigns are delivering a quality experience that actually converts, not just driving clicks.
- Measure Landing Page Experience: A brilliant ad campaign is worthless if it sends people to a painfully slow landing page. RUM shows you the load times your campaign traffic is actually experiencing, broken down by country, device, or traffic source.
- Connect Speed to Conversions: Draw a direct line between performance and business goals. With RUM, you can prove that users who experience a load time over three seconds have a 50% lower conversion rate, making the case for performance investment a no-brainer.
- Optimize for a Global Audience: Notice your new campaign in Australia is underperforming? RUM data might reveal that mobile users there are facing a 5-second load time, giving you a clear, actionable problem to solve.
Implementing a Privacy-First RUM Strategy
Putting real user monitoring into practice shouldn’t mean a week-long, complicated project. With the right tools, it's often as simple as dropping a lightweight script onto your website. But before you even think about collecting data, you need to build your strategy on a privacy-first foundation. This is about more than just compliance—it’s about earning and keeping your users' trust.
The whole point is to get powerful performance insights without falling back on invasive tracking like cookies or collecting personally identifiable information (PII). A privacy-centric approach gives you the data you need to make your site better while respecting user autonomy and staying on the right side of regulations like GDPR. That's the sweet spot for ethical and effective monitoring.
The workflow RUM enables is a simple but powerful feedback loop: you measure real user interactions, diagnose what's causing issues, and use that knowledge to optimize the entire experience.
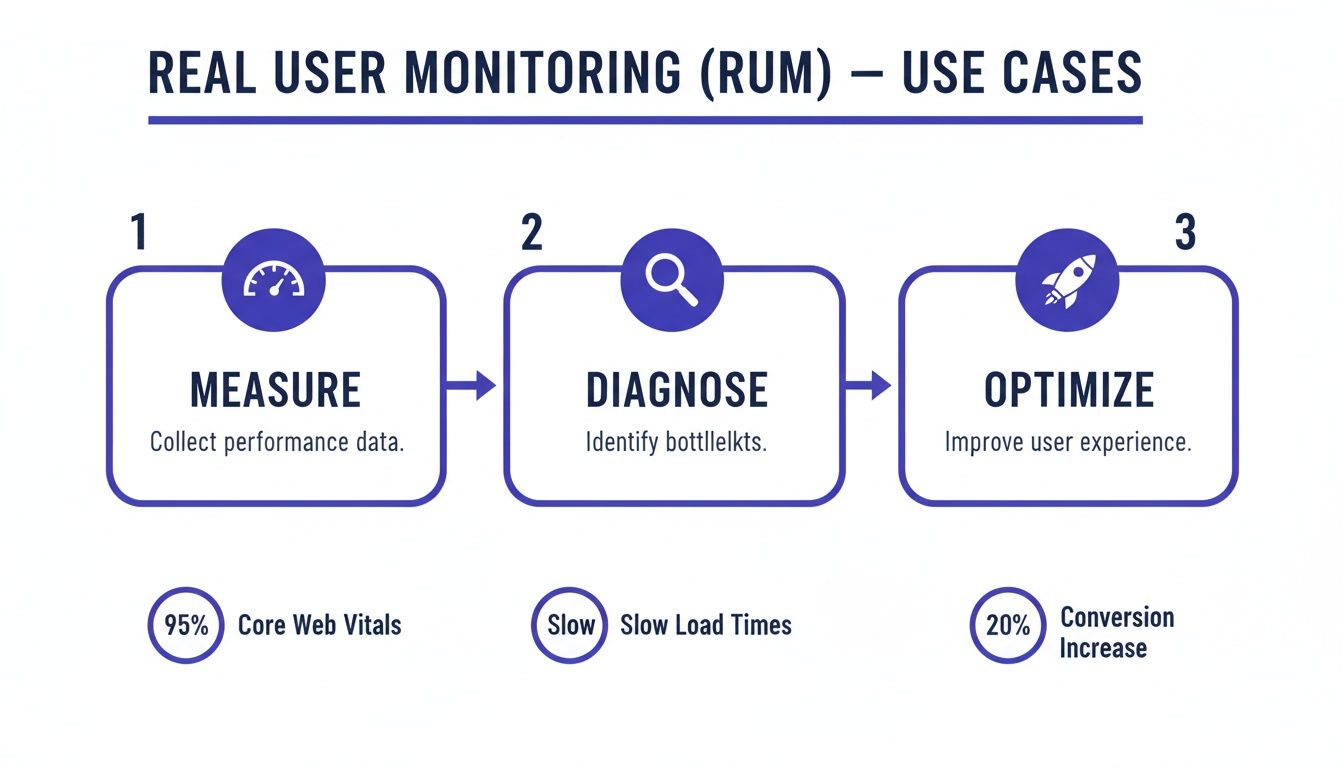
This cycle turns raw performance metrics into real, tangible improvements that your audience will actually feel.
Starting with Smart Data Collection
Once you've picked a tool that aligns with your privacy values, the next step is to be strategic about the data you gather. You don't always need to monitor 100% of your traffic to see what's going on. This is where data sampling comes in handy.
Data sampling means you only collect performance metrics from a representative slice of your user sessions—maybe 20% or 30% of total traffic. This technique offers a few big wins:
- Reduces System Load: Processing less data is easier on your infrastructure and your analytics platform, which helps keep costs in check.
- Maintains Accuracy: For most websites, a random sample provides statistically significant data that accurately reflects the overall user experience.
- Enhances Privacy: By collecting data from a smaller pool of users, you minimize your data footprint even further.
Sampling gives you the insights you need to find bottlenecks without the overhead of capturing every single click and scroll. It’s just a smarter, more efficient way to work. Our guide on setting up privacy-friendly analytics dives deeper into this topic.
Aggregating Errors for Faster Fixes
One of the most valuable things a good RUM setup can do is catch and diagnose JavaScript errors that are ruining your users' day. The problem is, a single bug can trigger thousands of individual error reports, flooding your inbox with a firehose of notifications that’s impossible to sort through.
This is where error aggregation saves the day. Instead of pinging you for every single instance, a smart RUM tool groups identical errors together.
Error aggregation cuts through the noise. It transforms thousands of individual error events into one actionable item, complete with context about which browsers, devices, and pages are most affected.
This means your dev team sees that "TypeError: Cannot read properties of null" happened 1,500 times in the last 24 hours, mostly hitting Safari users on iOS. They can then fix the root cause once, instead of trying to chase down thousands of duplicate alerts. It’s the difference between chaos and clarity.
This kind of focused insight is why the End User Experience Monitoring (EUEM) market, valued at USD 2.19 billion, is projected to soar to USD 9.23 billion. Marketing and UX teams depend on these capabilities to connect the dots in the user journey—like seeing how a tiny page load delay causes a huge spike in shopping cart abandonment. You can find more details on these market projections.
By combining a lightweight script, smart sampling, and intelligent error aggregation, you build a monitoring system that's both incredibly powerful and respectful of your users.
Turning RUM Data into Actionable Insights
Collecting data is just the first step. The real magic of real user monitoring happens when you turn that firehose of information into meaningful change. Raw metrics are interesting, but actionable insights are what actually improve your product. This is how your RUM dashboard goes from a passive reporting tool to an active command center for your entire digital experience.
The ultimate goal is to build a culture where performance issues get spotted and solved before they snowball into widespread customer frustration. Instead of waiting for a flood of angry support tickets, your team can get ahead of problems, often fixing them before most users even notice.
Setting Up Intelligent Alerts
Imagine you push a new deployment with a subtle bug. It only affects users on older versions of Safari, causing a specific JavaScript error that freezes the checkout button. Without the right monitoring, this could fly under the radar for days, quietly tanking your revenue with every lost sale.
This is exactly where intelligent alerting systems prove their worth. Modern RUM platforms like Swetrix let you create very specific, conditional alerts that ping you the second a key metric goes off the rails.
You can set up alerts to trigger based on all sorts of conditions:
- A sudden spike in JavaScript error rates on a specific page.
- A big drop in Core Web Vitals scores for a key user segment (like mobile users in Germany).
- An unusual increase in the load time for a critical API endpoint.
- A sudden surge in 404 errors, pointing to broken links or missing assets.
These alerts can be piped directly into your team’s existing workflow, sending notifications to channels in Slack, Discord, or Telegram. That immediate feedback loop is absolutely essential for maintaining a high-quality user experience and allows for incredibly fast response times.
A well-configured alert is like an automated watchdog for your application. It moves your team from a reactive "break-fix" model to a proactive "predict-and-prevent" mindset, stopping small issues from becoming major business problems.
This proactive approach is a huge reason for RUM's growing popularity. The massive Enterprise Monitoring market is projected to grow from USD 35.16 billion to USD 184.65 billion, and RUM stands out for its sharp focus on the user. Real-world data shows that teams using RUM resolve issues 25% faster and see 18% better customer satisfaction scores. You can explore more about the growth of enterprise monitoring on precedenceresearch.com.
Creating a Proactive Performance Culture
Alerts are fantastic for catching immediate fires, but the long-term win is building a culture where performance is everyone's job. This means making data accessible and understandable to the whole team, not just the engineers. Many of the best real user monitoring tools offer powerful APIs that let you pull data into your own custom dashboards or internal tools.
For example, you could build a custom dashboard in a tool like Grafana that pulls in RUM performance data and plots it against key business metrics. This could visually show the direct link between page load times and conversion rates, making the impact of performance crystal clear to product managers and marketers.
Here’s how that plays out. Let’s say a product team wants to add a heavy, third-party marketing script to the site. Before going live, they can look at RUM data to see how similar scripts have tanked performance in the past. After a limited rollout, they can instantly measure the new script’s real-world effect on Core Web Vitals and user engagement, allowing them to make a decision based on data, not a gut feeling.
When you weave RUM data into your team's daily routines, you empower everyone to think about performance. Developers see the real-world impact of their code, product managers can prioritize fixes based on what actually affects users, and marketers understand how site speed helps or hurts their campaigns. This complete picture is what truly turns raw data into a powerful engine for continuous improvement.
Common Questions About Real User Monitoring
Even after seeing all the benefits, it's smart to have a few questions before you jump in. Let's tackle some of the most common ones we hear about real user monitoring. Think of this as the final check-in before you start gathering the insights that will genuinely improve your user experience.
We'll clear up any lingering doubts, from performance impact to how RUM plays with other tools you might already be using.
Will Real User Monitoring Slow Down My Website?
This is the big one, and thankfully, the answer is a firm no. Any modern RUM tool worth its salt is built to be incredibly lightweight. The tracking scripts are tiny, and more importantly, they load asynchronously.
What does that mean? It means the script doesn't get in the way of your page's main content. Your visitors can see and interact with your site immediately, while the RUM script does its thing quietly in the background. It waits for the important stuff to finish before sending back performance data, so the user’s experience is never compromised.
The whole point of real user monitoring is to help you speed things up. A tool that slows you down would be completely self-defeating. The tiny footprint of a well-designed RUM script is a minuscule price to pay for the massive performance gains you'll unlock with its data.
In nearly every case, the optimizations you make based on RUM data will far, far outweigh the almost unnoticeable weight of the script itself.
How Is RUM Different from Google Analytics?
This is a great question. While both tools gather data from your visitors, they're designed to answer fundamentally different questions. It's not about one being better than the other—they're partners, not competitors.
Here’s a simple way to think about it: Google Analytics is your marketing and business analyst. It tells you the "what" of user behavior:
- What pages are people visiting the most?
- What channels are driving the most traffic?
- What is my conversion rate for this new ad campaign?
Real user monitoring is your on-the-ground technical expert. It digs into the "how" of the user experience:
- How is the site performing for users on slow 3G in Southeast Asia?
- How are the Core Web Vitals looking for different segments of my audience?
- How many people are being hit by that frustrating JavaScript error?
Let’s put it in a real-world scenario. Google Analytics might tell you that 70% of users are abandoning your checkout page. That’s a critical "what." But why are they leaving? RUM gives you that "why"—it shows you the page is taking five long seconds to become interactive, and a specific API call is the culprit. One tool tells you there’s a problem; the other tells you exactly how to fix it.
Can I Use RUM for Single-Page Applications?
Absolutely. In fact, for Single-Page Applications (SPAs) built with frameworks like React, Vue, or Angular, RUM isn't just useful—it's essential.
With a traditional website, performance is measured in full page loads. A user clicks a link, and the browser fetches a whole new page from the server. Simple.
SPAs are a different beast. After the initial load, everything happens on the fly. Users navigate between different "views" or "routes" without ever reloading the entire page. A basic tracking tool that only measures that first page load would be completely blind to all the critical activity happening inside your app.
Modern RUM platforms are built for this. They know how to track these "route changes" or "virtual page loads" as unique events. This lets you measure things like:
- The time it takes to transition from the product list to a product detail view.
- The performance of API calls that fetch data for a new component.
- User interactions and errors that happen long after the initial page load is a distant memory.
Without RUM, you'd have massive blind spots, completely missing the performance issues unique to modern, dynamic web apps. It gives you the detailed view you need to optimize the entire journey within your SPA, not just the front door.
Ready to see how your website truly performs for your users? Swetrix provides privacy-first, lightweight real user monitoring that turns performance data into clear, actionable insights. Start your 14-day free trial today and begin optimizing your user experience with confidence.