- Date
Upgrading Your Linux Web Traffic Monitor for Cookieless Analytics
 Andrii Romasiun
Third-party cookie deprecation blinds digital marketing teams. Ad-blockers shut down client-side scripts before execution, and visitors ignore consent banners upon arrival. A Linux web traffic monitor restores audience visibility. This software parses web server access logs or captures network packets to generate visitor statistics. Upgrade a traditional terminal-based log analyzer into a modern analytics engine without deploying intrusive pop-ups.
The Shift Back to Server-Side Tracking
Marketers Lose Data to Ad-Blockers
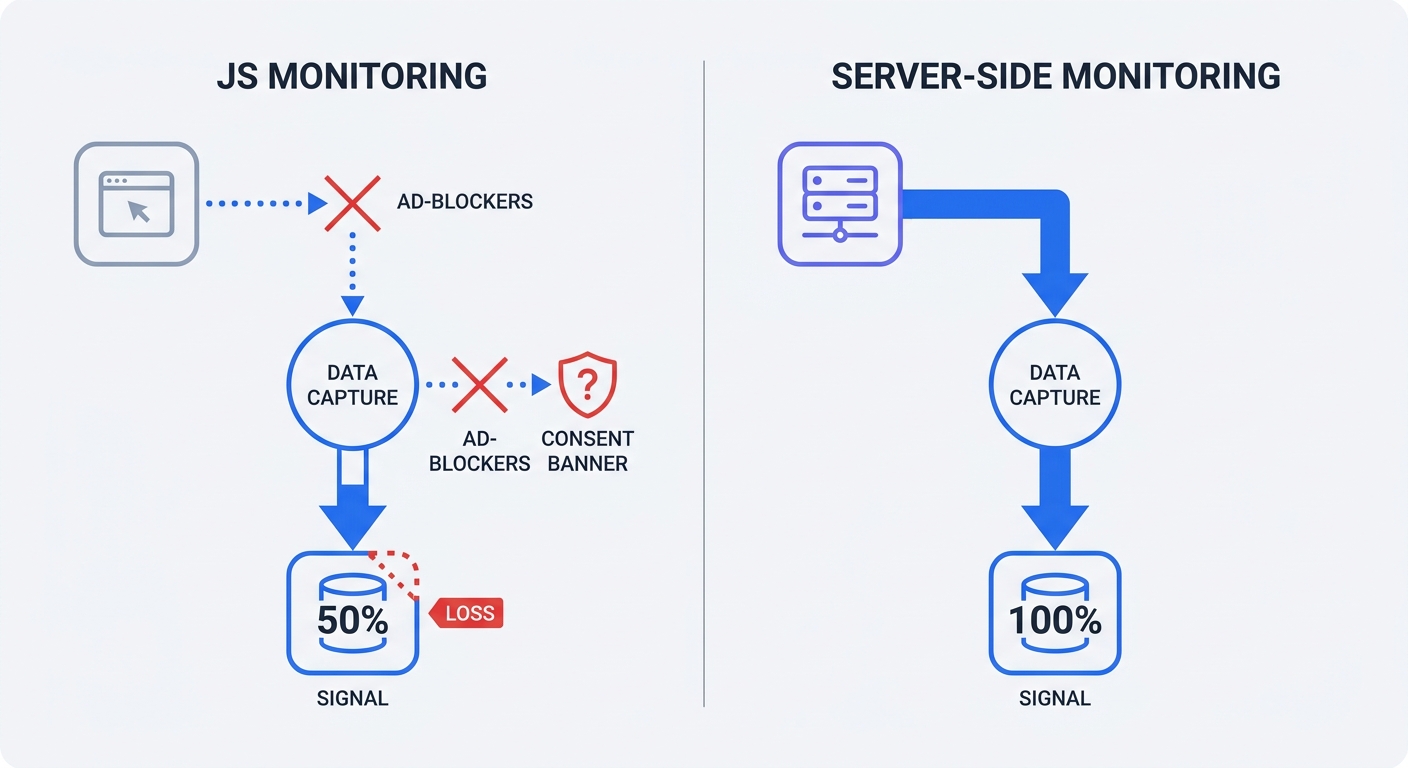
Apple configures Safari and Firefox browsers to block third-party cookies by default. These privacy settings cause data blindness for marketing departments. Third-party cookie deprecation drives an average 35-45 percent tracking signal loss across B2B and retail websites. Apple's App Tracking Transparency pushes that data deficit to 50 percent for mobile iOS applications.
Relying on frontend JavaScript tags guarantees an incomplete dataset. Visitors in opt-in jurisdictions decline tracking requests. Average user consent rates sit at 52 percent in the European Union, though this metric fluctuates significantly based on the website's industry and the requested data type. Websites lose half their traffic visibility the moment a cookie banner loads.
Intelligent Tracking Prevention in Safari restricts first-party cookies to a seven-day lifespan. Return visitors register as new users after a week. Conversion attribution breaks, and revenue modeling fails.
The Original Privacy-First Analytics Approach
System administrators track traffic at the server level. Analyzing server requests bypasses browser restrictions. Nginx and Apache record every client connection. Ad-blockers cannot prevent an IP address from establishing a handshake with a host.
Server-level tracking may eliminate the need for consent banners in some jurisdictions/implementations, provided administrators avoid cross-site tracking cookies. Administrators capture total traffic volume using raw access logs that contain zero marketing cookies. Note that privacy requirements vary by jurisdiction and implementation—consult legal counsel to ensure compliance.
Calculate current signal loss percentages:
- Access the web server via SSH.
- Run
wc -l /var/log/nginx/access.logto pull the total server request count for the past 30 days. - Filter out static assets like images and CSS files to calculate raw pageviews.
- Open the current frontend analytics dashboard.
- Compare the frontend pageview number against the raw server count.
- Subtract the frontend number from the server number, divide by the server number, and multiply by 100.
The resulting percentage represents missing traffic volume.
Traditional Log Analyzers vs. Modern Analytics
The Limits of AWStats and GoAccess
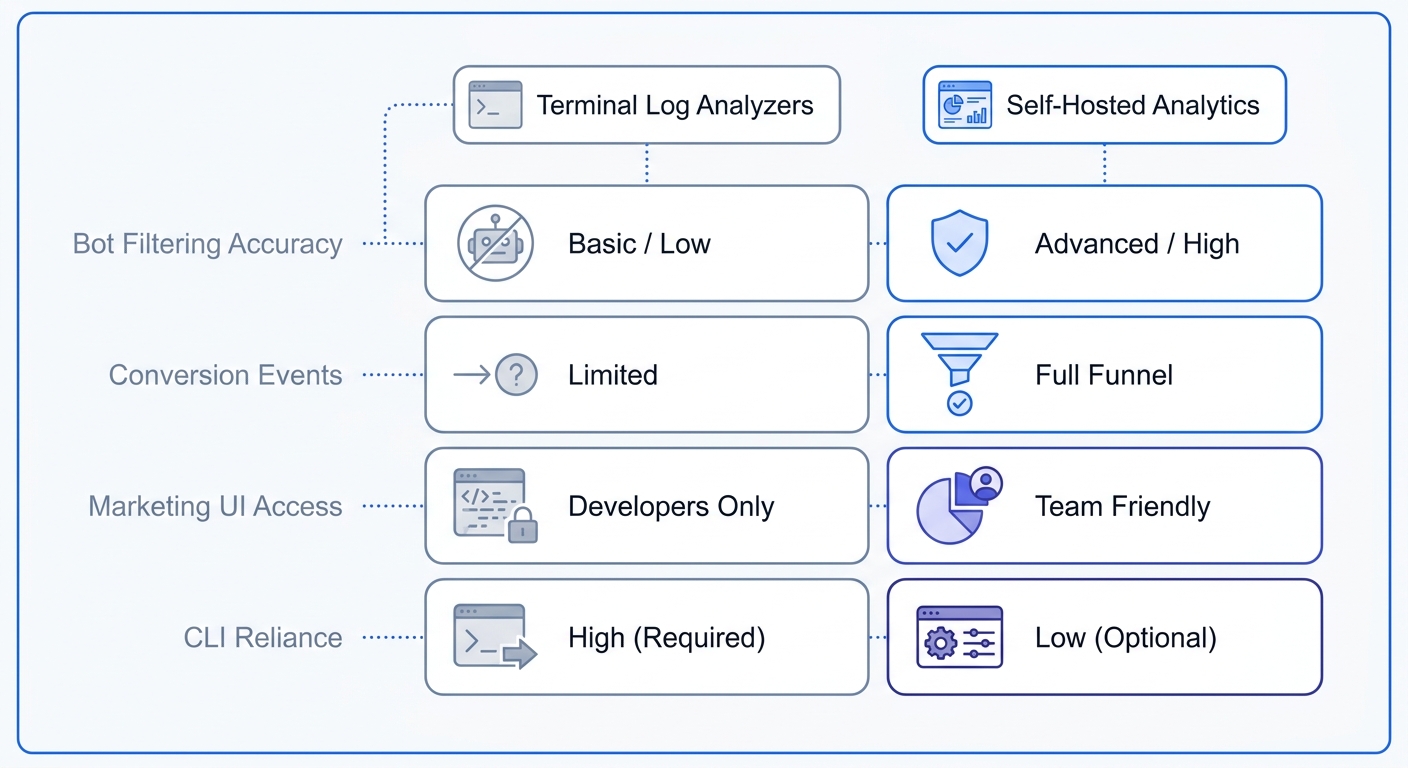
Legacy monitoring tools run in the terminal environment. Software like AWStats and GoAccess parses raw logs to output bandwidth consumption and hit counts. These applications capture all inbound requests without requiring JavaScript code.
Command-line tools falter under modern marketing demands because raw logs capture automated noise alongside human traffic. Uptime monitors ping homepages every minute. Search engine crawlers trigger server log pageviews during sitemap indexing. AI scrapers consume bandwidth and mimic human visitors. Administrators must filter out these non-human requests to prevent inflated traffic metrics.
Terminal-based log analyzers rely on complex regular expressions to separate users from machines. Misconfiguring a single regex string deletes legitimate user data.
Open the GoAccess configuration file. Append the --ignore-crawlers flag to the execution command to strip known user agents like Googlebot from the final report.
Basic user agent filtering fails against disguised scrapers that spoof headers to resemble Chrome or Safari browsers. Modern web analytics platforms solve this problem through algorithmic behavior detection. An advanced engine identifies automated traffic by analyzing request patterns and execution contexts. Marketers receive accurate human engagement metrics.
Bridging the Sysadmin and Marketing Gap with a Linux Web Traffic Monitor
Modern growth strategies require behavioral metrics and custom event tracking. Server administrators demand self-hosted control and raw data ownership. A hybrid architecture merges server-side reliability with frontend granularity.
Compare traditional and modern solutions across core capabilities:
| Feature | AWStats / Webalizer | GoAccess | Swetrix (Self-Hosted) |
|---|---|---|---|
| Data Capture | 100% Server Logs | 100% Server Logs | 100% Cookieless |
| Interface | Static HTML | Terminal / HTML | Interactive Dashboard |
| Bot Filtering | Basic Regex | Moderate Regex | Advanced Algorithmic |
| Custom Events | None | None | Unlimited |
| Marketing UTMs | None | None | Full Campaign Tracking |
Marketing campaigns require explicit source attribution. Traditional server logs record the requested URL path. When a visitor lands on /?utm_source=newsletter, Nginx logs the full query string.
System administrators write custom scripts to extract these query strings into readable campaign reports. Manual extraction wastes engineering hours. Standardizing links with a UTM generator streamlines campaign structure, yet extracting raw strings in terminal tools demands extensive manual effort.
Switching to a self-hosted analytics engine automates parsing workflows. The platform captures the query string, categorizes the source, and builds visual campaign performance charts. Marketing teams measure email newsletter return on investment without parsing server text files.
Frontend error tracking adds another layer of missing visibility. Server logs record 500-level database failures, yet miss client-side JavaScript crashes. Integrate a frontend error tracking setup to catch broken checkout buttons or failing API calls on the visitor device. Fix broken user experiences before customers submit support tickets.
Review the current monitoring stack against business goals. List specific custom events the marketing team tracks. If the list includes scroll depth tracking or form submission events, administrators must deploy a platform built for both system stability and marketing visibility.
Managing GDPR Compliance on Linux Servers
The Danger of Storing Raw IP Addresses in Linux Web Traffic Monitors
Web servers capture complete client identifiers. Default Nginx access logs write the full IP address, user agent, and request path to a plain text file. Under the General Data Protection Regulation, an IP address functions as Personally Identifiable Information. Storing unmasked strings like 192.168.1.25 creates severe compliance liabilities.
Regulatory bodies punish mishandled data storage. The Data Protection Commission Ireland levied a €1.2 billion fine against Meta for transferring European user data without adequate privacy shields. Securing server logs minimizes legal risk.
Preparing for European Privacy Directives
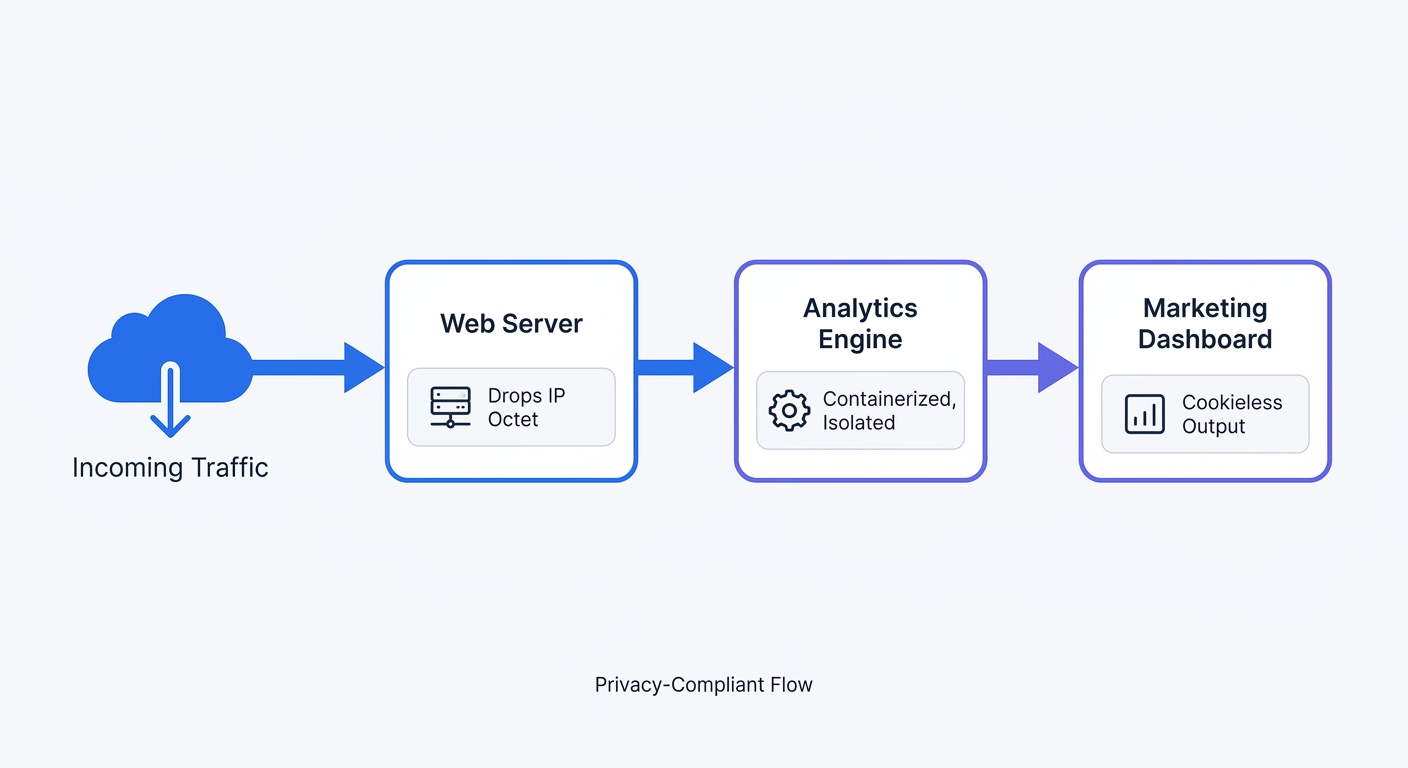
Legislative frameworks favor statistical measurement over individual profiling. Under evolving European privacy directives, analytics software may be exempt in certain jurisdictions or implementations from user consent requirements under specific criteria. The data must remain aggregated and serve a strict statistical purpose. Software platforms face penalties for sharing user behavior with third-party advertising networks.
Administrators achieve compliance by anonymizing user data before writing it to the disk. Edit the web server configuration to mask the final octet of every visitor IP address.
Open the Nginx configuration file and apply this mapping:
map $remote_addr $anonymized_ip {
    ~^(?P<ip>\d+\.\d+\.\d+)\.\d+$ $ip.0;
    ~^(?P<ip>[a-fA-F0-9:]+):[a-fA-F0-9]+$ $ip:0000;
    default 0.0.0.0;
}

log_format anonymized '$anonymized_ip - $remote_user [$time_local] '
                      '"$request" $status $body_bytes_sent '
                      '"$http_referer" "$http_user_agent"';

access_log /var/log/nginx/access.log anonymized;
Apache administrators must use a different module approach. Enable the mod_remoteip module, then adjust the LogFormat directive to strip the final digit block.
Restart the web server service. Verify the newest log entries end with .0 for IPv4 connections to confirm the anonymization process transforms personal data into a harmless statistical aggregate.
Deploying a Modern Linux Web Traffic Monitor
The Rise of Dockerized Analytics
Linux powers 96.3 percent of the top 1 million websites worldwide. Native package managers introduce complex dependency conflicts on these hosts. Installing components via apt-get clutters the host operating system. System administrators prefer containerized application environments because Statista reports 47 percent of professional developers run Linux-based operating systems for daily workflows.
Docker Compose standardizes deployments across any Linux distribution. Containers isolate application components and simplify version upgrades. Administrators pull a new image and recreate the container without breaking the host system.
Scale dictates architectural choices. A single text file works for a personal blog, whereas parsing a 50GB access.log file stalls a standard Virtual Private Server. Legacy parsers consume massive CPU resources when scanning millions of lines.
Modern web traffic monitors implement column-oriented databases. Platforms utilizing ClickHouse instead of flat files compress data blocks and execute analytical queries in milliseconds.
Provision at least 2GB of RAM for the Dockerized ClickHouse instance. Edit the database configuration file to establish memory boundaries. Set the max_server_memory_usage parameter to prevent analytical processes from starving the primary web server application. Proper resource allocation guarantees the tracking engine runs in the background without degrading site performance.
Introducing Swetrix for Self-Hosted Tracking
Build a modern monitoring pipeline with an open-source analytics engine. Swetrix serves as a Google Analytics alternative administrators host on their own infrastructure. The platform unifies strict server control with robust marketing features.
Deploying Swetrix Community Edition replaces outdated Perl scripts with a cookieless, high-performance platform. The frontend tracking script weighs under 5KB. This tiny payload preserves page load speed while capturing UTM campaign parameters and custom frontend conversions. Engineering teams maintain server-side ownership while marketing departments retain behavioral insights.
Execute a transition to privacy-first analytics:
- Provision a Virtual Private Server located in the European Union to guarantee data sovereignty. A 2GB RAM x86_64 or arm64 instance is sufficient for most deployments.
- Install Docker and the Docker Compose plugin on Ubuntu LTS (or your distro's latest stable release).
- Clone the Swetrix self-hosting repository from GitHub:
git clone https://github.com/swetrix/selfhosting
cd selfhosting
- Run the bundled
./configure.shscript to generate the.envfile. The script autogenerates secrets, prompts for SMTP and OIDC settings, and validates the Docker installation. - Launch the full stack with
docker compose up -d. This boots the frontend, API, Redis, ClickHouse, and an Nginx reverse proxy that exposes the dashboard on port 80, with/backend/routed internally to the API. - Put your own TLS-terminating reverse proxy (Traefik, Caddy, or another Nginx instance with Let's Encrypt) in front of the bundled
nginx-proxycontainer, then setCLIENT_IP_HEADER=x-forwarded-forso visitor IPs survive the extra hop. - Open the dashboard, create an administrator account via the setup wizard, and register your first project.
- Paste the provided JavaScript tracking snippet into the website header.
- Monitor incoming web traffic without deploying cookie banners.
The complete reference, including upgrade procedures, OIDC configuration, and Traefik routing labels, lives in the Swetrix self-hosting guide.
Swetrix provides an open-source, privacy-first web analytics platform. Bypass intrusive cookie banners and reclaim marketing data. Start the 14-day free trial today.