- Date
A Developer's Guide to the Http 500 Status Code
 Andrii Romasiun
An HTTP 500 status code is a general-purpose error message that pops up when something has gone wrong on a website's server. Essentially, the server ran into an unexpected problem and couldn't complete the user's request.
This isn't an issue on your end—it has nothing to do with your browser, computer, or internet connection. The problem lies entirely with the website's own internal workings.
Decoding the Server's Cry for Help

Picture your website’s server as a highly efficient librarian. A user asks for a specific page, and the librarian instantly pulls the right book off the shelf. But an HTTP 500 error is like the librarian suddenly freezing, unable to even process the request because something completely unexpected happened behind the counter.
The server knows it goofed, but it can't tell you exactly why. That’s what makes the 500 error a "catch-all" response; it's used for any server-side hiccup that doesn’t fall into a more specific category. It's easily one of the most common—and frustrating—problems you'll encounter in web development.
A 500 error is the server's way of saying, "I've encountered a problem I didn't expect, and I don't know how to proceed." It's a critical signal that an underlying issue needs immediate attention.
Why This Vague Error Is So Common
The HTTP 500 error has been a persistent headache for developers ever since it was officially defined in the HTTP/1.0 specification way back in 1996. It’s particularly notorious in the WordPress ecosystem, which powers over 43% of the web. In fact, mismatched PHP versions are such a frequent culprit that they cause 500 errors in an estimated 40% of related support tickets.
Another common trigger is when a website with lots of plugins runs out of memory, causing a fatal timeout. You can find out more about how experts diagnose these issues to see just how deep the rabbit hole goes.
This very vagueness is what makes troubleshooting so tricky. The server isn’t handing you any clues; it's just waving a white flag. For your users, it means a broken experience that can quickly damage their trust in your site. For you, it’s a red alert that something is seriously wrong behind the scenes, with the potential to affect:
- User Experience: Visitors hit a dead end, get frustrated, and leave.
- Business Operations: Essential functions like a checkout flow or user registration might be completely down.
- SEO Performance: Search engines don't like broken pages and may temporarily de-index URLs that consistently return 500 errors.
Uncovering the Common Causes of 500 Errors
When you hit an HTTP 500 status code, it feels like your server just threw its hands up in the air and gave up. But it’s never a random event. Think of it less as a mysterious dead-end and more as a specific alarm bell telling you something has gone wrong behind the scenes.
Your job is to play detective and figure out which part of the system is failing. The good news is that most 500 errors fall into a few common categories, which turns panicked guesswork into a focused investigation.
To help you start that investigation, here’s a quick rundown of the most frequent culprits and where to look first.
Common Causes of HTTP 500 Errors and Initial Checks
| Cause Category | Specific Example | First Place to Check |
|---|---|---|
| Application Code Flaws | A syntax error in a recently deployed PHP script. | The server's error logs for a specific file and line number. |
| Database Connection | The database server is offline or unreachable. | Your hosting provider's status page or database management panel. |
| Server Misconfiguration | An invalid rule in your .htaccess file. | The .htaccess file itself for typos or incorrect syntax. |
| Permission Issues | A script file doesn't have execute permissions. | The file permissions for the script (e.g., using an FTP client). |
| Resource Exhaustion | A WordPress plugin is causing a memory leak. | The server's resource usage dashboard (CPU and RAM). |
This table gives you a starting point. Now, let's dig a little deeper into what each of these issues actually looks like.
Flaws in Your Application Code
More often than not, the problem lies right in your own backyard—the application's backend code. A tiny syntax error, a logical mistake in a loop, or an unhandled exception in languages like PHP, Python, or Node.js can bring the whole process to a screeching halt.
This is a classic "it worked on my machine!" scenario. A small change that wasn't fully vetted in a staging environment can easily cause a crash in production. It could also be an external dependency, like a third-party API that suddenly starts timing out or sending back unexpected data, causing your application to stumble.
Database Connection Failures
Your website’s database holds all the keys to the kingdom: user accounts, product details, blog posts, you name it. If your application can't talk to the database, it's like a librarian who can't access any books—it doesn't know what to do next and throws a 500 error.
This communication breakdown often happens for a few reasons:
- Incorrect Credentials: A simple typo in the database username or password.
- Database Server Downtime: The database server itself is offline or restarting.
- Corrupted Database: The database has become damaged and can't process requests properly.
- Connection Timeouts: The server is overloaded, and queries are taking too long to run, causing the connection to drop.
Database meltdowns are a top culprit—slow queries or downtime triggering 500s when servers can't fetch data fast enough. Industry benchmarks reveal that in high-traffic scenarios, database issues contribute to 35% of 500 errors across AWS and Azure deployments. You can read more about common server error fixes and their impact.
Server Misconfigurations and Permission Issues
Sometimes the code is perfect, but the environment it's running in is not. Simple misconfigurations or incorrect file permissions can stop your server from executing the very files it needs to run your site.
Think of file permissions like a bouncer at a club. If a script needs to get in and run, but the server doesn't have the right credentials (permissions), it gets denied. A classic example is the .htaccess file on an Apache server. This little file is incredibly powerful, but a single typo or an invalid rule inside it is a surefire way to get an instant 500 error.
Server Resource Exhaustion
Finally, your server isn't infinite. It has a limited amount of memory (RAM) and processing power (CPU). If your application gets too greedy and tries to use more resources than are available, the server will often step in and terminate the process to protect itself. The result? A 500 error.
This is especially common with content management systems like WordPress, where a poorly coded plugin can create a memory leak, slowly hogging all the available RAM. It can also happen during a sudden traffic spike when your server's CPU gets overwhelmed and simply can't keep up with all the incoming requests.
Your Step-By-Step Workflow for Debugging 500 Errors
When an HTTP 500 status code pops up, it feels like your website just slammed into a brick wall. The first instinct is often panic, but scrambling without a plan will only lead you down a rabbit hole. The real key is to trade that frantic energy for a methodical, step-by-step process. A structured workflow lets you systematically knock down potential culprits until the true source of the problem is cornered.
Think of yourself as a detective arriving at the scene. You wouldn't just start flipping over furniture randomly. You'd follow a procedure, starting with the most obvious clues and methodically working your way through a checklist. That's exactly how you should tackle a 500 internal server error.
This chart lays out the usual suspects, giving you a high-level map of where to begin your investigation.
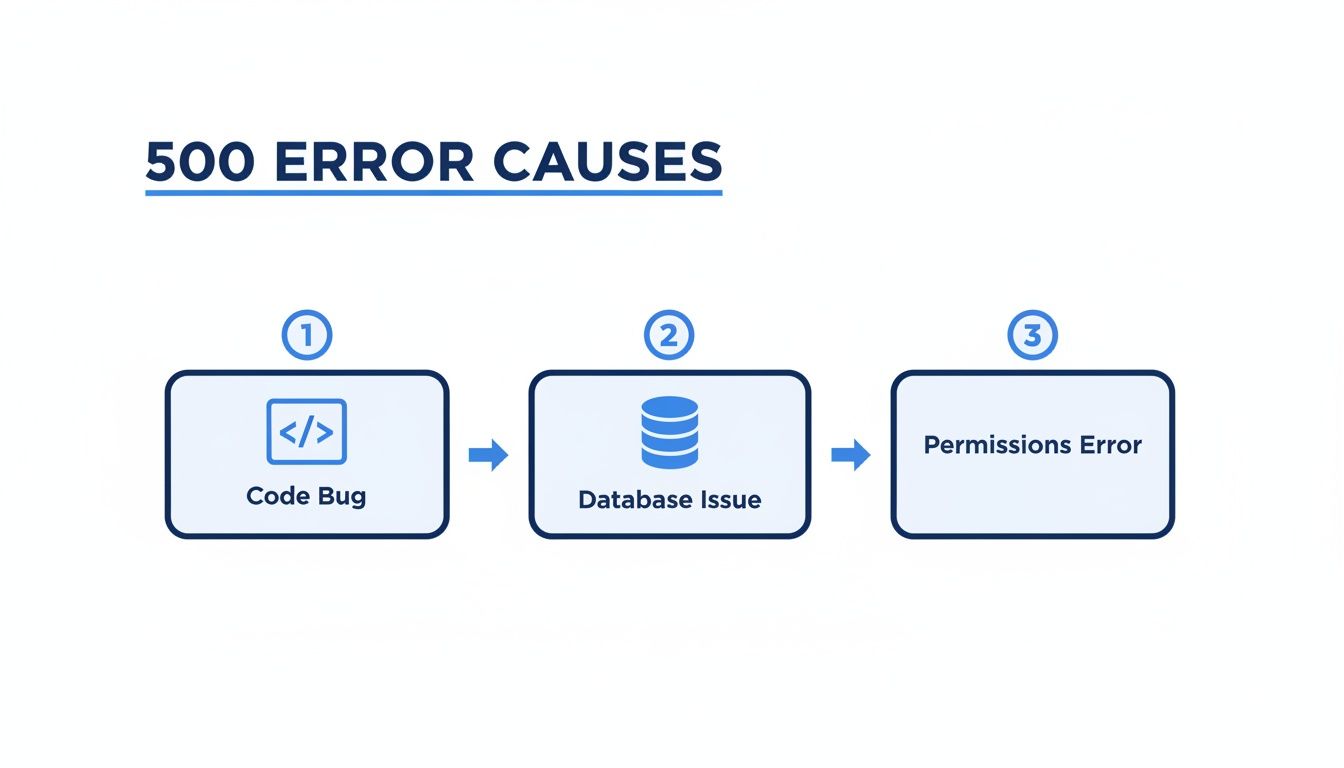
As you can see, the problem usually boils down to the application code, a database hiccup, or something off with server permissions. This gives you a solid starting point.
Start With the Server Logs
Your server logs are, without a doubt, the most powerful tool in your debugging arsenal. They're the black box recorder for your website, capturing every request and, more importantly, every single error. Forget the vague "Internal Server Error" message your users see; the logs often give you the uncensored truth with specific error messages, file names, and even the exact line number where things went wrong.
Where you find these logs depends on your server stack:
- Apache Servers: The main error log is typically located at
/var/log/apache2/error.logor/var/log/httpd/error_log. - Nginx Servers: Check for the error log at
/var/log/nginx/error.log. - Managed Hosting: Most hosting providers have a "Logs" or "Error Log" section right in their control panel (like cPanel or Plesk), making it easy to access.
Once you have the log file open, scan for entries that match the time the 500 error happened. Spotting a line like PHP Fatal error: Uncaught Error: Call to undefined function... in /var/www/html/wp-content/plugins/my-plugin/functions.php:123 is like finding gold. It’s a direct pointer to the file and line number causing the meltdown.
Enable Detailed Error Reporting
By default, live servers are set up to hide detailed error messages. This is a good security practice—you don't want to expose your server's inner workings to the world. But for debugging, those details are exactly what you need.
Crucial Warning: Never, ever leave public error reporting enabled on a live production website. The best practice is to handle this in a staging or development environment. If you absolutely must debug on a live site, only flip it on for the few moments it takes to reproduce the error, then turn it right back off.
For a PHP-based app (like WordPress or Laravel), you can usually dial up the error reporting detail by editing your php.ini, .htaccess, or an application config file. The goal here is to temporarily swap that generic 500 error page for a screen that prints the raw server error, giving you instant, actionable feedback.
Review Recent Changes and Deployments
If the logs aren’t giving you a clear-cut answer, the next question to ask is simple: "What changed?" Servers rarely break on their own. An error is almost always a reaction to something new.
Jog your memory and map out a timeline of recent events.
- Code Deployments: Did you just push new code? A tiny syntax error or a logical flaw is a classic cause. Use a version control system like Git to review the latest commits.
- Plugin or Theme Updates: In any CMS, a newly installed or updated plugin is a prime suspect. Plugins can clash with each other, your theme, or even the version of PHP running on the server.
- Configuration Changes: Did someone recently tweak server settings, environment variables, or
.htaccessrules? One misplaced character in a config file can easily take down an entire site.
Walking back through these recent changes often points you straight to the problem. If the site crashed right after you updated a plugin, disabling it is the logical first test to see if you've found your culprit.
Systematically Check Permissions and Configurations
Ruled out recent code changes? It’s time to look at the server environment itself. Misconfigurations are a sneaky but incredibly common cause of the HTTP 500 status code.
Here's a checklist to run through:
- File and Directory Permissions: Web servers need the right permissions to read and run files. If permissions are too restrictive, the server can't execute a necessary script. As a rule of thumb, folders should be
755and files should be644. - The .htaccess File: This little file is powerful on Apache servers, but it's also a frequent point of failure. A single bad character or a faulty rule can trigger an instant 500 error. A quick diagnostic trick is to temporarily rename it to
.htaccess_bakand see if the error disappears. - PHP Memory Limit: Your application might be trying to bite off more memory than the server is willing to give. When a script exceeds its allocated memory, the server terminates it, which often results in a 500 error. You may need to increase the
memory_limitin yourphp.inifile.
Following this workflow—logs, error reporting, recent changes, and configurations—turns you from a frantic guesser into a methodical diagnostician. This approach doesn't just save you time and stress; it prepares you to handle future server errors with confidence. To learn more about how this data can be gathered automatically, check out our guide on what real user monitoring is and how it helps you catch these issues in real time.
How Swetrix Turns 500 Errors from a Crisis into a Quick Fix
Let's be honest: waiting for an angry email from a user to learn your site is broken is a terrible strategy. It’s purely reactive. By the time that one person complains, who knows how many others have already hit that same http 500 status code, given up, and left for a competitor.
This is where you need to shift from firefighting to proactive problem-solving. A dedicated error tracking and real user monitoring (RUM) platform completely changes the game. Instead of manually sifting through mountains of server logs after the damage is done, you get instant, context-rich alerts the moment a 500 error strikes.
See Exactly What's Breaking, Not Just That Something Broke
The biggest frustration with a generic 500 error is how vague it is. Swetrix cuts right through that ambiguity by automatically catching every single server-side error as it happens in the real world. Think of it as a black box recorder for your application's health.
For every single 500 error, you get a full report packed with the clues you need:
- The User’s Setup: What browser, OS, and device were they using?
- The Exact URL: Which page or API endpoint is failing?
- Request Details: Get the key request headers and other metadata to understand the full context of the failure.
All this data is funneled into a clean, easy-to-read dashboard. You can immediately see how often an error is happening, how many users it's affecting, and when it first popped up.
This lets you stop guessing and start prioritizing. You can focus your energy on fixing the bugs that are having the biggest real-world impact on your users.
Get Instant Alerts Before Users Complain
Finding out about a critical server error hours—or even days—later is a nightmare scenario for any team. A sudden spike in 500 errors could signal a bad deployment or a service outage that needs all hands on deck, right now.
Waiting for users to report errors is a losing game. By the time you receive a manual report, the issue may have already impacted thousands of users and damaged your brand's credibility.
Swetrix lets you set up smart alerts that ping your team the second things go sideways. You can pipe these notifications right into the tools your team already uses every day, like:
This means your on-call developer gets a heads-up within seconds of a surge in 500 errors. The alert includes a direct link to the error details in Swetrix, so they can jump straight into diagnosing the problem with all the context they need. You can fine-tune the alert thresholds to get notified about what matters without drowning in noise.
To see all the features in action, you can learn more about how Swetrix error tracking works.
From Reactive Firefighting to a Proactive Workflow
When you combine automatic error capture with instant alerts, you fundamentally improve how your team handles an http 500 status code. The whole process becomes incredibly efficient.
- Detection: A 500 error happens in production. Swetrix instantly grabs the event and all the surrounding data.
- Alerting: The error count crosses your preset threshold, and a notification is immediately sent to your team's Slack or Discord.
- Diagnosis: A developer clicks the link and gets a full report with the stack trace, user context, and frequency.
- Resolution: Armed with precise data, your team can pinpoint the root cause—a bad code push, a database issue, a wonky configuration—and deploy a fix in a fraction of the time.
This tight feedback loop shrinks the time between an error happening and your team fixing it. You lower your mean time to resolution (MTTR), minimize the impact on your users, and protect your business from the very real costs of downtime.
Advanced Strategies for Preventing Server Errors
Fixing an http 500 status code is all about reaction. But the real game-changer is building applications so resilient that these errors rarely happen in the first place. This is a fundamental shift from firefighting to fire prevention, where you weave quality and stability right into your development process from day one.
Think of it like constructing a skyscraper. You wouldn't just build it and wait for cracks to appear; you'd engineer a solid foundation and conduct rigorous inspections at every stage. By embracing a few key development and DevOps practices, you can build a system that sniffs out potential problems long before they ever reach a user.
Implement a Comprehensive Automated Testing Suite
Automated tests are your first and best line of defense against bugs. They're like a tireless QA team that works around the clock, running checks every time you change a single line of code. This ensures new features don't inadvertently break something that was already working perfectly.
A truly effective testing strategy has multiple layers:
- Unit Tests: These zoom in on the smallest bits of your code—like a single function—to make sure they work correctly in isolation.
- Integration Tests: These check how different parts of your application talk to each other. Does your app logic pull data from the database correctly? Integration tests will tell you.
- End-to-End (E2E) Tests: These mimic an entire user journey, from logging in to making a purchase, to catch any hitches in the complete workflow.
By automating these tests, you create a powerful safety net that drastically cuts the odds of a bug causing a 500 error in production.
Leverage Staging Environments for Safe Deployments
A staging environment is essentially a perfect clone of your live production server. It's your private sandbox where you can test code changes, update plugins, or tweak configurations without any risk to your actual users. Pushing changes directly to a live site is like performing surgery without any practice—the risk of a critical mistake is just too high.
With a staging environment, you can:
- Deploy your new code to an identical server setup.
- Run your entire suite of automated tests against this replica.
- Perform manual quality checks to spot any visual glitches or functional quirks.
Only after a change has been thoroughly poked, prodded, and proven stable in staging should it ever see the light of day on your production server. This one practice is among the most effective ways to stop deployment-related 500 errors in their tracks.
Enforce Peer Code Reviews
Even the most seasoned developers make mistakes. That's where code reviews come in. Having another developer on your team look over new code before it's merged provides a crucial second set of eyes. This collaborative check helps catch logic flaws, potential performance issues, and bad habits that the original author might have missed.
Code reviews are more than just bug hunting; they foster a culture of shared ownership and knowledge transfer. A simple question like, "Have you considered how this will handle a null value?" can be the difference between a stable feature and a future 500 error.
This process keeps the bar for code quality high and dramatically lowers the risk of introducing a server-crashing bug.
Conduct Regular Load Testing
A sudden flood of traffic is a great problem to have, but it can easily knock an unprepared server offline, causing resource exhaustion and a wave of 500 errors. Load testing is how you find out how your application behaves under that kind of pressure by simulating high-traffic events.
This process helps you pinpoint performance bottlenecks and discover your server's breaking point. Armed with that data, you can optimize your code, scale your infrastructure, and make sure your site stays snappy and reliable, even when it goes viral.
To take it a step further, you can explore the best website monitoring tools to keep a constant eye on performance. By combining these advanced strategies, you build a resilient application where the http 500 status code becomes a rare exception, not a recurring crisis.
Frequently Asked Questions About HTTP 500 Errors
Even after you get the hang of the HTTP 500 status code, some questions always seem to pop up in the middle of a late-night debugging session. Let's walk through a few of the most common ones I hear from developers and site owners.
Can a 500 Error Ever Be a Client-Side Issue?
Nope, never. It's a common point of confusion, but the 5xx family of errors is exclusively for server-side problems. The browser sent a perfectly fine request, but the server stumbled and couldn't complete it. The fault lies squarely with the server.
That said, a client's action can sometimes trigger a hidden bug on the server. Imagine a user submitting a form with an emoji in a field that was only expecting text. If the backend code doesn't know how to handle that character, it might crash and throw a 500 error. The problem isn't the user's input—it's the server's failure to handle it gracefully.
How Does a 500 Error Impact SEO?
Search engines like Google are all about user experience, and a broken site is a bad experience. A persistent 500 error is a massive red flag telling them your website is unreliable.
If a search crawler hits a 500 error on one of your pages a few times, it will likely drop that page from its index for a while. If the issue is site-wide and lasts for days, you can expect your rankings to take a serious hit. A quick blip that you fix in minutes won't cause lasting harm, but chronic instability is toxic for SEO.
A single 500 error is a hiccup; consistent 500 errors tell search engines your site is broken. Keeping your server healthy isn't just a tech issue—it's an SEO imperative.
Is a 502 Bad Gateway the Same as a 500 Error?
They're both server-side errors, but they point to different kinds of problems. A 500 Internal Server Error is a catch-all for when something breaks inside the main application server—think of a bug in your code or a misconfiguration.
A 502 Bad Gateway error is more specific and usually involves a multi-server setup. It happens when one server, acting as a proxy or gateway, gets a garbage response from another server it relies on. It’s like a store clerk telling you they can’t check their inventory because the warehouse computer is down. The clerk is fine; the problem is further up the chain.
Here’s a simple way to remember it:
- 500 Error: "I broke."
- 502 Error: "The server I was talking to for you broke."
What Is the Difference Between 4xx and 5xx Errors?
The line between them is simple: who's at fault?
4xx Client Error Codes: These mean the user did something wrong. The request itself was flawed.
- 404 Not Found: You asked for a page that doesn't exist.
- 401 Unauthorized: You need to log in to see this.
- 403 Forbidden: You're logged in, but you still don't have permission.
In all these cases, the server is basically saying, "I understood what you asked for, but you can't have it for this reason."
5xx Server Error Codes: These mean the user's request was perfect, but the server failed anyway. The server is admitting, "It's not you, it's me." The HTTP 500 status code is the most general confession of all, signaling some unexpected internal meltdown.
Can I Customize My Website's 500 Error Page?
Absolutely, and you really should. The default browser error page is ugly, unhelpful, and makes your brand look unprofessional. A custom error page lets you control the experience even when things go wrong.
A great custom 500 page should:
- Apologize in a friendly, human way.
- Reassure visitors that your team is already on the case.
- Offer a way out, like a link back to your homepage.
- Skip the technical jargon that will just confuse people.
This small touch transforms a frustrating dead end into a much more professional and reassuring moment for your users.
Don't wait for users to report problems. With Swetrix, you can proactively monitor your website's health, track every error in real time, and get instant alerts when a 500 error strikes. Take control of your site's stability by visiting https://swetrix.com to start your free trial today.