- Date
How to Track Micro Conversions: Complete Guide
 Andrii Romasiun
A visitor adds three items to their cart but never checks out. Another downloads your pricing PDF but doesn't request a demo. Both actions signal intent, yet most analytics setups treat them as dead ends. Track these micro conversions, and you see the path users take before they convert—or where they drop off.
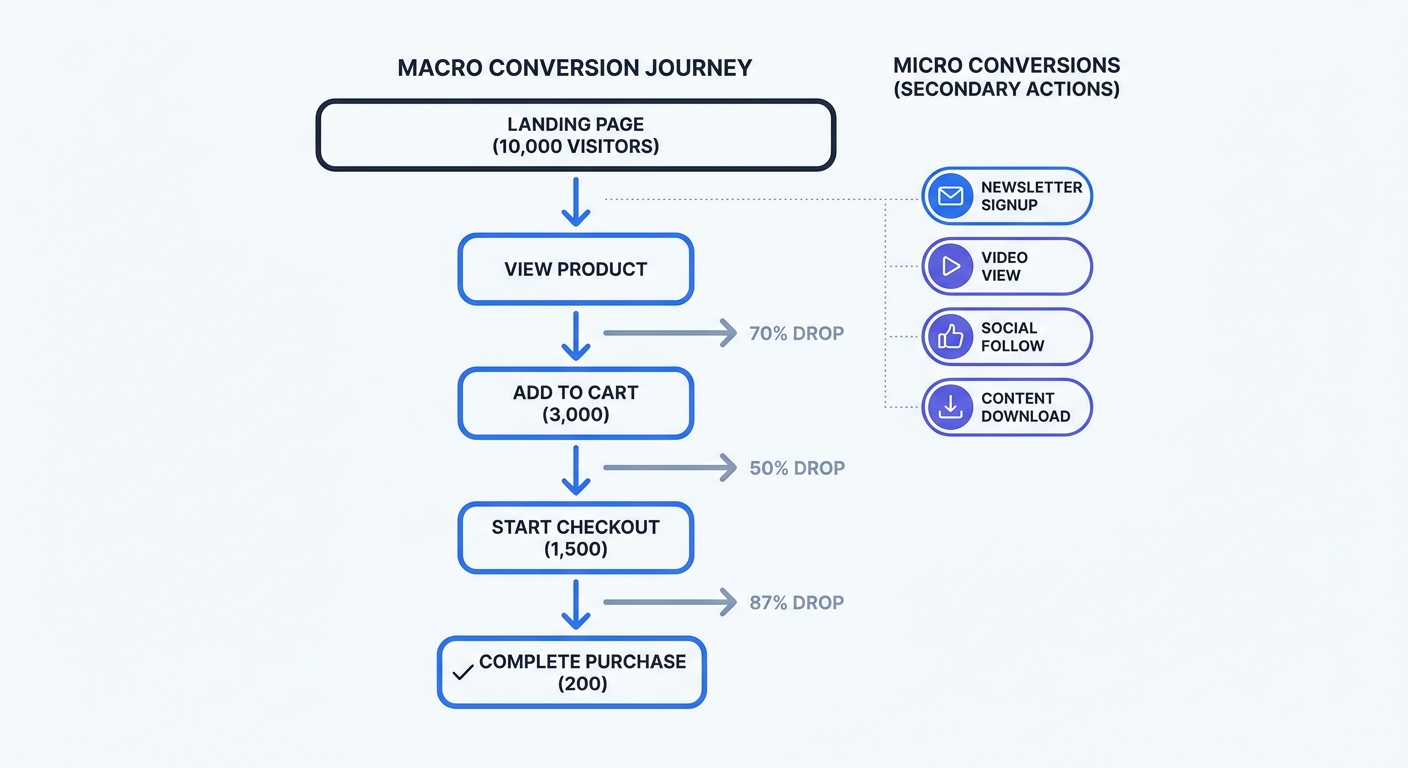
Micro conversions are the small steps visitors take toward your primary business goal. A purchase is a macro conversion. The actions leading up to it—viewing a product page, starting checkout, entering an email address—are micro conversions. Each one reveals whether users move forward or abandon the funnel.
Two categories define micro conversions. Process milestones mark linear progress: adding items to cart, filling out form fields, creating an account. Secondary actions indicate engagement without direct conversion intent: newsletter signups, video views, social media follows. Nielsen Norman Group's research separates these types because they serve different analytical purposes. Process milestones diagnose funnel friction. Secondary actions predict future conversions.
The business case for tracking both types is clear. The 2025 Forrester Global Customer Experience Index is a perception-based measure across CX dimensions tied to loyalty, showing that even minor improvements in customer experience reduce churn and increase share of wallet.
Map your customer journey into these two categories. Start with your macro conversion—a purchase, a qualified lead, a subscription signup. Work backward through every step required to reach that goal. Those are your process milestones. Then list actions that don't lead to conversion but suggest interest: content downloads, tool usage, repeat visits. Those are your secondary actions.
If you run an ecommerce store, process milestones include product page views, add-to-cart clicks, checkout initiation, and payment submission. Secondary actions include wishlist additions, review reads, size guide opens, and email signups. Each action carries different weight. A user who reaches checkout is closer to converting than one who only reads reviews.
Setting Up Micro Conversion Tracking in Google Analytics 4
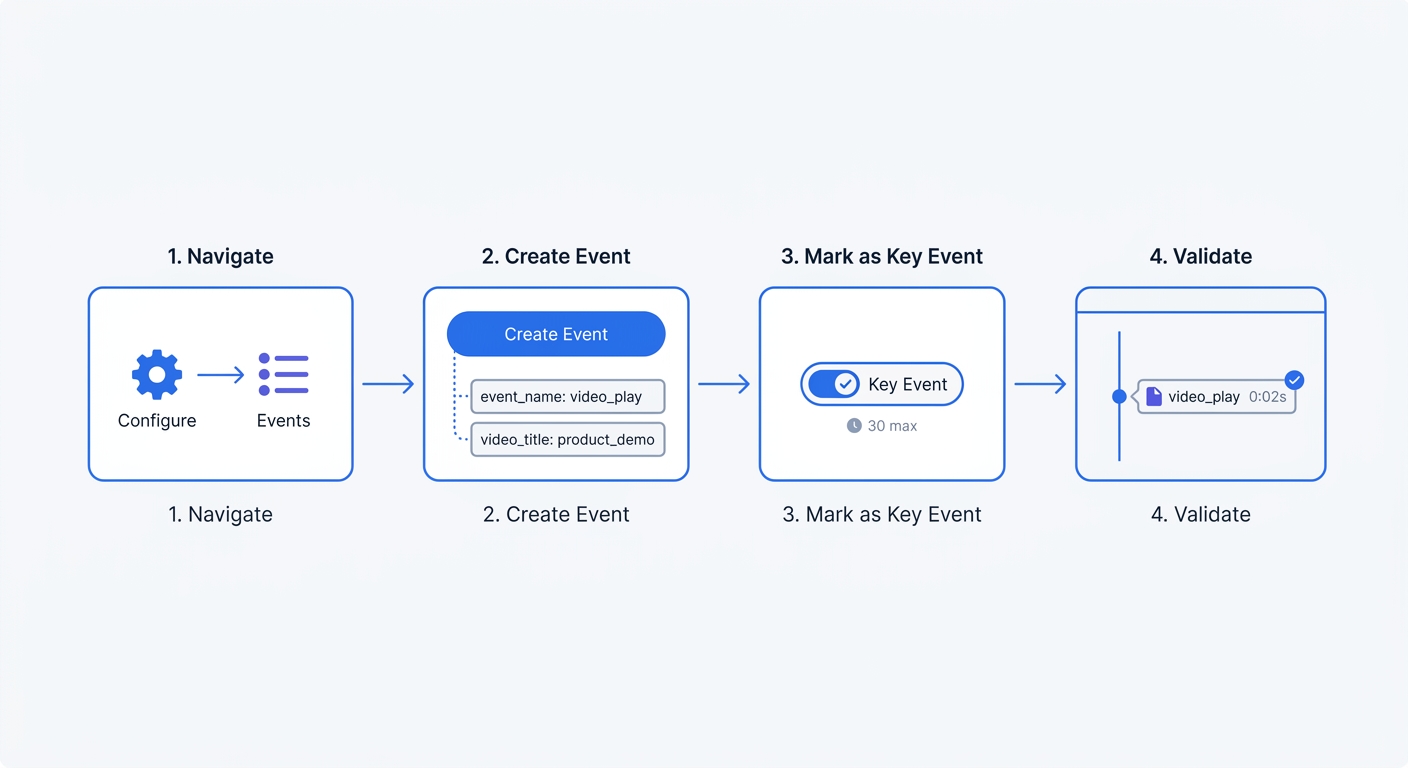
GA4 treats all conversions as events. Navigate to Configure > Events in your property settings. Click "Create event" to define a new micro conversion. Name it using a clear taxonomy: add_to_cart, video_play, form_start, pdf_download. Avoid generic names like click or action.
Each event accepts parameters that add context. An add_to_cart event might include item_name, item_category, and price. A video_play event could track video_title and video_duration. Parameters let you segment micro conversions by product type, content category, or user cohort.
After creating the event, mark it as a key event. GA4 allows up to 30 key events per property. The platform renamed "conversions" to "key events" in 2025, but the function remains identical. Key events appear in your conversion reports and feed data to Google Ads for campaign optimization.
Testing comes next. Open DebugView in GA4 by navigating to Configure > DebugView. Trigger the micro conversion on your site while DebugView runs. The event should appear within seconds, showing its name and all parameters. If nothing appears, check your event trigger conditions. A missing parameter or incorrect selector breaks the entire setup.
Use Google Tag Manager to implement events without touching site code. Create a trigger for the user action—a button click, a scroll depth threshold, a form submission. Attach a GA4 event tag to that trigger. Set the event name and parameters in the tag configuration. Publish the container, then verify in DebugView.
Common micro conversions to track in GA4:
add_to_cart: User adds product to shopping cartbegin_checkout: User starts checkout processview_item: User views product detail pagesearch: User performs site searchvideo_start: User plays video contentfile_download: User downloads PDF, ebook, or resourceform_start: User begins filling out formemail_signup: User subscribes to newsletteroutbound_click: User clicks external link
Each event requires a trigger. An add_to_cart event fires when the user clicks the "Add to Cart" button. A video_start event fires when the video player registers a play action. A form_start event fires when the user focuses on the first form field.
Alternative Tracking Tools for Privacy-First Analytics
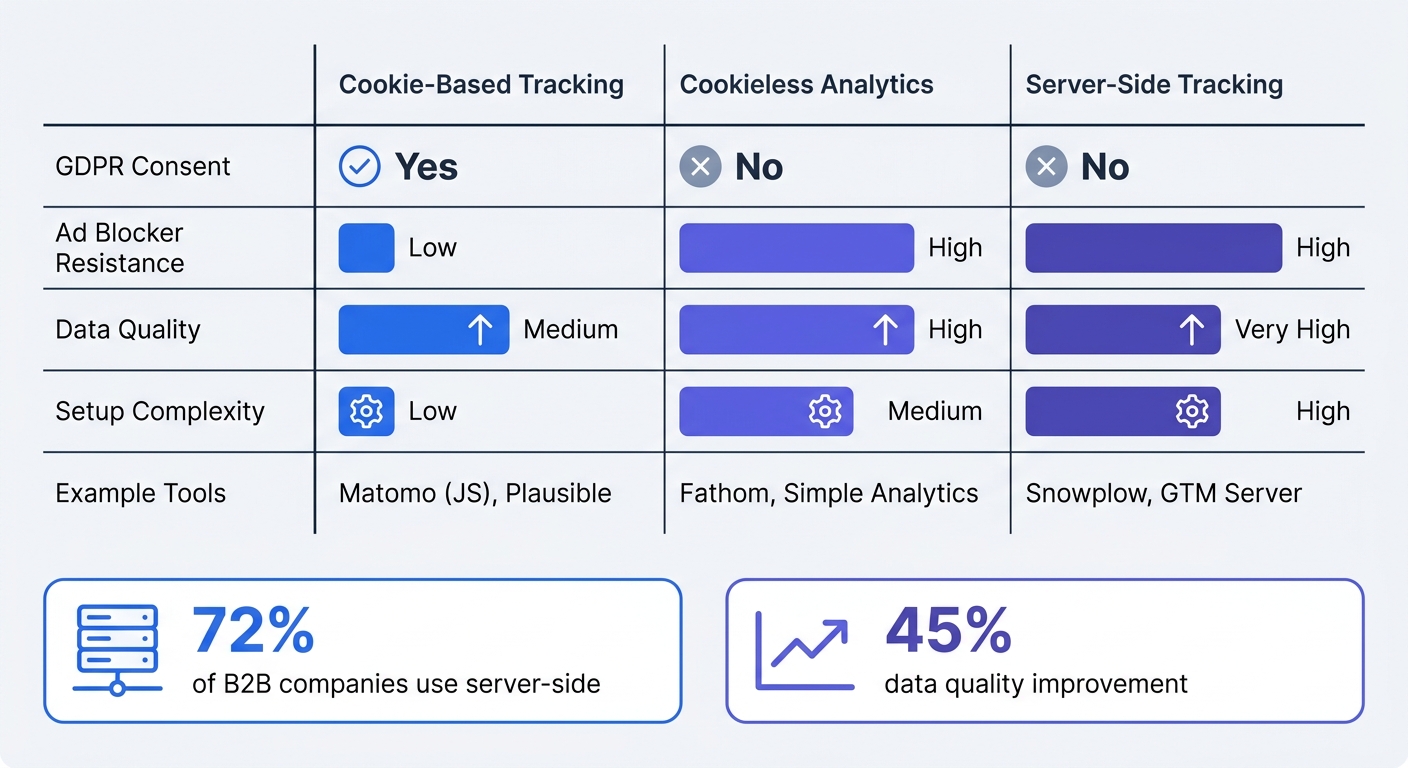
GA4 requires cookie consent in most jurisdictions. Cookieless analytics platforms bypass this requirement by tracking aggregate metrics without identifying individual users. Matomo, Plausible, and Swetrix offer event tracking without cookies or personal data collection.
Matomo's cookieless mode hashes browser attributes into a temporary identifier that groups pageviews into sessions. The hash resets every 24 hours, preventing long-term user tracking. France's data protection authority provides a conditional audience-measurement exemption for Matomo configured this way, requiring purpose limitation, IP anonymization, disabling cross-domain and third-party cookies, no User ID or ecommerce tracking when not aligned with conditions, and CNIL-aligned retention and lifespan limits. Set up custom events in Matomo through the tracking code or tag manager, the same way you would in GA4.
Server-side tracking moves data collection from the browser to your server. The user's browser sends a request to your domain, which forwards anonymized data to your analytics platform. Ad blockers can't intercept server-side requests because they originate from your infrastructure, not a third-party script. Server-side tracking offers improved data quality and completeness over client-side approaches.
Behavior analytics tools complement event tracking with visual data. Hotjar records user sessions and generates heatmaps showing where visitors click, scroll, and hover. Crazy Egg overlays click data on your page layout. These tools reveal friction points that raw event counts miss. A high form_start count paired with low form_submit suggests users abandon mid-form. Session recordings show where they stop.
Evaluate your current setup against privacy regulations. If you operate in the EU, UK, or California, cookie-based tracking requires explicit consent. Consent banners reduce data collection by 20-40% because users decline tracking. Cookieless alternatives collect data from all visitors without consent requirements, giving you complete traffic visibility.
Swetrix tracks micro conversions through custom events without cookies or personal data. Create an event in your dashboard, add the tracking code to your site, and the platform counts each occurrence. Filter events by page, referrer, or device type. Export data to CSV for deeper analysis. The platform runs on first-party infrastructure, so ad blockers don't interfere with tracking.
Best Practices for Effective Micro Conversion Tracking
Track fewer events with higher business value. Identify micro conversions that correlate with macro conversions. If users who watch product videos convert at 3x the rate of those who don't, video_play is a high-value event. If social media follows show no correlation with purchases, skip tracking them.
Implement a clear event taxonomy. Distinguish between an add_to_cart event triggered on a product page versus one triggered by a promotional popup. Use parameters to capture this context: add_to_cart with source: product_page versus add_to_cart with source: promo_popup. Consistent naming prevents data fragmentation. A campaign tagged spring-sale in one place and Spring_Sale in another splits your data into separate rows.
Segment micro conversions by user cohorts. Retention patterns differ by signup date, subscription tier, and traffic source. Users who signed up three months ago might convert at different rates than those who joined last week. Filter your micro conversion data by cohort to spot disengagement early. If free-tier users reduce their export_file events within 30 days, that signals upcoming churn.
Funnel analysis shows where users drop off. If 10,000 visitors result in 200 purchases (2% conversion rate), break down the intermediate steps. Suppose 3,000 visitors add items to cart, 1,500 start checkout, and 200 complete purchase. The biggest drop-off happens between cart and checkout (50% loss), not between product page and cart (70% loss). Focus optimization efforts on the checkout flow, not product pages.
| Funnel Stage | Visitors | Drop-off Rate |
|---|---|---|
| Landing Page | 10,000 | — |
| Product View | 5,000 | 50% |
| Add to Cart | 3,000 | 40% |
| Start Checkout | 1,500 | 50% |
| Complete Purchase | 200 | 87% |
The table reveals checkout as the critical friction point. Users who reach that stage are motivated, yet 87% abandon. Investigate form length, payment options, shipping costs, and trust signals on the checkout page.
Test your tracking setup before launching campaigns. Trigger each micro conversion and verify it appears in your analytics dashboard. Check that parameters populate. A video_play event without a video_title parameter loses valuable segmentation data. Run through your entire funnel—landing page to macro conversion—and confirm every micro conversion fires at the right moment.
Audit your existing events quarterly. Remove low-value events that clutter reports without driving decisions. If you track 50 events but only reference 10 in monthly reviews, delete the other 40. Fewer events mean faster report loading, clearer dashboards, and less maintenance overhead.
Using Micro Conversion Data to Optimize Your Funnel
A/B test micro conversions instead of macro conversions when sample size is limited. Testing a product page change using purchases as the success metric might require 10,000 visitors per variant to reach statistical significance. Testing the same change using add_to_cart clicks as the metric might need only 2,000 visitors because more users add to cart than purchase. Higher event volume means faster test results.
Build retargeting campaigns around micro conversions. Users who added items to cart but didn't purchase are warm leads. Serve them ads featuring the products they viewed. Abandoned cart emails deliver strong performance, with open rates around 40% and conversion rates near 11% according to industry benchmarks. Segment your email list by micro conversion: users who downloaded a whitepaper receive different messaging than those who watched a product demo.
Mobile optimization matters because 55% of traffic comes from mobile devices, yet mobile cart abandonment reaches 75.5% compared to around 70% on desktop. Micro conversion tracking reveals where mobile users struggle. If form_start events are high but form_submit events are low on mobile, the form is too long or difficult to complete on small screens. Reduce form fields, enable autofill, and add a progress bar.
Form optimization follows a simple rule: users abandon after five questions. Track form_start and form_submit as separate events. Calculate the abandonment rate. If 1,000 users start the form but only 300 submit, 70% abandon. Add a form_field_focus event for each field to see where users drop off. If most users complete the first three fields but abandon at field four, that field needs simplification or removal.
Personalization uses micro conversion data to tailor the user experience. A visitor who watched three product videos but didn't purchase sees different homepage content than one who only read blog posts. Micro conversions reveal intent. Video watchers are evaluating features. Blog readers are researching solutions. Serve product-focused content to the first group and educational content to the second.
Advertising platforms optimize better with micro conversion data. Google Ads and Facebook Ads struggle when macro conversions are rare. If your site generates 10 purchases per week, the algorithm lacks data to identify high-intent users. Feed micro conversions like add_to_cart or video_play into the platform as secondary conversion events. The algorithm learns which users engage, then targets similar audiences.
Privacy Compliance and Cookieless Tracking
GDPR requires explicit consent for cookie-based tracking. A consent banner asking users to accept cookies reduces data collection by 20-40% because many users decline. Cookieless tracking eliminates this data loss by measuring aggregate metrics without identifying individuals.
Matomo's cookieless configuration hashes browser attributes—user agent, screen resolution, language settings—into a temporary identifier. This identifier groups pageviews into sessions without storing personal information. The hash resets every 24 hours, preventing long-term tracking. France's CNIL confirmed this approach is exempt from consent requirements because it doesn't track individuals.
Server-side tracking moves data collection from the browser to your server. The user's browser sends a request to your domain—yoursite.com/track—which forwards anonymized data to your analytics platform. Ad blockers target third-party scripts like googletagmanager.com but don't block requests to your own domain. Server-side tracking captures data from 100% of visitors, including those using ad blockers.
First-party data collection gathers information from user interactions. Email signups, account registrations, and purchase history are first-party data. Track these as micro conversions to build a customer profile without third-party cookies. A user who signs up for your newsletter, downloads a whitepaper, and requests a demo has provided three data points voluntarily. Use this data to personalize their experience and predict conversion likelihood.
GA4's behavioral modeling estimates user actions when consent is denied. The platform analyzes trends between users who accept cookies and those who don't, then uses machine learning to fill data gaps. If 60% of users accept cookies and 40% decline, GA4 models the behavior of the 40% based on patterns from the 60%. Accuracy varies, but modeling reduces the data loss from consent declines.
Implement a cookie consent banner if you use cookie-based tracking. The banner must appear before any tracking scripts load. Users must click "Accept" for consent to be valid. Pre-checked boxes and implied consent don't meet GDPR standards. If a user declines, disable all non-essential cookies and tracking scripts.
Transition to cookieless tracking to eliminate consent requirements. Swetrix, Plausible, and Matomo in cookieless mode collect data without cookies or personal identifiers. These platforms count events and group them into sessions using privacy-preserving methods. No consent banner is required because no personal data is processed.
Measuring Micro Conversion Success
Calculate micro conversion rate by dividing micro conversions by total visitors. If 50 people visit your blog and 10 subscribe to your newsletter, the micro conversion rate is 20% (10 ÷ 50 × 100). Track this rate over time to measure optimization efforts. A rate increase from 20% to 25% after redesigning your signup form proves the change worked.
Benchmark your rates against your own historical data, not industry averages. Conversion rates vary by traffic source, industry, and product type. Your rates might be higher or lower depending on your audience and offer. Focus on improving your own numbers month over month.
Cohort analysis compares micro conversion rates across user segments. Users who arrive from paid search might convert at different rates than those from organic social. Break down your micro conversions by traffic source, device type, and user tenure. If mobile users have a 50% lower form_submit rate than desktop users, prioritize mobile form optimization.
Set up automated reports that track key micro conversions weekly. Monitor trends rather than absolute numbers. A sudden drop in add_to_cart events might indicate a broken button or a technical issue. A gradual decline suggests changing user behavior or increased competition. Investigate anomalies and track trends for strategic planning.
Correlation analysis identifies which micro conversions predict macro conversions. Calculate the conversion rate for users who complete each micro conversion versus those who don't. If users who watch product videos convert at 12% while those who don't convert at 3%, video views are a strong predictor. Prioritize optimizing and promoting high-correlation micro conversions.
Common Micro Conversion Tracking Mistakes
Tracking too many events clutters your reports and slows decision-making. Limit yourself to 10-15 micro conversions that inform optimization decisions. If you never reference an event in meetings or reports, delete it. More data doesn't mean better insights when most of it goes unused.
Inconsistent naming conventions fragment your data. A campaign tagged summer_sale in one place and Summer-Sale in another creates two separate data rows. Establish naming rules before launching any campaign: lowercase, underscores instead of hyphens, no spaces, descriptive names. Document these rules in a shared spreadsheet.
Failing to test events before launching campaigns wastes ad spend. A broken add_to_cart event means you can't measure which ads drive cart additions. Test every event in DebugView or your platform's real-time reporting before going live. Trigger the action and verify the event appears with correct parameters.
Ignoring mobile-specific issues costs conversions. Mobile users behave different from desktop users. They scroll less, abandon forms faster, and prefer simpler interfaces. Track micro conversions separately by device type. If mobile form_start events are high but form_submit events are low, the form doesn't work on mobile.
Not segmenting by traffic source hides performance differences. Paid search traffic might convert at 5% while organic social converts at 1%. Aggregate data showing 3% conversion masks this gap. Break down every micro conversion by source, medium, and campaign. Allocate budget to high-performing channels and fix or cut low-performing ones.
Micro conversion tracking transforms analytics from a passive reporting tool into an active growth strategy. Set up events for the actions that matter, test them, and use the data to optimize every step of your funnel. Start with three high-value micro conversions: one process milestone, one secondary action, and one that predicts macro conversions.
Try Swetrix free for 14 days—no credit card required. Track unlimited events, get real-time reports, and keep your data private with cookieless analytics that works everywhere.