- Date
How to Set Up Simple AB Testing Without Cookies
 Andrii Romasiun
Marketers who run structured experiments earn higher returns. Cross-industry reports indicate A/B tests achieve a 36.3% win rate and generate a 2.77% median revenue uplift for e-commerce sites, though these figures vary depending on the specific industry and content type. Legacy testing tools require third-party cookies to track users across variants.
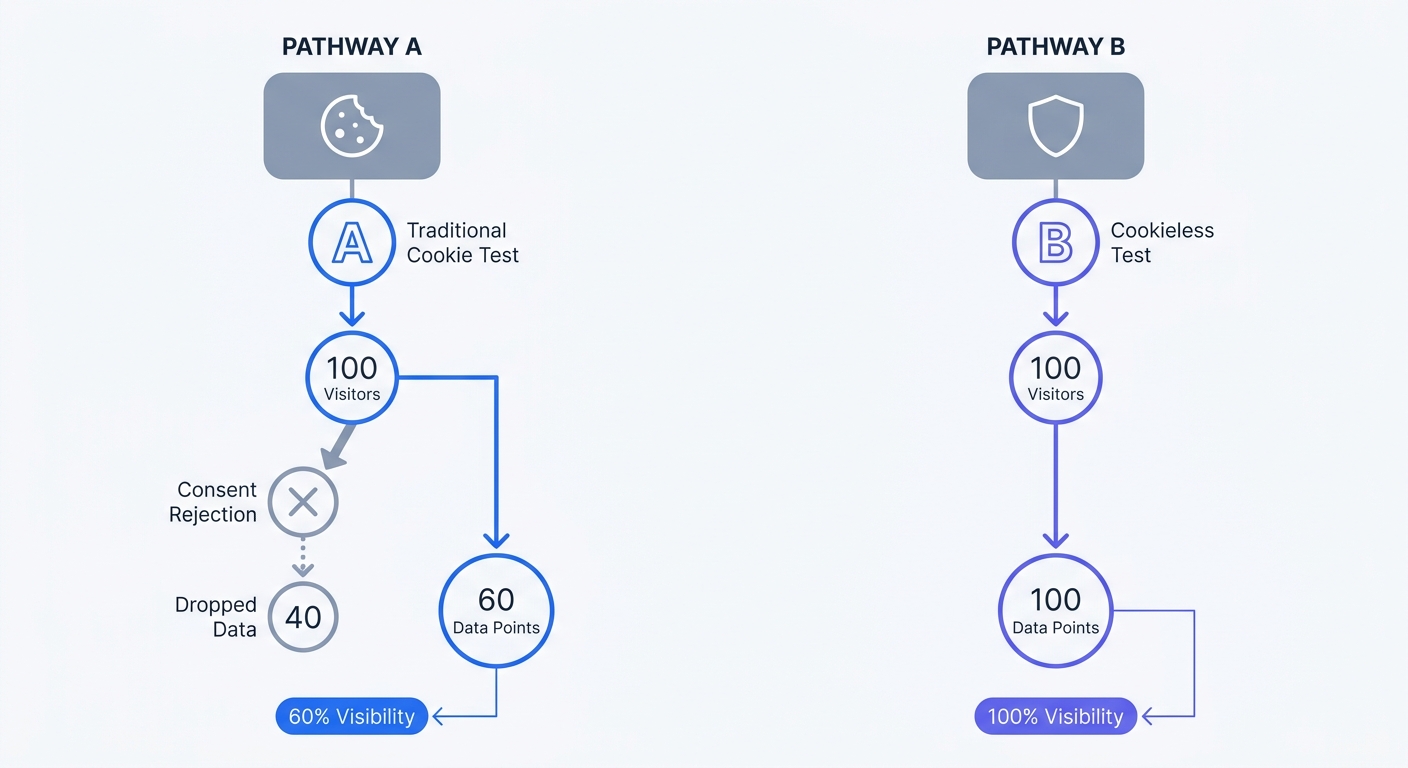
When European visitors encounter your consent banner, many decline tracking. You lose up to 40% of the testing sample immediately. This missing data skews the results and invalidates optimization efforts.
Learning how to set up simple ab testing without cookies solves this problem. Swap client-side JavaScript for cookieless tracking to guarantee a 100% accurate sample size. Platforms like Swetrix protect user privacy while delivering precise conversion metrics.
Why You Need to Know How to Set Up Simple AB Testing
Guessing wastes traffic. Building a new feature or rewriting a sales page takes resources. Launching unverified changes creates unnecessary risk. Testing provides a mathematical framework to validate business decisions.
The Problem with Traditional Cookie Banners
Legacy testing platforms assign user identifiers via client-side cookies. These tools must recognize returning visitors to show them the same page variant every time. Under GDPR and the ePrivacy Directive, these identifiers qualify as personal data.
You must request explicit opt-in consent before the testing script executes. If a user rejects cookies, the tool fails to track them. The visitor consumes content and completes a purchase, but the testing platform records nothing.
This selective data loss creates a consent skew. Test results reflect the behavior of a biased audience segment. Deploying a winning variant based on skewed samples often leads to revenue drops.
Cookieless testing bypasses this roadblock. First-party, privacy-by-design systems randomize traffic without storing persistent identifiers on a device. Every visitor participates in the test, which keeps the dataset intact.
Step 1: Pre-Qualify Your Hypotheses with Analytics
Testing without data wastes resources. Marketers should build experiments based on actual user behavior rather than creating random homepage variations.
Open your analytics dashboard and look for conversion bottlenecks. A bottleneck is a page with high traffic and a high exit rate. Find the specific moment visitors abandon the purchasing journey using funnel analysis tools.
Analyzing Your Current Traffic
Start by reviewing your top landing pages. Use your analytics dashboard to filter pages by unique views over the past 30 days.
Sort the list in descending order. Identify pages that receive at least 1,000 unique visitors per month. Low-traffic pages take months to reach statistical significance.
Check the conversion rate for each high-traffic page. If an ad campaign drives 5,000 visitors to a pricing page but few convert, you have found a testing target.
Identifying Conversion Bottlenecks
Pinpoint the friction on the page. Friction is anything that stops the user from clicking the call-to-action button. Common sources include:
- Confusing headlines that fail to explain the value proposition
- Hidden pricing structures
- Forms requiring excessive fields
- Lack of trust signals or customer reviews
- Slow page load times caused by heavy scripts
Turn your observation into a testable hypothesis. Formulate an "If X, then Y" statement.
- Observation: Visitors abandon the checkout page after seeing the shipping cost.
- Hypothesis: If we move the shipping calculator to the product page, checkout completion will increase because buyers understand the total cost before entering the funnel.
Another example targets trust.
- Observation: The lead capture form has a 2% submit rate.
- Hypothesis: If we add customer logos above the form, submission rates will rise because the logos provide immediate social proof.
Step 2: Choose One Variable to Change
Control forms the foundation of scientific testing. Changing multiple elements at once destroys that control.
If you change the headline, the button color, and the background image on a landing page, conversions might increase by 15%. Analysts cannot determine which change drove the lift. A single test cannot attribute success to the red button versus the new headline.
A/B Testing vs. Multivariate Testing
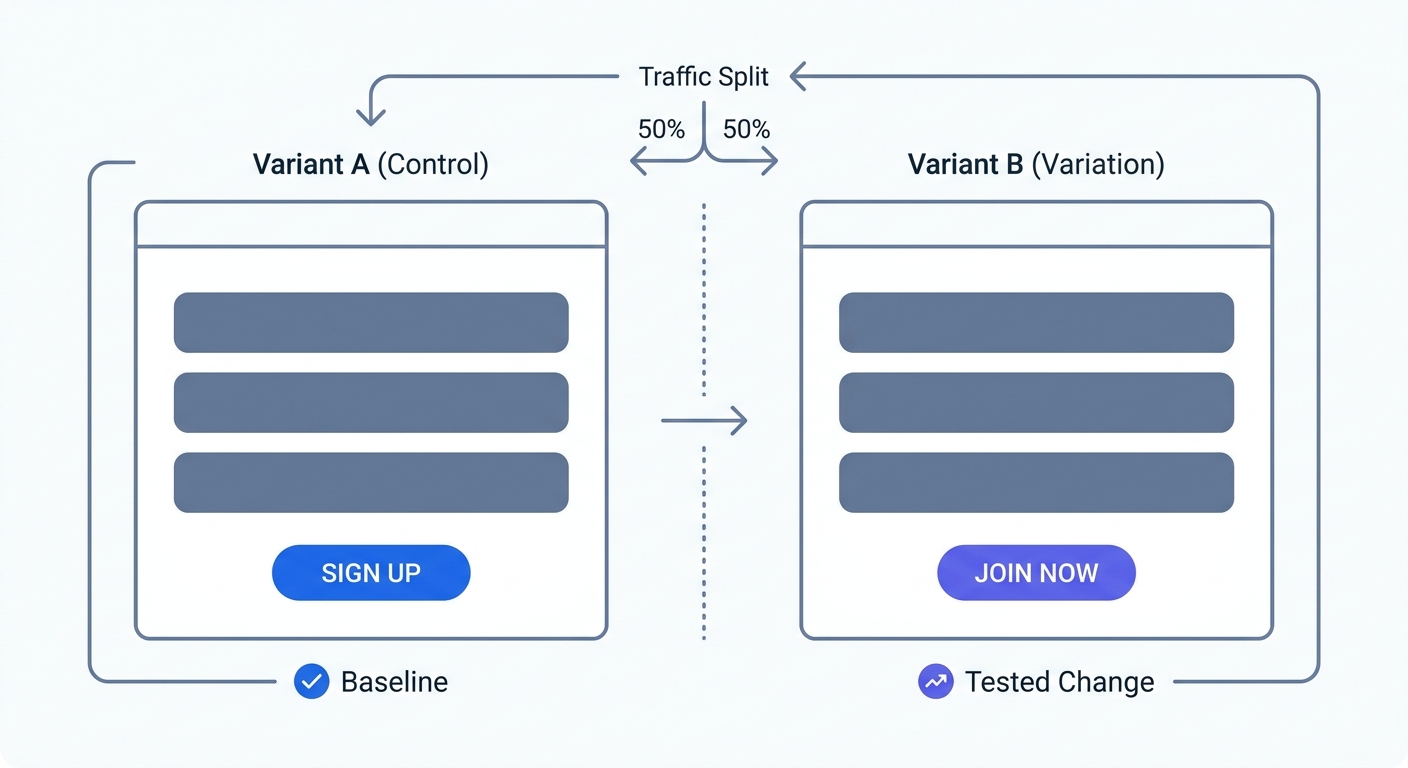
A simple A/B test compares two versions of a page (Variant A and Variant B). The versions remain identical except for one specific variable.
Multivariate testing changes several variables simultaneously to find the best combination. This method requires massive amounts of traffic to yield valid results. A multivariate test with three headlines and three button colors creates nine different combinations. Marketers need nine times the traffic to reach statistical significance.
Stick to A/B testing for initial optimization. It requires less traffic, finishes faster, and delivers clear answers.
The Best Elements for Beginners to Test
Start with high-impact elements above the fold. These changes require minimal coding and yield measurable results.
Call-to-Action (CTA) Copy Button text dictates action. Swap generic commands like "Submit" or "Click Here" for value-driven phrases. Test "Get My Free Guide" against "Download Now." Make the benefit explicit.
Headlines The headline is the first thing users read. Test a feature-focused headline against a benefit-focused one.
- Variant A: Our Analytics Platform Tracks Traffic
- Variant B: See Who Visits Your Site Without Cookies
Trust Signals and Social Proof Buyer hesitation ruins conversions. Add trust elements near the purchase button to reduce anxiety. Test the inclusion of star ratings, customer quotes, or security badges.
Pricing Display Test how you present costs. Compare monthly billing versus annual billing defaults. Test the order of pricing tiers, placing the most expensive option on the left.
| Element | What to Test | Expected Impact |
|---|---|---|
| Headline | Clarity vs. Curiosity | High |
| CTA Button | Action vs. Value | High |
| Hero Image | Product Shot vs. Human Face | Medium |
| Form Fields | 5 fields vs. 3 fields | High |
| Navigation | Visible vs. Hidden (on landing pages) | Medium |
Step 3: Run Your Cookieless Test Safely
Execution determines data quality. Delivery mechanisms matter as much as the variables tested.
Developers are abandoning client-side JavaScript testing. Client-side tools load the original page and execute a script to swap elements. This process causes a flicker effect. The user sees the old headline for a brief moment before the new one appears. Flicker damages user trust and skews behavior.
Selecting a Privacy-Native Platform
Choose a platform designed for modern regulatory environments. Legacy tools offer privacy modes while maintaining default architectures reliant on browser storage.
Privacy-native tools process test assignments without writing identifiers to a device. When a request hits the server, the testing logic allocates the user to a variant and delivers the modified HTML in milliseconds.
This server-side approach eliminates the flicker effect and ensures fast page load speeds. Because developers store no personal data on the device, sites bypass the cookie banner under legitimate interest.
The Power of Server-Side Tracking
Tracking the performance of variants requires a cookieless analytics backend. Swetrix handles this using rotating daily hashes.
The system combines the user's IP address and User-Agent string, applies a cryptographic hash, and adds a daily rotating salt. The resulting string groups pageviews into a session. At midnight, the salt changes and the hash resets, which anonymizes yesterday's visitor.
This methodology tracks test conversions with precision within a single session without violating user privacy. Site owners gain complete visibility into Variant B's performance without forcing users through a consent wall.
Append custom event tags to variation buttons to track the test in Swetrix. Set up a tracking plan matching the variants.
- Open your website's source code.
- Locate the CTA button in Variant A.
- Add the Swetrix tracking attribute:
swetrix-event="clicked_cta_variant_a". - Locate the CTA button in Variant B.
- Add the attribute:
swetrix-event="clicked_cta_variant_b".
The dashboard tallies these custom events in real time. Analysts compare conversion volumes against the total pageviews for each variant.
Step 4: Validate Your Tracking Setup
Broken tracking ruins perfect experiments. You must run a thorough quality assurance process before routing live traffic to a test.
Create a staging environment or use a staging URL. Open the variant pages in a fresh incognito browser window. Click the specific buttons containing the tracking attributes.
Open the analytics dashboard to verify the custom events register. If clicking the Variant B button records a Variant A event, revise the code. Fix these attribution errors before launch.
Check the website across different devices. A headline change might fit a desktop monitor while breaking the layout on a mobile screen. Ensure the responsive design holds up. If the mobile layout breaks, users bounce, and the test data reflects a technical error.
Test site speed. Adding extra scripts or complex server-side logic increases time-to-first-byte. Analysts use performance monitoring metrics to determine if the test variant loads slower than the control. A slower variant loses, regardless of copy improvements.
Step 5: Wait for Statistical Significance
Impatience ruins valid experiments. Checking the dashboard an hour after launching a test provides zero value.
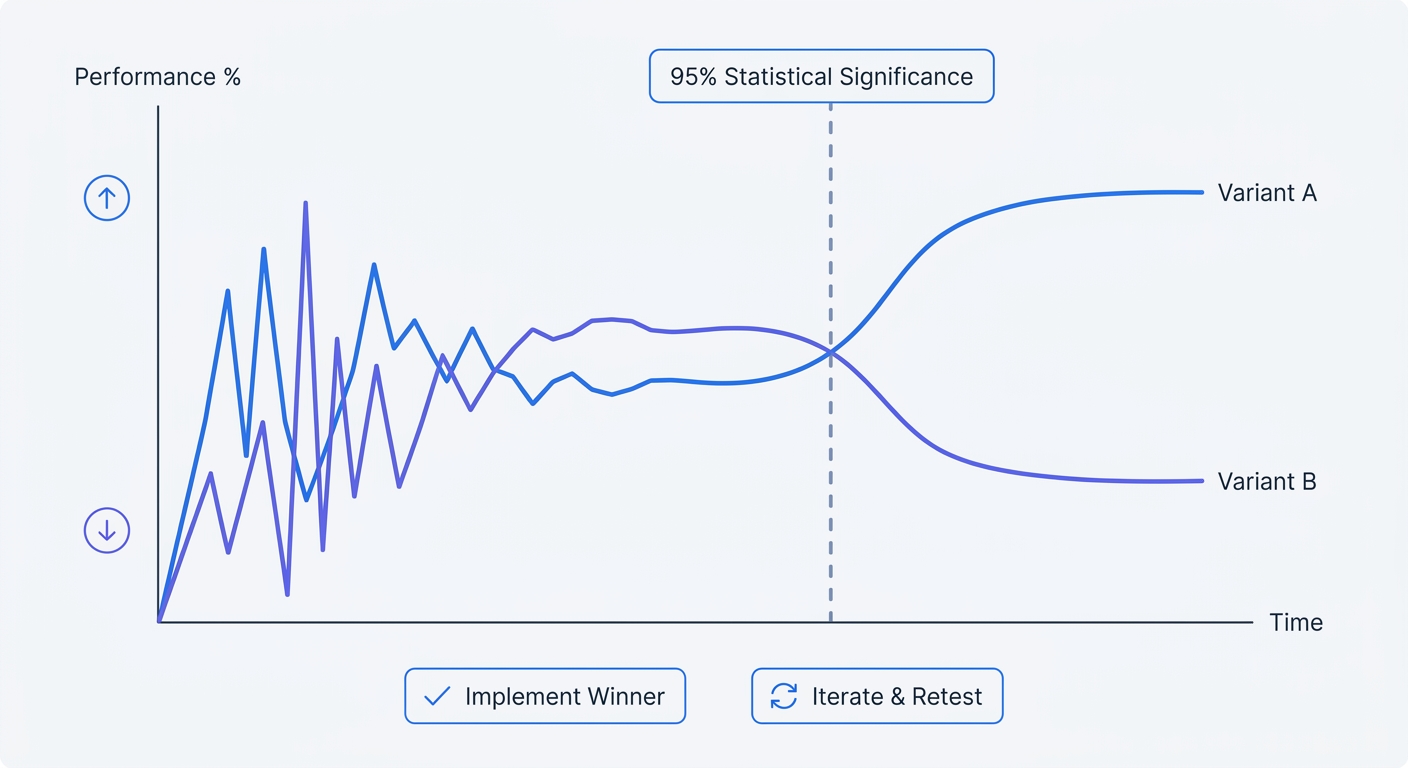
Initial data fluctuates. Variant B might secure five conversions in the first ten minutes, but Variant A pulls ahead two days later. Statisticians call this phenomenon regression to the mean. Let the test run until the math proves the result is stable.
Understanding the 95% Confidence Rule
Statistical significance measures the probability that the difference between variants is statistically valid.
The industry standard requires 95% confidence. This threshold indicates a 5% chance the observed conversion lift happened by coincidence. Never declare a winner until the testing calculator confirms the metric.
Stopping a test at 80% confidence to push a new design live risks implementing a losing variation. Wait for the data to stabilize.
Run every test for at least two full business cycles. Traffic behaves differently on weekends compared to weekdays. A 14-day minimum ensures the sample includes all typical user behaviors. Sites with lower traffic volume might need four weeks to hit the 95% mark.
Margin of Error Explained
Confidence intervals include a margin of error. This metric defines the range containing the true conversion rate.
If Variant B has a 10% conversion rate with a 2% margin of error, the true conversion rate for the total population sits between 8% and 12%.
Aim for a margin of error under 5%. High margins indicate a small sample size. Test results lack reliability if the margin of error remains high upon completion. Extend the test duration to collect more data or test a radical change that produces a clear contrast in user behavior.
Use tools like the Swetrix A/B Test Calculator to check the numbers. Input the total visitors and total conversions for both the control and the variation. The calculator runs the complex binomial logic and provides a definitive pass or fail.
Step 6: Implement the Winner and Retest
Concluded tests demand action. Document the results in a shared company log. Include the hypothesis, runtime, sample size, and final conversion rates.
Deploy the changes to the live production environment if Variant B wins. Route 100% of traffic to the new design. Monitor the baseline conversion rate in the analytics dashboard over the next week to confirm the uplift holds outside the testing environment.
Losing tests and ties provide valuable insight. The hypothesis failed. The changed element does not influence user behavior.
Formulate a new hypothesis targeting a different section of the page. If changing the button color yielded no result, try rewriting the hero headline. Testing requires an ongoing cycle where each experiment refines audience understanding.
Documenting Your Testing Archive
Keep a record of every failed test. New team members will suggest ideas the company already evaluated. An accessible testing archive prevents the team from repeating past mistakes.
Create a spreadsheet with columns for the test date, URL, variable changed, statistical outcome, and key takeaway. If removing a pricing table decreased signups by 15%, document that the audience requires upfront cost transparency before committing to a free trial.
Scale the testing program over time. After mastering the mechanics of changing single variables on landing pages, apply the same cookieless tracking principles to email marketing campaigns and onboarding flows.
Stop losing half the testing data to rejected cookie banners. Swetrix provides accurate, cookieless web analytics that track every conversion without compromising user privacy. The platform is open source, independent, and built in the EU. Start a 14-day free trial to build optimization campaigns on verified data.