- Date
How to Reduce Page Load Time by Cutting Script Bloat
 Andrii Romasiun
A visitor taps a link on a smartphone. The screen remains blank for three seconds, prompting them to close the tab and purchase from a competitor. Developers spend weeks compressing images and minifying stylesheets to fix failing performance scores. Third-party marketing scripts cause this rendering bottleneck. Learn how to reduce page load time by clearing out legacy tags, removing consent banners, and deploying lightweight web analytics.
The Business Impact of Slow Websites
Benchmarking Page Load Time in 2026
Google engineers define performance standards based on real-world browser telemetry. The Chrome User Experience Report documents an average mobile load time of 1.9 seconds. Desktop environments average 1.7 seconds.
Shoppers demand fast responses across retail sites, with 47% of e-commerce users expecting visual completeness in under two seconds. Tolerance varies by industry and content type, but B2C buyers abandon sessions at high rates if screens remain blank past the 3-second mark. Pull up your bounce rate metrics and segment them by device type. A spike in abandonment appears on cellular networks when server response times degrade.
Conversion Decay and Session Frustration
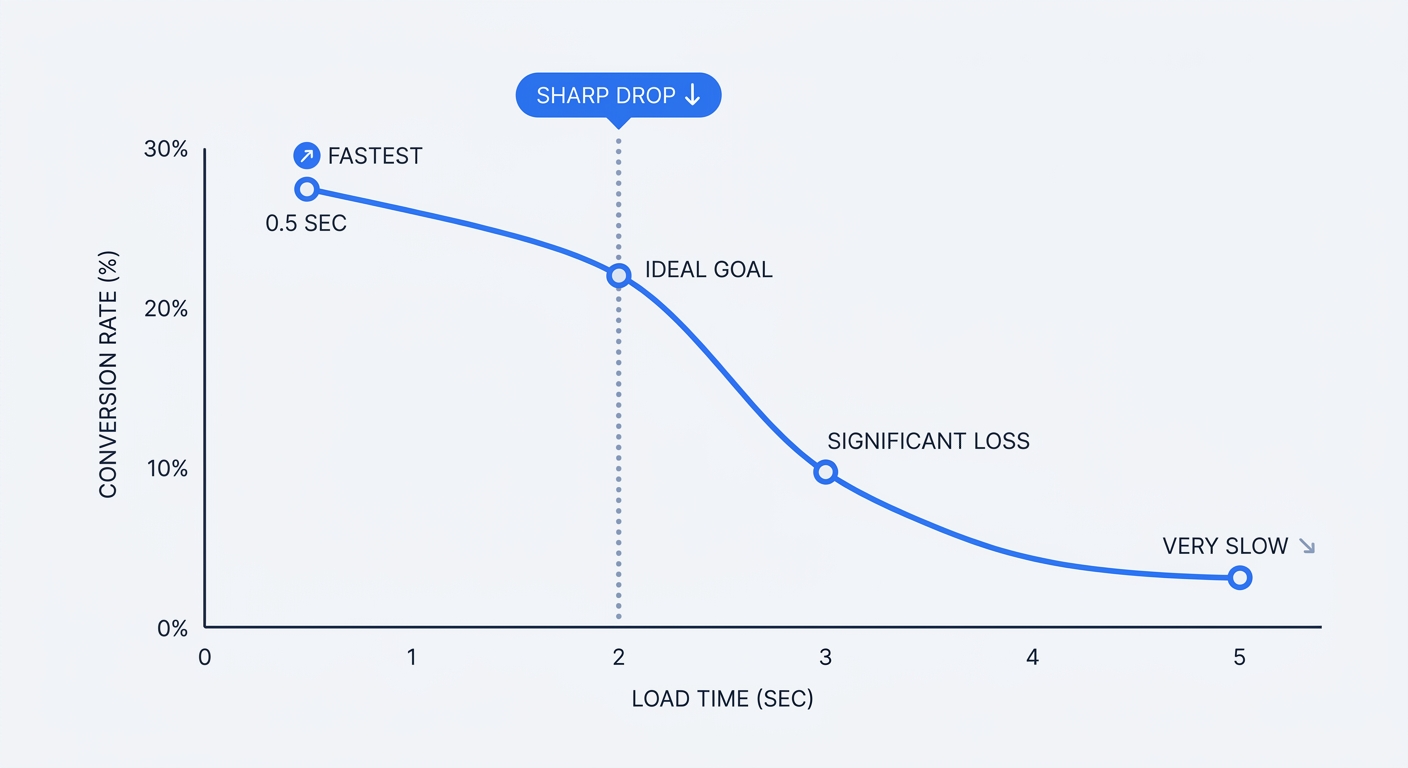
Organizations lose revenue as rendering speed slows. While exact conversion decay varies by industry and content type, enterprise operations face steep penalties, as business buyers convert three times more often on a 1-second B2B site compared to a 5-second B2B site. Calculate the potential revenue loss using an ROI calculator to justify developer hours spent on optimization.
Lagging interfaces break the user journey. Analysts classify interactions taking longer than three seconds as "session frustration," a technical friction impacting 40% of all global web sessions. Frustrated visitors do not wait for the JavaScript to execute before leaving the domain.
The Hidden Cost of Third-Party Tracking Scripts
The Performance Toll of Google Analytics
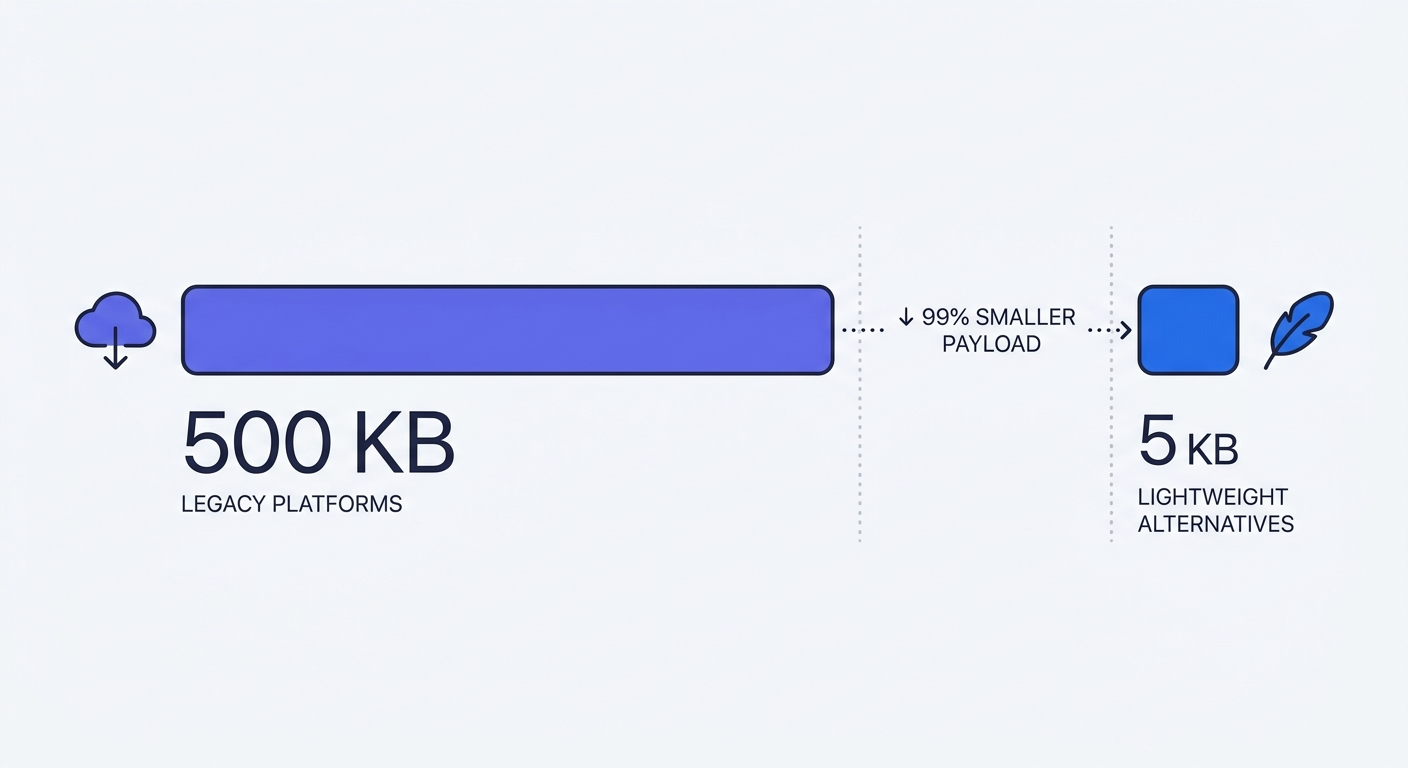
Client-side tracking scripts force the browser to execute multiple complex tasks before displaying readable text. The standard Google Analytics 4 tag downloads 134 KB of compressed code to the user's device, expanding to 400 KB upon extraction.
Browsers must halt rendering to process this payload. The engine performs external DNS lookups, negotiates TLS handshakes with Google servers, and parses thousands of lines of JavaScript. Open the network tab during a page load to observe the bottleneck. Legacy analytics tools trigger four or more HTTP requests to record a single page view.
Administrators extract the same visitor insights using a fraction of the resources. Modern analytics scripts weigh under 3 KB and require one network request. Replace corporate tools with a Google Analytics alternative to shave hundreds of milliseconds off the Time to First Byte.
Cookie Consent Banners and Core Web Vitals
Consent Management Platforms (CMPs) degrade performance scores. European privacy laws mandate that site administrators must block tracking cookies until the visitor clicks an "Accept" button. Teams install heavy consent banners to manage this legal logic.
These banners load at the beginning of the rendering path and become the Largest Contentful Paint (LCP) element on the screen. Performance engineers document cases where installing a CMP pushed a site's LCP from a passing 1.43 seconds to a failing 3.61 seconds.
Browsers struggle to render the banners, causing layout shifts. When a visitor taps the "Accept" button, the CMP fires JavaScript to inject the delayed tracking pixels. The resulting CPU spike freezes the interface. Bypassing the cookie requirement provides a competitive advantage. Deploy cookie-free analytics to eliminate the legal need for a CMP. Removing the banner unblocks the main thread and speeds up initial rendering.
Mastering Core Web Vitals and INP
The Shift from FID to INP
Interaction to Next Paint (INP) replaced FID in March 2024. Google algorithms use INP to evaluate rendering responsiveness. Engineers designed the previous FID metric to measure the delay of the first click on a page. This narrow focus left a blind spot for interactive single-page applications.
The new standard enforces responsiveness boundaries throughout the user session. Site owners must maintain an INP score under 200 milliseconds to pass the Core Web Vitals assessment. The algorithm times the gap between a user tapping a button and the browser painting the resulting interface change. If the server takes 300 milliseconds to highlight a clicked navigation link, the domain fails the test.
How Scripts Sabotage INP
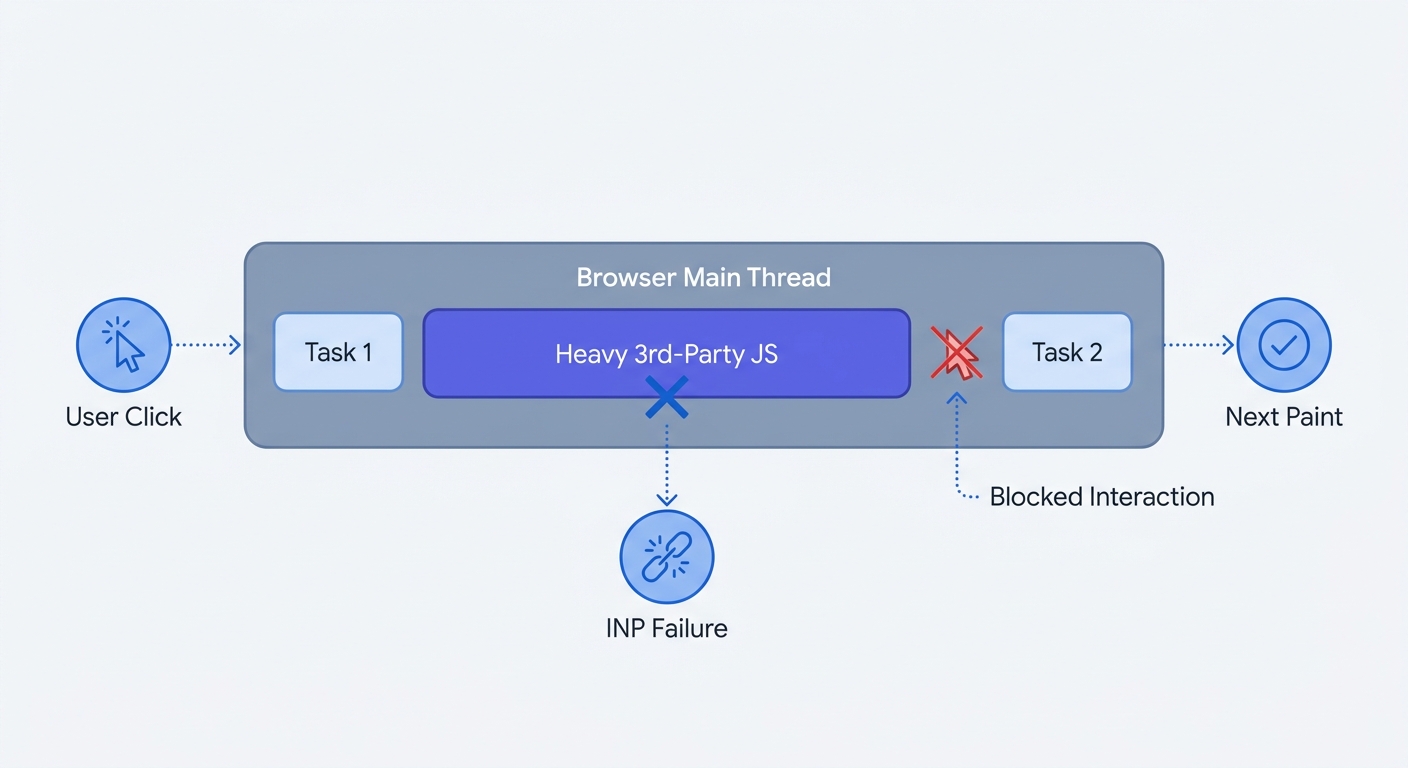
Web browsers rely on a single main thread to parse HTML text, execute logic, and paint pixels. Ad trackers, heatmaps, and analytics libraries monopolize this limited thread with long-running background tasks.
A visitor attempts to open a mobile menu while a third-party tag executes in the background. The browser ignores the visitor's tap until the tracking script finishes parsing. This queue creates high input delay.
Audit main thread activity in Chrome DevTools to locate the offenders.
- Open the developer console and navigate to the Performance tab.
- Throttle the CPU to 4x slowdown to simulate a mid-tier mobile device.
- Click the record button and interact with site elements.
- Stop the recording and examine the timeline.
Identify the red blocks labeled "Long Tasks" in the performance timeline. Click these blocks to isolate the script URL freezing the browser. External marketing domains generate these blocking tasks. Remove unnecessary scripts from the codebase to improve the INP score and restore responsive interactions.
How to Reduce Page Load Time: Actionable Steps
Manage page speed as a continuous codebase optimization task. Follow these technical workflows to accelerate browser rendering.
1. Clean Up Your Marketing Stack
Marketing departments accumulate tracking pixels over years of disparate campaigns. Each forgotten tag drags down client-side performance.
Audit Google Tag Manager: Open the GTM container. Identify tags tied to inactive advertising campaigns, defunct heatmapping tools, or legacy affiliate networks. Pause and delete every unused pixel before consolidating the remaining tags.
Switch to Lightweight Analytics: Stop forcing users to download bloated code libraries. Deploy an open-source, cookie-free tool like Swetrix. This choice reduces the analytics payload by 98% and bypasses the performance-killing cookie banner. Clean tracking logic requires fewer CPU cycles.
Adopt UTM Tracking: Rely on URL parameters instead of heavy JavaScript to track campaign sources. Generate links using a UTM code builder and append them to ad assets. The server logs the referral data without requiring external script execution.
Migrate to Server-Side Tracking: Move data processing off the visitor's smartphone. Set up a server-side tracking environment. The browser sends a single data stream to a proprietary server. The server then distributes that data to Facebook, Google, and other marketing endpoints.
2. Optimize Content Delivery
Media files dominate the total payload size of a typical webpage. Shrink these assets before attempting to optimize server architecture.
Deploy Next-Gen Image Formats: Stop serving outdated JPEGs and PNGs. Convert raster images to WebP or AVIF formats. These modern codecs deliver superior compression algorithms. Site owners cut file sizes by 30% to 50% without quality degradation.
Implement Native Lazy Loading: Prevent off-screen images from consuming initial bandwidth. Add the loading="lazy" attribute to all <img> and <iframe> tags located below the fold.
<img src="product-photo.avif" alt="Running Shoe" loading="lazy" width="800" height="600" />
The browser skips downloading these assets until the user scrolls near them. This behavior prioritizes the network connection for primary above-the-fold text and hero images. Include explicit width and height attributes to prevent Cumulative Layout Shift (CLS) as the images load into the viewport.
Configure a Content Delivery Network: Physical distance dictates network latency. A user in Tokyo experiences high Time to First Byte (TTFB) if the origin server sits in New York. Route incoming traffic through a global CDN. The network caches static assets on edge servers around the world. Visitors download files from the geographic node closest to them.
Optimize Web Fonts: Custom typography delays text rendering, as browsers hide text until the associated font file finishes downloading. Fix this by adding font-display: swap to the CSS @font-face declarations.
@font-face {
  font-family: "CustomSans";
  src: url("customsans.woff2") format("woff2");
  font-display: swap;
}
This rule instructs the browser to display a fallback system font. Once the custom font downloads, the browser swaps the styles. The user begins reading the content without staring at a blank container.
3. Modernize the Codebase
The order in which files execute matters as much as their file size. Control how the browser handles external resources.
Control Script Execution: By default, a <script> tag forces the browser to stop parsing HTML, download the external file, and execute the code. Prevent this blockage by modifying the script attributes.
| Attribute | Execution Behavior | Best Use Case |
|---|---|---|
| None | Pauses HTML parsing to fetch and execute upon download. | Critical UI scripts required for the layout to function. |
async | Fetches in parallel. Executes as soon as the download completes. | Independent tracking snippets or ad units. |
defer | Fetches in parallel. Executes after HTML parsing completes. | Heavy logic requiring a fully loaded Document Object Model (DOM). |
Apply defer to heavy secondary tools like support chat widgets. Reserve async for isolated tracking snippets.
Establish Early Connections: Use HTML resource hints to speed up third-party requests. Add a preconnect link to the document <head> for external domains hosting required assets.
<link rel="preconnect" href="https://fonts.googleapis.com" />
The browser performs the DNS lookup, TCP handshake, and TLS negotiation in the background before the CSS requests the resource. Developers save hundreds of milliseconds later in the render path.
Monitor with Lab and Field Tools: Track optimizations using objective data. Run URLs through Google PageSpeed Insights to isolate rendering blockers in a controlled lab environment. Examine the resulting waterfall charts in WebPageTest to observe the millisecond a third-party script requests data. Cross-reference these lab tests against field data. Connect the domain to the Chrome User Experience Report to monitor how visitors experience site speed over a 28-day rolling window.
Stop sacrificing site performance for marketing data. Bloated tracking scripts block the main thread, inflate bounce rates, and trigger expensive privacy compliance requirements. Track visitors without penalizing the user experience. Deploy a cookie-free analytics platform that loads in milliseconds and preserves Core Web Vitals scores. Create an account today.