- Date
How To Monitor Website JavaScript Errors And Boost Conversions
 Andrii Romasiun
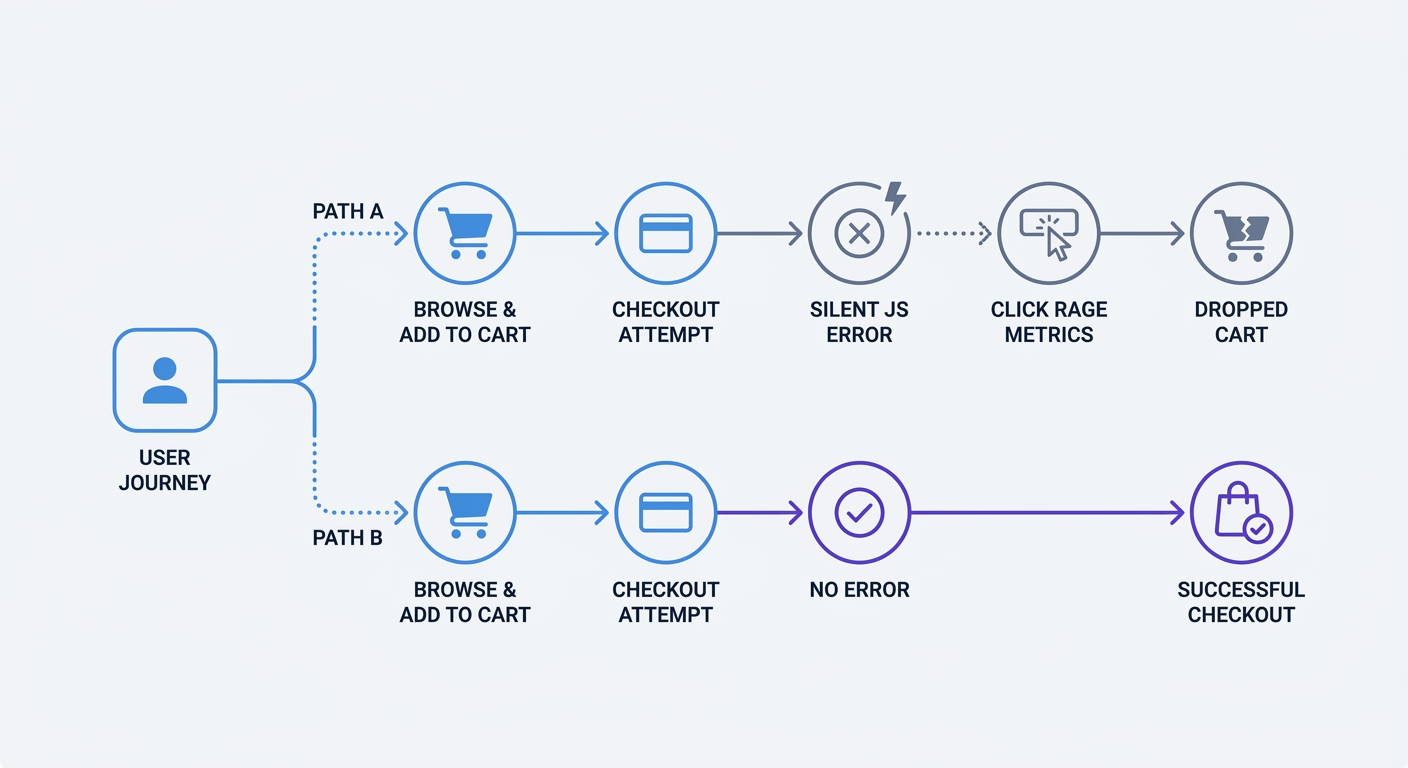
A significant number of website sessions experience a JavaScript error. A customer clicks "Add to Cart," the button registers the action, and a silent script failure stops the checkout process. The user leaves, costing your business the sale.
Ecommerce websites often harbor five or more unresolved JavaScript errors. Engineers who fix these bugs recover lost revenue and improve the user experience.
Deploying heavy error-tracking SDKs slows down your site and risks exposing sensitive user data. Swetrix offers a lightweight, privacy-conscious way to catch these bugs without deploying cookie-dependent scripts.
Why Unseen JavaScript Errors Cost You Revenue
The Hidden Toll on Ecommerce Platforms
Eight percent of retail shoppers abandon more than 10 purchases a year due to broken or slow websites. Frontend errors break form validations, payment gateways, and product carousels, causing these abandonments.
Every unhandled exception creates friction. Website conversion rates drop by an average of 4.42% with each additional second of load time between zero and five seconds, though this penalty varies by industry and whether the site is B2B or B2C. Heavy JavaScript payloads exacerbate these errors and make the performance problem worse. When a background script crashes, the browser halts rendering to parse the failure, a process that spikes CPU usage on the user device and delays the page load.
Silent failures do the most damage. A syntax error in a promotional pop-up script might not crash the whole page, but it prevents the email capture field from rendering. You lose the lead without ever seeing a disruption in your uptime monitoring, making frontend exception tracking a requirement for visibility.
How Errors Drain Developer Time
Thirty-two percent of software developers spend up to 10 hours a week chasing bugs. These engineers dig through generic console logs trying to replicate a failure that occurred on an obscure mobile browser.
You save these hours by capturing the exact stack trace and environment data at the moment of failure. A raw user complaint provides zero context, stating that a button failed. An error tracking platform provides the device type, browser version, timestamp, and the exact line of code that triggered the failure. Engineers fix the bug in minutes, avoiding days of recreating the user environment.
Core Methods: How to Monitor Website JavaScript Errors
Using Global Error Handlers
Catch unhandled exceptions across your entire application using global listeners. The browser provides built-in methods to capture errors that escape your local error boundaries.
Open your main application file and implement the window.onerror event listener at the top of your execution stack. This listener captures standard runtime errors, syntax errors, and undefined variables.
window.onerror = function (message, source, lineno, colno, error) {
  const payload = {
    msg: message,
    url: source,
    line: lineno,
    column: colno,
    stack: error ? error.stack : null,
  };
  // Send payload to your Swetrix error tracking endpoint
};
Modern web applications rely on asynchronous JavaScript and Promises. Because the window.onerror method misses Promise rejections, you must add the unhandledrejection event listener to track failed API calls and timeouts.
window.addEventListener("unhandledrejection", function (event) {
  let message, stack;

  // Normalize event.reason which can be any value (Error, string, object, etc.)
  if (event.reason instanceof Error) {
    message = event.reason.message;
    stack = event.reason.stack;
  } else if (event.reason && typeof event.reason === "object" && "message" in event.reason) {
    message = event.reason.message;
    stack = event.reason.stack || null;
  } else {
    // Coerce non-Error values to a safe string
    try {
      message = JSON.stringify(event.reason);
    } catch (e) {
      message = String(event.reason);
    }
    stack = null;
  }

  const payload = {
    reason: message,
    stack: stack,
  };
  // Send payload to your tracking endpoint
});
These two listeners form your baseline defense by catching the unexpected failures that bypass your active error management.
Implementing Try/Catch Blocks
Wrap risky operations in try/catch blocks to prevent the entire UI from crashing. Network requests, DOM manipulations, and local storage access fail without warning, and a missing HTML element crashes the interface if left unhandled.
Enclose API calls in a try block and log the failure to your tracking service in the catch block. The interface degrades with a fallback message, preventing the application from freezing.
async function submitCheckout(cartData) {
  try {
    const response = await fetch("/api/checkout", {
      method: "POST",
      body: JSON.stringify(cartData),
    });

    if (!response.ok) {
      throw new Error(`Checkout failed with status: ${response.status}`);
    }

    showSuccessPage();
  } catch (error) {
    trackErrorEvent("checkout_failure", error.message);
    showUserFallbackMessage("Payment delayed. Try again.");
  }
}
This pattern isolates the failure, allowing you to log the exact context of the error while keeping the rest of the page functional.
Decoding with Source Maps
Upload source maps to your monitoring tool to decode minified production code. Build tools like Webpack and Vite compress your code into a single unreadable line. An error report pointing to app.min.js:1:432 provides zero value to an engineer investigating a bug.
Source maps reverse this compression. The monitoring tool uses the map file to translate the minified stack trace back into readable file names, functions, and line numbers.
Keep source maps off your public-facing servers. Exposing public source maps hands your proprietary code structure to competitors and attackers. Upload the .map files direct to your tracking provider during your CI/CD deployment phase, then delete them from the public build directory. The tracking server decodes the stack traces in private, giving your engineers actionable data without compromising security.
Filtering the Noise and Tracking What Matters
Identifying UX Bottlenecks Like Click-Rage
Engineers experience alert fatigue from high error volumes. Teams must filter the data to find the failures impacting actual customers.
Track frustration metrics alongside technical failures. Engineers using modern observability tools link script failures to click-rage, a behavior where a user clicks a broken submit button multiple times in rapid succession. Identifying these click-rage clusters highlights silent errors that break the user journey without causing a full page crash.
Engineers monitoring a flight booking site might see zero server-side errors, yet users abandon the final step. Correlating a spike in click-rage on the "Confirm Flight" button with a silent JavaScript error on that specific element gives developers the exact cause of the abandonment.
Review the specific error types hitting your tracking endpoints. Analysts reviewing Microsoft telemetry data found that "Illegal invocation errors" account for 7.4% of common frontend issues, while "Unexpected Token '<'" makes up another 6.5%. This pattern occurs when a server returns an HTML error page to a browser expecting JSON data. Teams grouping these recurring patterns prioritize fixes faster.
Ignoring Third-Party Script Distractions
Ignore errors thrown by domains you do not control. Browser extensions, ad networks, and third-party chat widgets throw thousands of console errors a day. Monitoring these external failures obscures the bugs in your own code.
Configure Cross-Origin Resource Sharing (CORS) attributes to filter this noise. The browser blocks detailed stack traces for scripts loaded from different domains to prevent information leaks. Add the crossorigin="anonymous" attribute to your script tags to capture detailed errors for your own CDNs.
<script src="https://cdn.yourdomain.com/app.js" crossorigin="anonymous"></script>
Set custom filters in your tracking tool to discard any payload originating from unknown domains. Block strings containing chrome-extension:// or moz-extension://. This step prevents ad-blockers and password managers from flooding your monitoring dashboard with false alarms.
The Privacy Challenge: Tracking Errors Without Leaking PII
GDPR Risks Hiding in Stack Traces
Error logs present massive compliance risks under GDPR and CCPA. Stack traces capture sensitive user data inside the application state.
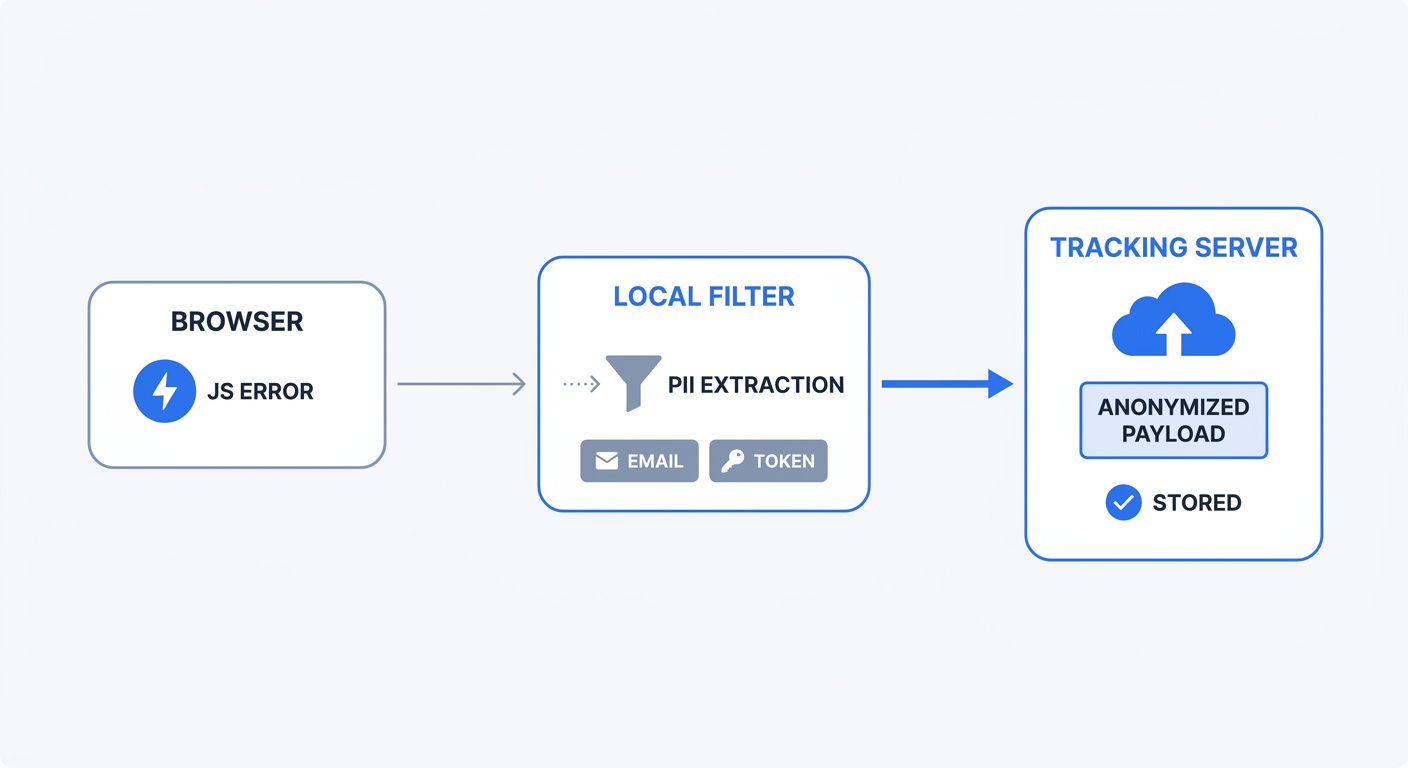
An error object holds a full API request payload containing email addresses, session tokens, physical addresses, or credit card endpoints. Storing this Personally Identifiable Information (PII) on a centralized logging server without explicit user consent violates major privacy laws.
Data minimization laws require engineers to collect the minimum data required to perform the task. Standard analytics setups fail this requirement by grabbing the entire user context, binding it to a tracking cookie, and shipping it to a remote database. If a data breach hits that log database, regulatory agencies fine your company.
The Swetrix Advantage for Anonymized Telemetry
Implement data minimization rules on the client side. Swetrix solves the PII problem by capturing technical failures while maintaining user privacy. Initialize the tracking script and enable error tracking to capture frontend exceptions automatically.
swetrix.init("your_project_id");
swetrix.trackErrors();
The anonymized telemetry reaches the server free of compliance risks. This cookie-free approach tracks technical failures without demanding user consent for basic performance monitoring. Engineers see the broken checkout button and the exact line of code that caused the failure, maintaining complete anonymity for the user who clicked it.
Setting Up Your Error Monitoring Workflow
Choosing the Right Monitoring Tools
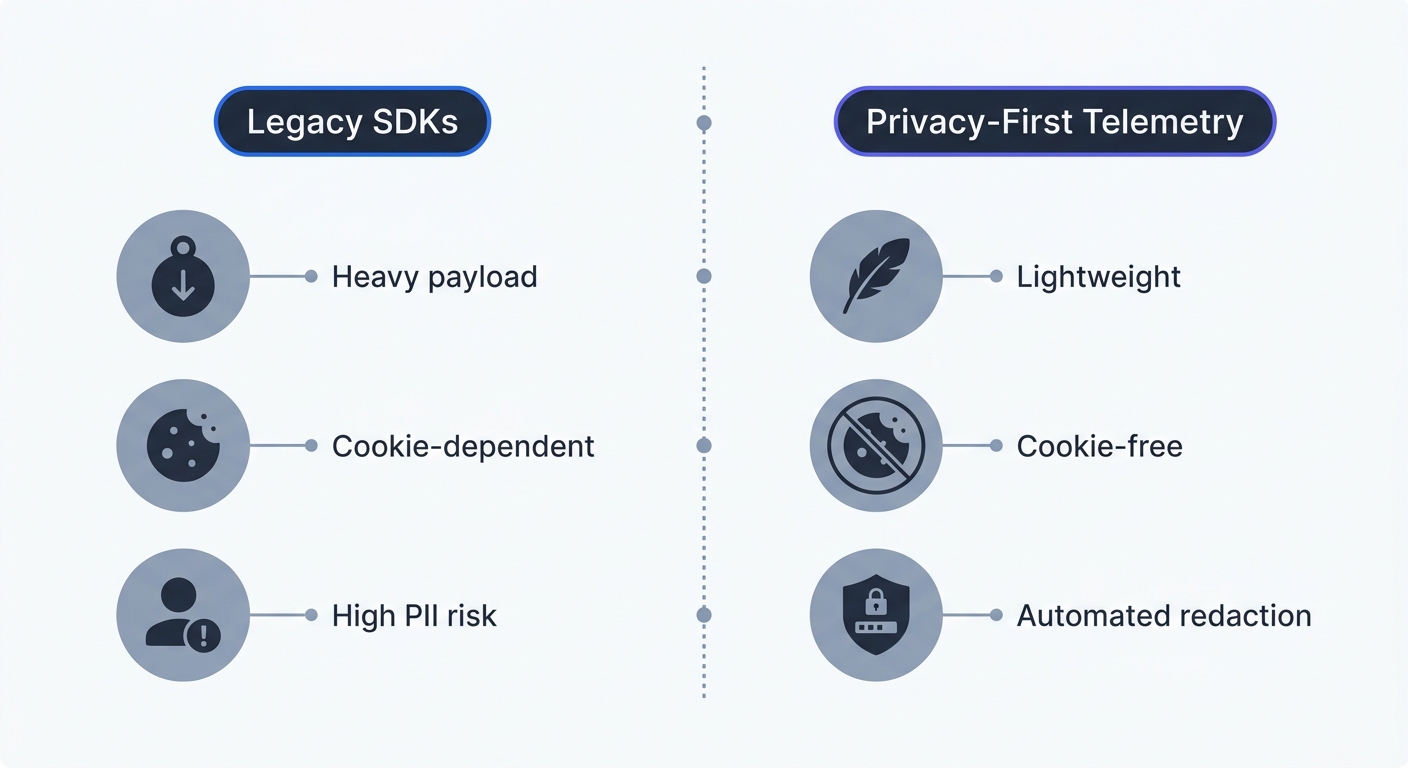
Select a monitoring tool built for modern privacy standards. Legacy SDKs rely on heavy device fingerprinting and massive payload sizes. Swetrix provides a privacy-first alternative that unifies performance monitoring, error tracking, and user analytics without the bloat.
| Feature | Legacy Error Trackers | Swetrix Privacy-First Tracking |
|---|---|---|
| Data Collection | Captures full state by default | Enforces data minimization |
| PII Risk | High risk of logging user tokens | Privacy-focused error tracking |
| Script Weight | Heavy payload, slows page load | Lightweight, minimal overhead |
| Cookie Dependency | Requires cookies for session mapping | 100% Cookie-free telemetry |
| Compliance | Requires complex GDPR consent | Out-of-the-box compliance |
Developers gain detailed stack traces and error rates while maintaining a fast, compliant application. Consolidating your analytics setup into one lightweight platform removes the need for multiple tracking scripts.
Setting Smart Alerting Thresholds
Establish automated alerting rules based on business impact. A spike in raw error volume provides zero actionable insight if a single user triggers a minor cosmetic bug 500 times. Pure volume alerts lead engineers to mute the monitoring channel.
Tie alerts to specific conversion paths by setting a threshold for your checkout flow. If the /checkout route throws more than 10 errors in a five-minute window, trigger an immediate notification to the engineering Slack channel.
Use percentage-based thresholds for high-traffic pages. Configure the monitor to alert the team if the error rate exceeds 2% of total page views over an hour. This relative metric accounts for natural traffic spikes during marketing campaigns. Allow isolated, low-impact errors to batch into a daily summary report, a workflow that protects developer focus and guarantees fast responses to critical revenue blocks.
You need visibility into your frontend performance without compromising user trust or page speed. Swetrix provides an open-source, cookie-free web analytics platform with built-in error tracking and performance monitoring. Start capturing the data that matters with our 14-day free trial and keep your conversion paths bug-free.